


Press release
Tractor Plant Setup Cost 2026: Feasibility Study Report, CapEx, OpEx, Investment & Business Plan
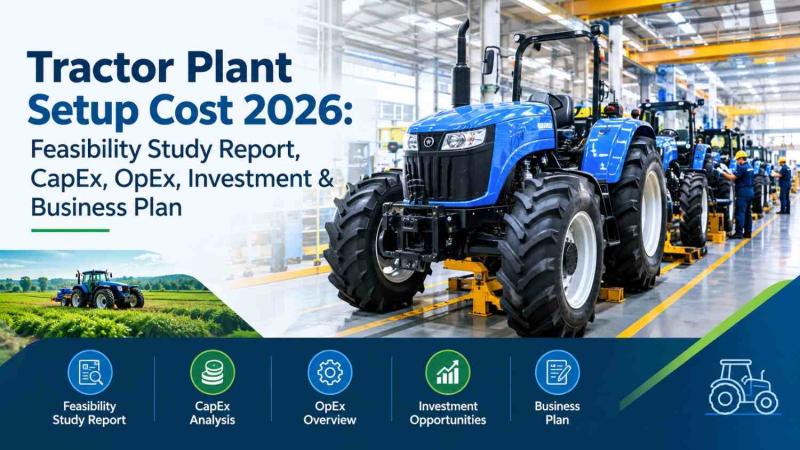
This business plan report covers what capacity to target, which raw materials to secure, what machinery and site conditions are required, how capital and operating costs break down, and what profitability and regulatory factors determine commercial viability for a tractor manufacturing plant. It draws on IMARC Group's Tractor Manufacturing Plant Project Report 2026, which benchmarks a facility with an annual production capacity of 20,000-50,000 units.
Request Sample: https://www.imarcgroup.com/tractor-manufacturing-plant-project-report/requestsample
Minimum Cost Required to Set Up a Tractor Manufacturing Plant:
The minimum capital required to enter tractor manufacturing is high compared with most process industries, because the business is assembly-intensive and machinery-heavy. Industry cost benchmarking for recent greenfield tractor plants points to roughly USD 50 million (about ₹440 Cr) as an entry point for a facility at the lower end of the 20,000-50,000 unit range, scaling into the low hundreds of millions of dollars for plants approaching the upper end of that range.
Cost Breakdown by Plant Scale:
Small-Scale Tractor Plant (~20,000 units/year) ($50M-$80M / ₹440Cr-₹705Cr): Focuses on engine and body assembly, hydraulic and transmission integration, cabin installation, painting, and end-of-line testing, generally with moderate automation and a largely bought-in component base.
Mid-Sized Tractor Plant (~30,000-40,000 units/year) ($90M-$140M / ₹790Cr-₹1,230Cr): Includes CNC machining, welding, engine assembly lines, hydraulic assembly, painting booths, and testing rigs, with higher automation and deeper process integration.
Large Integrated Tractor Facility (~50,000 units/year) ($150M+ / ₹1,320Cr+): Combines large-scale machining, fabrication, engine and transmission assembly, automated painting, high-volume final assembly, and integrated utilities and quality-control systems.
1. Why Tractor Manufacturing Matters in 2026:
Tractors sit at the center of agricultural mechanization. Farmers are under pressure to raise crop yields while labor costs climb, and tractors - powered by high-horsepower engines, hydraulic systems, and transmission units - are the core machine for plowing, planting, harvesting, and hauling. Demand is being pulled from two directions: modernizing farm operations and growing use of tractors in construction, forestry, and industrial material handling.
Policy and infrastructure are major accelerants. Government subsidies and rural development schemes support farm mechanization in developing economies. In India, Himachal Pradesh approved 294 rural road projects spanning approximately 1,538 km with a budget of INR 2,247 crore in the 2025-26 fiscal year - improved road connectivity of this kind supports agricultural mechanization and efficient farm operations, and is expected to boost tractor demand.
Against this backdrop, the India tractor market's projected climb from USD 9.4 Billion (2025) to USD 15.9 Billion (2034) reflects sustained, structurally driven demand rather than a cyclical spike - which is what makes new capacity additions commercially attractive right now.
Why Invest in Tractor Manufacturing?
Five factors make tractor manufacturing a comparatively attractive industrial investment:
• Growing mechanization in agriculture: Farmers need more efficient machines to achieve higher crop yields, keeping baseline demand for tractors strong.
• Enhanced productivity and precision: Modern tractors deliver consistent performance, reducing labor expenses while improving operational efficiency on farms.
• Expanding agro-industrial sector: Agricultural businesses, contract farming operations, and rural mechanization initiatives continue to create a need for tractors.
• Customization and technological upgrades: Manufacturers can develop regional tractor models with fuel-efficient engines and technology upgrades tailored to market requirements.
• Scalable and capital-intensive production: High starting costs act as an entry barrier, but the model delivers substantial financial gains and room for operational growth.
Regional Insights:
Tractor demand growth is not uniform - it is shaped by each region's farm structure, mechanization level, and government support priorities:
• Asia Pacific (China, India, Japan, South Korea, Australia, Indonesia, Thailand, Malaysia, Vietnam, Philippines, Singapore): Rising farm mechanization, government subsidies and rural development schemes, rural infrastructure build-out such as new road connectivity, and rising labor costs pushing farmers toward mechanized equipment.
• North America (U.S., Canada, Mexico): Large-scale commercial farming, demand for high-horsepower and high-efficiency tractors, and growing adoption of GPS-guided and precision-agriculture systems.
• Europe (Germany, U.K., France, Italy, Spain, Netherlands, Belgium, Poland, Sweden, Norway, Denmark, Switzerland): Technology-led demand for fuel-efficient engines, automated machines, and electric tractors, with strong manufacturer activity showcased at industry events such as Agritechnica.
• Latin America (Brazil, Argentina, Mexico, Colombia, Chile, Peru, Paraguay, Uruguay, Ecuador): Expansion of large commercial farms and contract farming, along with agro-industrial growth that increases the need for mechanized equipment.
• Middle East & Africa (Saudi Arabia, UAE, Qatar, Kuwait, Oman, Israel, Egypt, South Africa, Nigeria, Morocco, Algeria, Kenya, Ethiopia, Tanzania, Ghana): Agricultural development programs, rural mechanization initiatives, and growing construction and material-handling needs in developing economies.
2. What is a Tractor and Where is It Used:
Tractors are powerful vehicles used by agricultural and industrial workforces to pull equipment and operate machines. Modern tractors combine high-horsepower engines with hydraulic systems, transmission units, and operator cabins that provide comfort and safety. They are available as two-wheel drive, four-wheel drive, utility, row-crop, and specialty models, and use a power take-off (PTO) system, adjustable linkages, and increasingly GPS-guided systems to power implements. Their application footprint extends beyond farming alone:
• Agriculture and farming: Plowing, planting, harvesting, land preparation, and crop transport across small farms and large commercial fields.
• Construction industry: Earthmoving, material handling, and site work using tractor-mounted or tractor-drawn equipment.
• Forestry operations: Log transportation, base-area preparation, and support for sustainable forestry methods.
• Industrial material handling: Moving heavy items across industrial sites with specialized attachments.
This diversified end-use base is part of what supports steady demand even as farm cycles vary by region.
3. Tractor Manufacturing Process:
Tractor manufacturing follows a defined sequence of unit operations:
• Raw material sourcing - procurement of steel sheet, cast iron, engines, transmissions, tires, hydraulics, and electronics.
• Engine assembly - engines are assembled and prepared for integration with the chassis.
• Body assembly - fabricated and welded components are assembled into the tractor body and chassis.
• Hydraulic and transmission system integration - hydraulic circuits, transmission units, and drivetrain elements are fitted and connected.
• Cabin installation - operator cabins and controls are installed where the model requires them.
• Painting - assembled units are coated in painting booths for finish and protection.
• Quality inspection - completed tractors are tested on testing rigs and inspected against quality criteria.
• Packaging for shipment - finished tractors are packed and dispatched to dealers and end markets.
A robust quality assurance system should run in parallel with these stages, using analytical instruments to monitor performance and process parameters, with documentation maintained for traceability and regulatory compliance.
4. Raw Materials and Sourcing:
Reliable supply of steel and major components is the single most important operating input for a tractor manufacturing plant, given that raw materials account for the large majority of operating expenses. Core raw material and process inputs include:
• Steel sheet (primary raw material)
• Cast iron
• Engines
• Transmissions
• Tires
• Hydraulics
• Electronics
Sourcing strategy should prioritize suppliers close to the plant to minimize transportation costs, alongside long-term contracts that stabilize pricing and secure supply continuity. Supply chain and sustainability risk should be assessed as part of supplier selection, since input price volatility flows directly into margin.
Speak to analyst for customized report: https://www.imarcgroup.com/request?type=report&id=8630&flag=C
5. Site Selection and Plant Layout:
Site selection for a tractor manufacturing business should prioritize:
• Proximity to raw materials - easy access to steel sheet, cast iron, engines, transmissions, tires, hydraulics, and electronics.
• Proximity to target markets - minimizing distribution costs for finished tractors.
• Infrastructure robustness - reliable transportation, utilities, and waste management systems.
• Regulatory fit - compliance with local zoning laws and environmental regulations.
Plant layout should be optimized for workflow efficiency, safety, and minimal material handling, with clearly separated zones for raw material storage, production, quality control, and finished goods storage. Sponsors should also reserve space for future expansion, since tractor plants - like most assembly manufacturing facilities - tend to scale capacity over their operating life rather than remain static.
6. Machinery and Equipment Requirements:
Key equipment categories for a tractor manufacturing plant include:
• CNC machines
• Engine assembly lines
• Welding equipment
• Hydraulic assembly tools
• Painting booths
• Testing rigs
All machinery should comply with industry standards for safety, efficiency, and reliability - a material consideration given the heavy-duty nature of tractor components and the need for consistent quality at scale. Equipment selection and automation level are also the primary determinants of machinery cost, which represents the largest single component of capital expenditure.
7. Capital Investment (CapEx) for a Tractor Manufacturing Plant:
Total capital investment for a tractor factory setup depends on plant capacity, technology selection, and location, and covers land acquisition, site preparation, and necessary infrastructure. IMARC's cost analysis breaks CapEx into four categories:
• Land and Site Development Costs: Land registration, boundary development, and related site-preparation charges.
• Civil Works Costs: Construction of production halls, storage, and supporting civil infrastructure.
• Machinery Costs: The largest single portion of total CapEx - CNC machines, engine assembly lines, welding equipment, hydraulic assembly tools, painting booths, and testing rigs.
• Other Capital Costs: Pre-operative expenses and miscellaneous capital items.
Machinery costs account for the largest portion of total capital expenditure, while land and site development costs - covering registration, boundary development, and related charges - form a substantial part of the overall investment as well. Because the exact split varies significantly with capacity, technology, and location, sponsors evaluating a specific project should work from a capacity- and location-specific cost model rather than a generic industry average.
8. Operating Cost (OpEx) Structure:
Operating expenditure for a tractor manufacturing plant is dominated by raw material cost. Based on IMARC's analysis:
• Raw Materials (steel sheet, cast iron, engines, transmissions, tires, hydraulics, electronics): 65-75% of total OpEx
• Utilities: 10-15% of total OpEx
• Transportation, Packaging, Salaries & Wages, Depreciation, Taxes, Other Expenses: Remaining balance
This cost structure has a direct strategic implication: raw material procurement strategy is the primary lever for OpEx control in a tractor plant, far more than utility efficiency or labor optimization alone. In the first year of operations, operating costs cover raw materials, utilities, depreciation, taxes, packing, transportation, and repairs and maintenance; by the fifth year, total operational cost is expected to rise materially due to inflation, market fluctuations, and potential increases in the cost of key materials, alongside supply chain disruptions and shifts in the global economy.
Buy Now: https://www.imarcgroup.com/checkout?id=8630&method=2175
9. Profitability and Financial Outlook:
A tractor manufacturing plant demonstrates healthy profitability potential under normal operating conditions, supported by stable demand and value-added applications:
• Gross Profit Margin: 20-30%
• Net Profit Margin: 8-12%
Financial projections for a specific project should be developed from realistic assumptions on capital investment, operating costs, capacity utilization, pricing trends, and demand outlook, and should incorporate ROI, net present value (NPV), payback period, and a full profit-and-loss analysis rather than relying on the industry-average margins above as a substitute. These averages are useful for feasibility screening, not for financing-stage decisions.
10. Regulatory and Policy Landscape:
Regulatory and policy support is one of the strongest arguments for new tractor capacity right now. Government subsidies and rural development schemes continue to back agricultural mechanization, and rural infrastructure spending - such as Himachal Pradesh's 2025-26 program of 294 rural road projects covering approximately 1,538 km - improves the connectivity that mechanized farming depends on.
Beyond demand-side policy, project sponsors should plan for:
• Business registration and factory licensing
• Environmental clearances, including effluent treatment and emission-standard compliance
• Safety and fire certifications
• Industry-specific permits, which vary by local, state, and national jurisdiction
Government incentives - capital subsidies, tax exemptions, reduced utility tariffs, export benefits, or interest subsidies - may also be available depending on the region and should be factored into project financing.
11. Latest Industry Developments:
• November 2025: Iveco Group's FPT, which designs powertrains for on-road, off-road, marine, and power generation applications, secured long-term contracts with SDF, JCB, and Lindner, unveiled at Agritechnica 2025. At the same event, FPT powered three Tractor of the Year award winners: the Claas Axion 9.450 Terra Trac, the New Holland T4.120 F Auto Command, and the JCB New Fastrac 6300.
• February 2025: Gromax Agri Equipment (a joint venture between Mahindra & Mahindra Ltd and the Government of Gujarat) marked its 25th anniversary and launched five new tractor models aimed at enhancing performance, versatility, and efficiency for farmers, expanding its product line-up to meet diverse agricultural needs.
12. Leading Tractor Manufacturers:
The global tractor industry is led by multinational companies with extensive production capacities and diversified application portfolios, including:
• Deere and Company
• Kubota Corporation
• Mahindra Tractors
• CNH Industrial
• AGCO Corporation
These companies collectively serve end-use sectors spanning agriculture, construction, forestry, and industrial material handling.
Browse Full Report: https://www.imarcgroup.com/tractor-manufacturing-plant-project-report
Frequently Asked Questions:
1. How much capital is required to start a tractor manufacturing plant?
Capital requirements generally include land acquisition, construction, machinery procurement, installation, pre-operative expenses, and initial working capital. The total amount varies with capacity, technology, and location.
2. How do I start a tractor manufacturing business?
Starting a tractor manufacturing business requires a market feasibility study, securing required licenses, arranging funding, selecting suitable land, procuring machinery, recruiting skilled labor, and establishing a supply chain and dealer network.
3. What raw materials are required for tractor manufacturing?
Tractor manufacturing uses steel sheet, cast iron, engines, transmissions, tires, hydraulics, and electronics. Steel sheet is the primary raw material and a major driver of operating cost.
4. What machinery and equipment are required to start a tractor manufacturing plant?
A tractor plant typically requires CNC machines, engine assembly lines, welding equipment, hydraulic assembly tools, painting booths, and testing rigs, along with material handling systems and quality-control equipment.
5. What are the biggest challenges in starting a tractor manufacturing business?
High capital requirements, securing regulatory approvals, ensuring a steady supply of steel and major components, competition from established manufacturers, skilled manpower availability, and managing operational risks.
6. Who are the top tractor manufacturers in the world?
Deere and Company, Kubota Corporation, Mahindra Tractors, CNH Industrial, and AGCO Corporation.
About Us:
IMARC Group is a global management consulting firm that helps the world's most ambitious changemakers create a lasting impact. The company excels in understanding its clients' business priorities and delivering tailored solutions that drive meaningful outcomes. IMARC Group provides a comprehensive suite of market entry and expansion services, including market assessment, feasibility study & DPR, company incorporation assistance, factory setup support, regulatory approvals and licensing navigation, branding, marketing and sales strategies, competitive landscape and benchmarking analyses, pricing and cost research, and procurement research.
Contact Us:
IMARC Group
134 N 4th St. Brooklyn, NY 11249, USA
Email: sales@imarcgroup.com
Tel No: (D) +91 120 433 0800
United States: (+1-201-971-6302)
This release was published on openPR.
Permanent link to this press release:
Copy
Please set a link in the press area of your homepage to this press release on openPR. openPR disclaims liability for any content contained in this release.
You can edit or delete your press release Tractor Plant Setup Cost 2026: Feasibility Study Report, CapEx, OpEx, Investment & Business Plan here
News-ID: 4648169 • Views: …
More Releases from IMACR Group
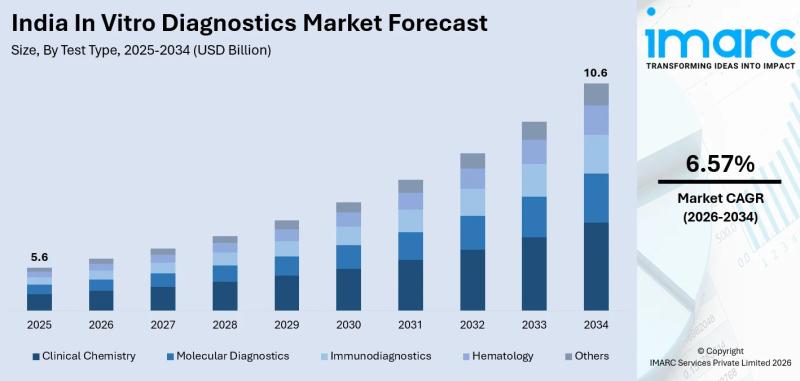
India In Vitro Diagnostics Market 2026-2034: Size, Consumer Trends, Growth Insig …
How Is India In Vitro Diagnostics Market Performing?
India's in vitro diagnostics (IVD) market stands as one of South Asia's fastest-growing healthcare technology segments, encompassing Clinical Chemistry, Molecular Diagnostics, Immunodiagnostics, Hematology, and Other test types, Reagents and Kits and Instruments product categories, Disposable and Reusable IVD Devices, Infectious Disease, Diabetes, Cancer/Oncology, Cardiology, Autoimmune Disease, Nephrology, and Other applications, and Hospitals Laboratories, Clinical Laboratories, Point-of-Care Testing Centers, Academic Institutes, Patients, and Other…
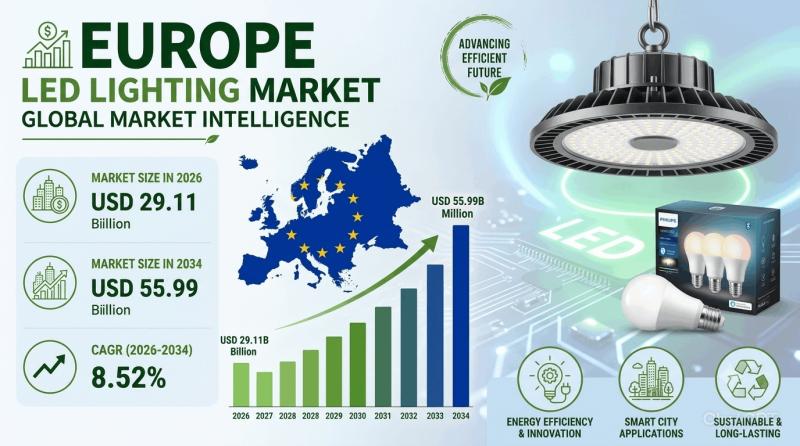
Europe LED Lighting Market Size to Reach USD 55.99 Billion by 2034 at 8.52% CAGR
The Europe LED lighting market grew from USD 26.83 Billion in 2025 to USD 29.11 Billion in 2026 and is projected to reach USD 55.99 Billion by 2034, exhibiting a CAGR of 8.52% during 2026-2034. EU energy efficiency regulations, urban infrastructure modernisation, rising adoption of smart and connected lighting, and retrofit demand across commercial and residential buildings are driving the Europe LED lighting market growth. LED Lamps and Modules lead…
Biodegradable Pla Plant Setup Cost 2026: Feasibility Study Report, CapEx, OpEx, …
Setting up a biodegradable PLA production plant in 2026 requires clarity on a few core variables: feedstock choice, production capacity, capital investment, operating cost structure, and profitability under prevailing policy conditions. This feasibility study covers the biodegradable PLA production plant cost, and the machinery and raw materials needed. The global polylactic acid (PLA) market was valued at USD 1,298.0 Million in 2025 and is projected to reach USD 4,155.4 Million…
United States Legionella Testing Market Size Trends & Growth Analysis Report 203 …
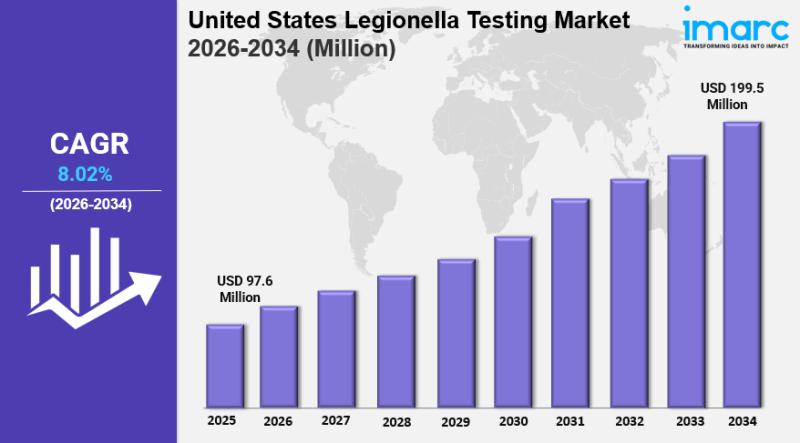
IMARC Group has recently released a new research study titled "United States Legionella Testing Market Size, Share, Trends and Forecast by Test Type, Technology, End User, and Region, 2026-2034", offers a detailed analysis of the market drivers, segmentation, growth opportunities, trends and competitive landscape to understand the current and future market scenarios.
United States Legionella Testing Market Outlook 2026-2034 Growth, Trends, and Investment Opportunities
The United States Legionella testing market size is…
More Releases for Trac
Global Dumbbell Market: Precor, Star Trac, StairMaster, Ivanko
The Global Dumbbell Market 2016 Industry Research Report focused on major manufacturers, regions, type as well as application of the Dumbbell industry. “Dumbbell English dumbbell weightlifting and fitness exercise of a kind of auxiliary equipment.Smaller than a barbell.Light dumbbell weight 6, 8, 12, 16 pounds (1 pound = 0.4536 kg), etc.The weight of the heavy weights have 10, 15, 30 kg, etc.By the general fitness enthusiasts.Without a sound, when practice…
Star Trac Exec John Sweeney Joins HydroMassage
After a successful 18 year tenure with Star Trac, fitness industry veteran John Sweeney has joined HydroMassage as Vice President of Commercial Sales.
Sweeney, whose most recent roles with Star Trac included Regional Sales Director and VP of North American Sales, brings a strong track record of success to HydroMassage as the company continues to focus on growth in the fitness industry.
"The addition of John to our team really comes at…
trac-x Trading Results August 2009
On the European platform trac-x transport capacity trading totalled 574.65 GWh/h in August.
This includes 140 MWh/h traded in the day-ahead section of trac-x, where 14 out of the 1,910 (67.634 MWh/h) offered day-ahead entries were successfully sold. At the cross-border point Bunde/Oude Statenzijl (entry) the average price for traded day-ahead capacities amounted to € 8.00 per MWh/h per day.
In the long-term section of the platform a total of 574.51…
trac-x Trading Results in July
Leipzig, 5 August 2009 – In the day-ahead section of the European trading platform trac-x a total capacity of 410 MWh/h was sold in July. Overall, 33 out of 2,537 (93,959 MWh/h) day-ahead procedures offered on the platform were successfully sold. At the cross-border point Bunde/Oude Statenzijl (entry) the average price for traded day-ahead capacities amounted to € 8.00 per MWh/h per day. At the network point Steinitz (exit) it…
trac-x Trading Results in April
In the Day-Ahead section of the European trading platform trac-x a total capacity of 13,580 MWh/h was sold in April. Overall, 360 out of 1,740 (69,949 MWh/h) day-ahead procedures offered on the platform were successfully sold.
At the cross-border point Bunde/Oude Statenzijl (entry) the average price for traded day-ahead capacities amounted to € 9.88 per MWh/h per day. At the cross-border point Eynatten/Raeren (entry) it amounted to an average of…
WINGAS TRANSPORT Expands Cooperation with trac-x
Leipzig, 5 May 2009 – The German network operator WINGAS TRANSPORT GmbH & Co. KG has expanded its cooperation with the trac-x Transport Capacity Exchange GmbH. Since 1 May 2009, secondary long-term capacities in the grid of WINGAS TRANSPORT GmbH & Co. KG can be traded on trac-x. In trac-x’s day-ahead section, next-day usage rights in the WINGAS TRANSPORT grid have already been tradable at the cross-border point…

