Press release
How Innovation is Changing the Intraoperative MRI Equipment Market

Intraoperative MRI Equipment
High Demand for 0.2T Systems to Reflect the Growing Need for Low-field Intraoperative MRI Equipment
Detailed improvements in the images generated by 0.2T systems is driving their sales in the global market for intraoperative MRI equipment. Small read-out gradients are made visible and the 0.2T intraoperative MRI equipment systems are being preferred for eliminating the risks of severe geometrical distortion by employing homogenous magnetic field. The report estimates that in 2017, nearly 1,275 units of 0.2T systems were sold across the global intraoperative MRI equipment market. Towards the end of the forecast period, 0.2T systems are assessed to reflect a global market volume share of approximately 40%. On the other hand, 3.0T systems will showcase rapid volume growth at 9% CAGR over the forecast period. Increasing complexities in neurosurgeries will drive the demand for high-field intraoperative MRI equipment, and nearly 895 units of 3.0T systems will be adopted worldwide by the end of 2026.
Request Sample Report @ https://www.factmr.com/connectus/sample?flag=S&rep_id=519
Neurosurgical Intervention Applications to Showcase Highest Market Attractiveness through 2026
Majority of intraoperative MRI equipment manufactured in the world will be used for neurosurgical intervention procedures. More than 30% of the global intraoperative MRI equipment market volumes will be accounted by neurosurgical intervention applications through 2026. However, orthopedic procedure applications of intraoperative MRI equipment will showcase high volume growth, pertaining to prevalence of orthopedic disorders that require high-field MRI scanning during diagnosis. The report also estimates that hospitals will emerge as the largest end-users of intraoperative MRI equipment, accounting for approximately 40% share on global market volumes through 2026.
Competition Tracking
Increasing uptake for intraoperative MRI equipment across the global medical communities has influenced their production. Currently, the global intraoperative MRI equipment manufacturing landscape remains consolidated with the presence of handful players. However, these companies are widely recognized for being leaders of the medical devices industry. GE Healthcare, Medtronic Plc, Siemens AG, IMRIS, Inc., Koninklijke Philips N.V., and Hitachi Corporation will be observed as the key players in the global intraoperative MRI equipment market through 2026.
Browse Full Report @ https://www.factmr.com/report/519/intraoperative-mri-equipment-market
In the traditional medical landscape, image-guided procedures exhibited pre-operative conditions, and limitations associated with them required surgeons and physicians to deeply invest in the magnetic resonance imaging (MRI) technology. Advancements paved way for intraoperative MRI techniques, which gained grounds for their ability to use conventional imaging modality and overcome the limitations of preoperative diagnosis. Thereafter, the production of intraoperative MRI equipment has gained traction across the globe. Medical device manufacturers are focusing on improving the efficiency of intraoperative MRI equipment for localization during surgery. These equipment have enabled the physicians to view the images during a neurosurgical operation rather than referring to preoperative and postoperative images.
Speak To Research Analyst for Detailed Insights @ https://www.factmr.com/connectus/sample?flag=AE&rep_id=519
Table of Contents Covered in the report are:
1. Global Economic Outlook
2. Global Intraoperative MRI Equipment Market - Executive Summary
2.1. Global Intraoperative MRI Equipment Market - Opportunity Analysis
3. Global Intraoperative MRI Equipment Market Overview
3.1. Introduction
3.1.1. Global Intraoperative MRI Equipment Market Taxonomy
3.1.2. Global Intraoperative MRI Equipment Market Definition
3.2. Global Intraoperative MRI Equipment Market Size (US$ Mn) & Volume (units) and Forecast, 2012-2026
3.2.1. Global Intraoperative MRI Equipment Market Y-o-Y Growth
3.3. Global Intraoperative MRI Equipment Market Dynamics
3.4. Supply Chain
3.5. Cost Structure
3.6. Pricing Analysis
3.7. Forecast Scenario
3.8. Porter's Five Forces Analysis
3.9. Intraoperative Product Comparison
3.10. Demographic Comparison for iMRI, iCT and Intraoperative Ultrasound
3.11. Key Benefits and Preference of Intraoperative MRI Equipment Market
3.11.1. High Magnetic Field
3.11.2. Low Magnetic Field
3.12. Influencing Factors Impacting the Intraoperative Imaging Market
3.13. Key Regulations
3.13.1. Key Regulations - US
3.13.2. Key Regulations - Europe
3.13.3. Key Regulations - Japan
3.14. PEST Analysis
3.15. Market Positioning & Behavior Assessment
3.16. Investment Feasibility Index
3.17. Market Competition Structure
3.18. Key Participants Market Presence (Intensity Map) By Region
4. Global Intraoperative MRI Equipment Market Analysis and Forecast 2012-2026
4.1. Global Intraoperative MRI Equipment Market Size and Forecast By Product Type, 2012-2026
4.1.1. 0.2T System Market Size and Forecast, 2012-2026
4.1.1.1. Revenue (US$ Mn) & Volume (units) Comparison, By Region
4.1.1.2. Market Share Comparison, By Region
4.1.1.3. Y-o-Y growth Comparison, By Region
4.1.2. 1.5T System Market Size and Forecast, 2012-2026
4.1.2.1. Revenue (US$ Mn) & Volume (units) Comparison, By Region
4.1.2.2. Market Share Comparison, By Region
4.1.2.3. Y-o-Y growth Comparison, By Region
4.1.3. 3.0T System Market Size and Forecast, 2012-2026
4.1.3.1. Revenue (US$ Mn) & Volume (units) Comparison, By Region
4.1.3.2. Market Share Comparison, By Region
4.1.3.3. Y-o-Y growth Comparison, By Region
4.1.4. Others Market Size and Forecast, 2012-2026
4.1.4.1. Revenue (US$ Mn) & Volume (units) Comparison, By Region
4.1.4.2. Market Share Comparison, By Region
4.1.4.3. Y-o-Y growth Comparison, By Region
4.2. Global Intraoperative MRI Equipment Market Size and Forecast By End User, 2012-2026
4.2.1. Hospitals Market Size and Forecast, 2012-2026
4.2.1.1. Revenue (US$ Mn) & Volume (units) Comparison, By Region
4.2.1.2. Market Share Comparison, By Region
4.2.1.3. Y-o-Y growth Comparison, By Region
4.2.2. Cancer Research Institutes Market Size and Forecast, 2012-2026
4.2.2.1. Revenue (US$ Mn) & Volume (units) Comparison, By Region
4.2.2.2. Market Share Comparison, By Region
4.2.2.3. Y-o-Y growth Comparison, By Region
4.2.3. Academic Institutes Market Size and Forecast, 2012-2026
4.2.3.1. Revenue (US$ Mn) & Volume (units) Comparison, By Region
4.2.3.2. Market Share Comparison, By Region
4.2.3.3. Y-o-Y growth Comparison, By Region
4.2.4. Other End Users Market Size and Forecast, 2012-2026
4.2.4.1. Revenue (US$ Mn) & Volume (units) Comparison, By Region
4.2.4.2. Market Share Comparison, By Region
4.2.4.3. Y-o-Y growth Comparison, By Region
4.3. Global Intraoperative MRI Equipment Market Size and Forecast By Application, 2012-2026
4.3.1. Neurosurgical Intervention Market Size and Forecast, 2012-2026
4.3.1.1. Revenue (US$ Mn) & Volume (units) Comparison, By Region
4.3.1.2. Market Share Comparison, By Region
4.3.1.3. Y-o-Y growth Comparison, By Region
4.3.2. Orthopedic Procedures Market Size and Forecast, 2012-2026
4.3.2.1. Revenue (US$ Mn) & Volume (units) Comparison, By Region
4.3.2.2. Market Share Comparison, By Region
4.3.2.3. Y-o-Y growth Comparison, By Region
4.3.3. Cardiovascular Intervention Market Size and Forecast, 2012-2026
4.3.3.1. Revenue (US$ Mn) & Volume (units) Comparison, By Region
4.3.3.2. Market Share Comparison, By Region
4.3.3.3. Y-o-Y growth Comparison, By Region
4.3.4. Other Applications Market Size and Forecast, 2012-2026
4.3.4.1. Revenue (US$ Mn) & Volume (units) Comparison, By Region
4.3.4.2. Market Share Comparison, By Region
4.3.4.3. Y-o-Y growth Comparison, By Region
5. North America Intraoperative MRI Equipment Market Size and Forecast, 2012-2026
5.1. North America Outlook
5.2. North America Parent Market Outlook
5.3. North America Target Market Outlook
5.4. Revenue (US$ Mn) & Volume (units) Comparison, By Country
5.4.1. US Market Size and Forecast (US$ Mn) & Volume (units), 2012-2026
5.4.2. Canada Market Size and Forecast (US$ Mn) & Volume (units), 2012-2026
5.5. Revenue (US$ Mn) & Volume (units) Comparison, By Product Type
5.6. Revenue (US$ Mn) & Volume (units) Comparison, By End User
5.7. Revenue (US$ Mn) & Volume (units) Comparison, By Application
And Continue...
About FactMR
FactMR is a fast-growing market research firm that offers the most comprehensive suite of syndicated and customized market research reports. We believe transformative intelligence can educate and inspire businesses to make smarter decisions. We know the limitations of the one-size-fits-all approach; that's why we publish multi-industry global, regional, and country-specific research reports.
Contact Us
FactMR
11140 Rockville Pike
Suite 400
Rockville, MD 20852
United States
Email: sales@factmr.com
Web: www.factmr.com/
Follow Us on Linkedin: www.linkedin.com/company/factmr/
This release was published on openPR.
Permanent link to this press release:
Copy
Please set a link in the press area of your homepage to this press release on openPR. openPR disclaims liability for any content contained in this release.
You can edit or delete your press release How Innovation is Changing the Intraoperative MRI Equipment Market here
News-ID: 1606449 • Views: …
More Releases from Fact.MR
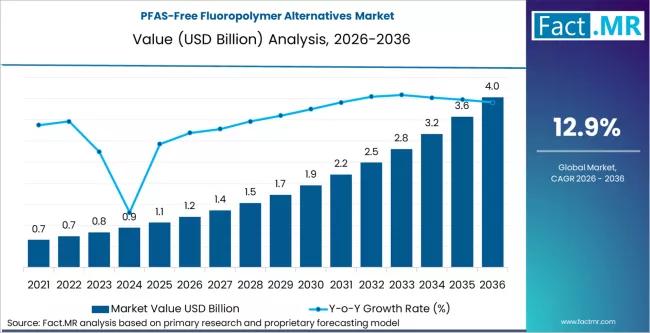
PFAS-Free Fluoropolymer Alternatives Market projects a CAGR of 12.9% by 2036
The global PFAS-free fluoropolymer alternatives market is projected to grow from USD 1.25 billion in 2026 to approximately USD 3.12 billion by 2036. This reflects a rapid compound annual growth rate (CAGR) of 9.6% over the ten-year forecast period.
The market is being aggressively driven by a global regulatory crackdown on "forever chemicals" (PFAS), forcing major industries to find non-fluorinated substitutes for coatings, membranes, and high-performance plastics.
Get Access of Report…
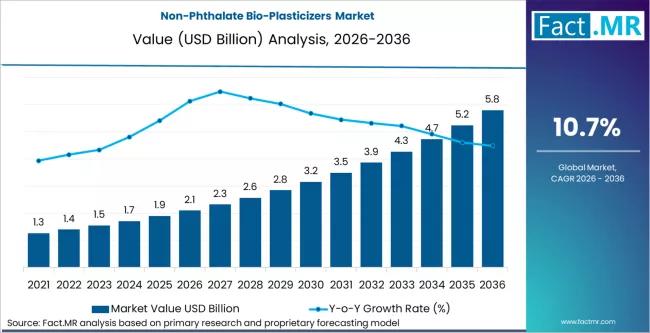
Non-Phthalate Bio-Plasticizers Market is Expected to Reach USD 5.8 billion by 20 …
The global HFO (Hydrofluoroolefin) Blowing Agent Market is forecast to grow substantially over the coming decade, driven by stringent environmental regulations, rising demand for energy-efficient insulation materials, and accelerated adoption of low-global-warming-potential (GWP) technologies across construction, refrigeration, and automotive sectors.
Industry analysts estimate that the market, valued at approximately USD 1.9 billion in 2025, is expected to exceed USD 3.6 billion by 2035, registering a compound annual growth rate (CAGR)…
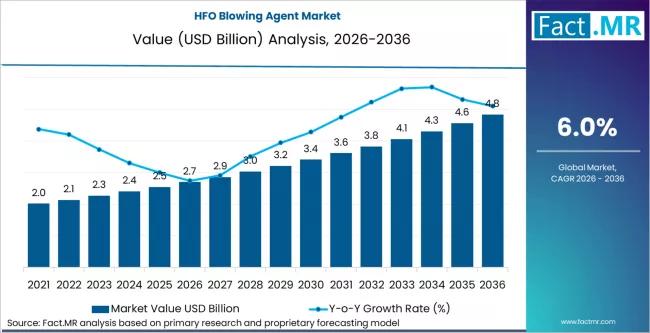
HFO Blowing Agent Market is Estimated to Grow to USD 2.7 billion in 2026
The global HFO (Hydrofluoroolefin) Blowing Agent Market is forecast to grow substantially over the coming decade, driven by stringent environmental regulations, rising demand for energy-efficient insulation materials, and accelerated adoption of low-global-warming-potential (GWP) technologies across construction, refrigeration, and automotive sectors. Industry analysts estimate that the market, valued at approximately USD 1.9 billion in 2025, is expected to exceed USD 3.6 billion by 2035, registering a compound annual growth rate (CAGR)…
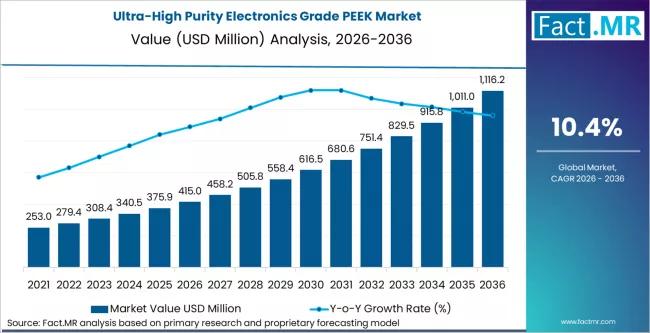
Ultra-High Purity Electronics Grade PEEK Market FOrecasted CAGR is 10.4% 2036
The global ultra-high purity (UHP) electronics-grade Polyether Ether Kitone (PEEK) market is projected to grow from USD 215.4 million in 2026 to approximately USD 458.6 million by 2036. This represents a strong compound annual growth rate (CAGR) of 7.8% over the ten-year forecast period.
The market is being driven by the relentless miniaturization of semiconductors and the shift toward 2nm and 3nm process nodes, where even microscopic material impurities can…
More Releases for Comparison
Waveguide port - flange size comparison table
The relationship between waveguide port dimensions, flange [https://www.leader-mw.com/rf-integrated-load-dc-18ghz-with-tab-mount-20w-power-product/] sizes, and frequency bands is standardized to ensure mechanical compatibility and optimal RF performance. Below is a simplified comparison table and key principles for common rectangular waveguides and their associated flanges.
Key Concepts
1. Waveguide Designation: Waveguides are labeled with "WR" (Waveguide Rectangular) followed by a number (e.g., WR-90). The number approximates the inner broad-wall dimension in hundredths of an inch (e.g., WR-90 almost…
Polyester vs Chenille: A Detailed Comparison
Choosing between polyester and chenille can make or break your next furniture purchase, clothing investment, or home decor project. These two fabrics [https://www.yituofabrics.com/cotton-embroidery-fabric/] couldn't be more different-one prioritizes durability and easy care, while the other delivers unmatched softness and luxury.
Polyester dominates the textile industry as a synthetic workhorse that resists wrinkles, dries quickly, and costs less than most alternatives. Chenille offers the plush, velvety texture that makes blankets irresistible and…
Velvet vs Chenille: A Comprehensive Comparison
Choosing between velvet and chenille for your furniture can make or break your living space's comfort and style. These two popular upholstery fabrics might both feel soft, but they're completely different in terms of durability, maintenance, and overall vibe.
Chenille gives you that cozy, lived-in comfort that's perfect for Netflix marathons and family gatherings. Velvet delivers luxury and elegance but demands more careful treatment to keep looking its best.
Chenille
Chenille is a…
Fabric Cutting Methods: A Technical Comparison
Introduction to Cutting Technologies
Modern textile production utilizes various cutting methods, each with distinct advantages depending on application requirements. This analysis compares four primary techniques to help professionals select optimal solutions for their operations.
Laser cutting fabric has become a popular technique for creating precise, intricate designs. The process works best with materials that are stable, heat-resistant, and easy to cut. Common fabrics for laser cutting include cotton, polyester, felt, and synthetic…
STM32F vs STM32G: A Comprehensive Comparison
When it comes to embedded systems development, selecting the right microcontroller (MCU) can significantly impact the performance, power consumption, and cost-effectiveness of your project. STM32F vs STM32G ( https://www.chipmall.com/blogs/stm32f-vs-stm32g_92 ) is a common comparison in the embedded community, as both series from STMicroelectronics offer powerful solutions, but they serve different needs and use cases. The STM32F and STM32G families, both based on ARM Cortex-M cores, provide developers with a wide…
Moneybrag.com Offers Reliable Financial Comparison Services
Moneybrag.com is a leading online firm that specializes in online comparison services that enable clients to make comparisons of utility and personal finance products. Their primary goal is to provide information in an understandable format that allows for initial comparisons to be made at a glance. This enables customers to make healthy financial decisions. Moneybrag.com gives customers the ability to compare side by side and select a vendor based on…
