Press release
Virtual Power Plant Market Poised for Exponential Growth with 24.2% CAGR During 2025-2031
Virtual Power Plant Market
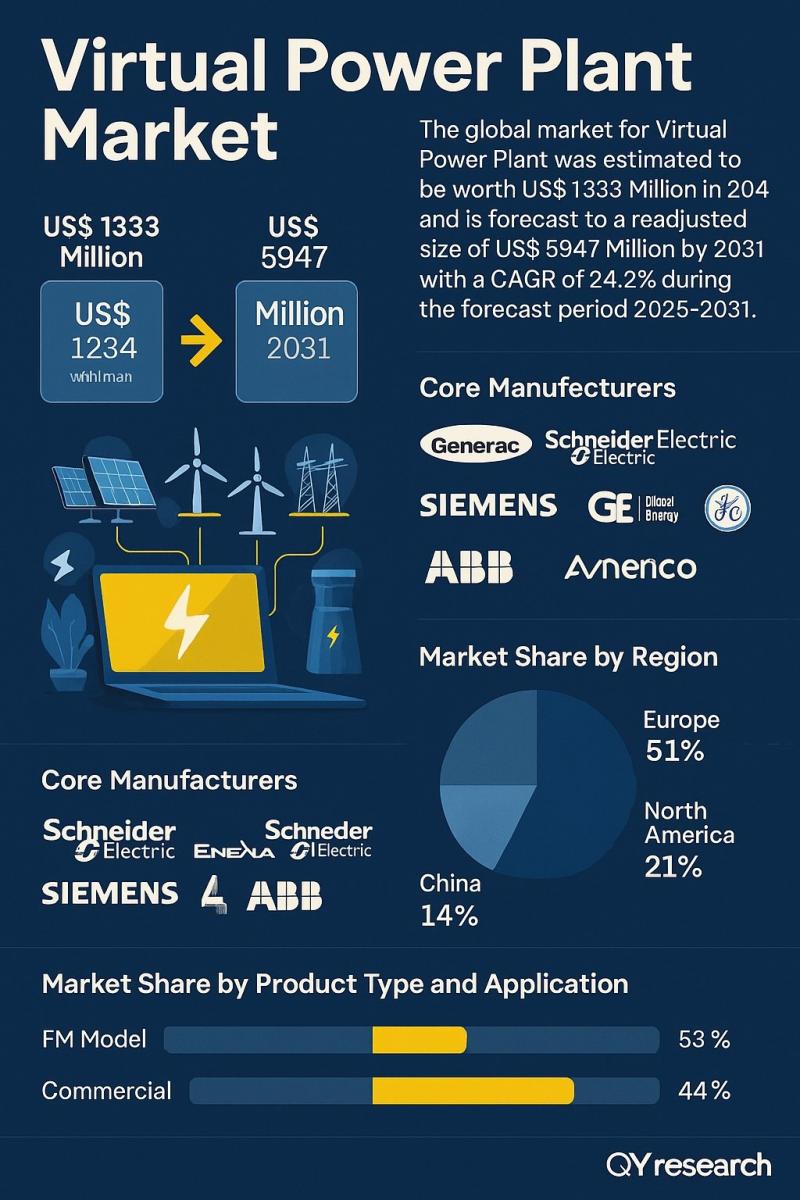
The global market for Virtual Power Plant was estimated to be worth US$ 1333 million in 2024 and is forecast to a readjusted size of US$ 5947 million by 2031 with a CAGR of 24.2% during the forecast period 2025-2031.
Download Free Sample PDF Report (with full TOC, tables, and charts) To Explore Detailed Insights and Forecasts @ https://qyresearch.in/request-sample/energy-power-virtual-power-plant-global-market-share-and-ranking-overall-sales-and-demand-forecast-2025-2031
A virtual power plant (VPP) is a cloud-based distributed power plant that aggregates the capacities of heterogeneous distributed energy resources (DER) for the purposes of enhancing power generation, as well as trading or selling power on the electricity market. A Virtual Power Plant (VPP) is an aggregated portfolio of Distributed Energy Resources and Controllable Loads into energy blocks which can be used to participate in Energy Markets and offer Services to the System Operator.
Global core virtual power plant manufacturers include Generac (Enbala), Schneider Electric (AutoGrid), Siemens, GE Digital Energy, ABB, etc. The top 5 companies hold a share about 55%. Europe is the largest market, with a share over 51%, followed by North America and China, with share about 21% and 14%. In terms of product type, FM Model is the largest segment with a share of 53%. And in terms of application, the largest application is commercial, occupied for 44 percent.
Competitive Landscape: -
Ørsted
Duke Energy
RWE
Enbala
Bosch
GE Digital Energy
EnerNOC
Schneider Electric(AutoGrid)
Siemens
Viridity Energy
The competitive landscape is a must-have information for the market players to withstand the competition present in the global Virtual Power Plant market. This further helps the market participants to develop effective strategies to optimize their market positions. Moreover, the competitive analysis helps them to determine potential advantages as well as barriers within the global Virtual Power Plant market. This way, they can monitor how their competitors are implementing various strategies including pricing, marketing, and distribution.
Market Drivers and Restraints -
This section of the Virtual Power Plant report discusses various drivers and restrains that have shaped the global market. The detailed study of numerous drivers of the market enable readers to get a clear perspective of the market, which includes market environment, government policies, product innovations, breakthroughs, and market risks.
The research report also points out the myriad opportunities, challenges, and market barriers present in the global Virtual Power Plant market. The comprehensive nature of the information will help the reader determine and plan strategies to benefit from. Restrains, challenges, and market barriers also help the reader to understand how the company can prevent itself from facing downfall.
Regional Insights -
The report takes readers on a journey through four key regions: United States, Asia-Pacific, and EMEA. Key nations like the United States, Germany, the United Kingdom, China, Japan, South Korea, and more are thoroughly examined. The data is presented in a timeline from 2024 as the base year, with projections extending to 2031.
North America: United States, Canada, Mexico
Latin America: Brazil and other key markets
Asia Pacific: China, Japan, South Korea, India, ASEAN countries
Europe, Middle East & Africa (EMEA): Major European economies, GCC countries, and African nations
The report provides a region-wise breakdown of market share, consumption trends, and future prospects.
Detailed of Virtual Power Plant Market Segmentation -
The report offers great insights into important segments of the global Virtual Power Plant market while concentrating on their CAGR, market size, market share, and future growth potential. The global Virtual Power Plant market is mainly segmented according to type of product, application, and region. Each segment in these categories is extensively researched to become familiar with their growth prospects and key trends. Segmental analysis is highly important to identify key growth pockets of a global market. The report provides specific information on the market growth and demand of different products and applications to help players to focus on profitable areas of the global Virtual Power Plant market.
Segmentation By Type :-
OC Model
FM Model
Segmentation By Application -
Commercial
Industrial
Residential
This segmentation helps identify high-growth opportunities and niche segments for investors and businesses.
Request for Pre-Order Enquiry On This Exclusive Report @ https://qyresearch.in/pre-order-inquiry/energy-power-virtual-power-plant-global-market-share-and-ranking-overall-sales-and-demand-forecast-2025-2031
Why This Report is a Must-Have -
ᗒ Historical Analysis (2020-2024) & Forecasts (2025-2031): Gain a clear understanding of market trends and future growth potential.
ᗒ Comprehensive Market Segmentation: Detailed breakdown by Type, Application, and Region to identify lucrative opportunities.
ᗒ Competitive Landscape: Insights into key players, their market share, and strategic developments like mergers, acquisitions, and expansion plans.
ᗒ Drivers & Restraints: Understand the factors shaping the market's growth and the challenges that could impact your strategy.
ᗒ Expert Opinions & Market Dynamics: Benefit from expert analysis to navigate market risks and capitalize on emerging trends.
Virtual Power Plant Market Report Objectives -
(1) Analyzing the size of the global Virtual Power Plant market on the basis of value and volume
(2) Accurately calculating the market shares, consumption, and other vital factors of different segments of the global Virtual Power Plant market
(3) Exploring key dynamics of the global Virtual Power Plant market
(4) Highlighting important trends of the global Virtual Power Plant market in terms of production, revenue, and sales
(5) Deeply profiling top players of the global Virtual Power Plant market and showing how they compete in the industry
(6) Studying manufacturing processes and costs, product pricing, and various trends related to them
(7) Showing the performance of different regions and countries in the global Virtual Power Plant market
(8) Forecasting the market size and share of all segments, regions, and the global market.
Important Questions Answered included in the Report:-
(A) What is the market size and growth rate of the global and regional market by various segments?
(B) What is the market size and growth rate of the market for selective Countries?
(C) Which region or sub-segment is expected to drive the market in the forecast period?
(D) What factors are estimated to drive and restrain the market growth?
(E) What are the key technology and market trends shaping the market?
(F) what are the key opportunity in the market?
(G) Who are the leading manufacturers operating in the global Virtual Power Plant market?
(H) Which key player accounted for the highest market share?
(I) What are the growth opportunities for the new entrants in the global Virtual Power Plant market?
Table of Contents - Major Key Points:
1 Market Overview
1.1 Virtual Power Plant Product Introduction
1.2 Global Virtual Power Plant Market Size Forecast (2020-2031)
1.3 Virtual Power Plant Market Trends & Drivers
1.3.1 Virtual Power Plant Industry Trends
1.3.2 Virtual Power Plant Market Drivers & Opportunity
1.3.3 Virtual Power Plant Market Challenges
1.3.4 Virtual Power Plant Market Restraints
1.4 Assumptions and Limitations
1.5 Study Objectives
1.6 Years Considered
2 Competitive Analysis by Company
2.1 Global Virtual Power Plant Players Revenue Ranking (2024)
2.2 Global Virtual Power Plant Revenue by Company (2020-2025)
2.3 Key Companies Virtual Power Plant Manufacturing Base Distribution and Headquarters
2.4 Key Companies Virtual Power Plant Product Offered
2.5 Key Companies Time to Begin Mass Production of Virtual Power Plant
2.6 Virtual Power Plant Market Competitive Analysis
2.6.1 Virtual Power Plant Market Concentration Rate (2020-2025)
2.6.2 Global 5 and 10 Largest Companies by Virtual Power Plant Revenue in 2024
2.6.3 Global Top Companies by Company Type (Tier 1, Tier 2, and Tier 3) & (based on the Revenue in Virtual Power Plant as of 2024)
2.7 Mergers & Acquisitions, Expansion
3 Segmentation by Type
3.1 Introduction by Type
3.1.1 OC Model
3.1.2 FM Model
3.2 Global Virtual Power Plant Sales Value by Type
3.2.1 Global Virtual Power Plant Sales Value by Type (2020 VS 2024 VS 2031)
3.2.2 Global Virtual Power Plant Sales Value, by Type (2020-2031)
3.2.3 Global Virtual Power Plant Sales Value, by Type (%) (2020-2031)
4 Segmentation by Application
4.1 Introduction by Application
4.1.1 Commercial
4.1.2 Industrial
4.1.3 Residential
4.2 Global Virtual Power Plant Sales Value by Application
4.2.1 Global Virtual Power Plant Sales Value by Application (2020 VS 2024 VS 2031)
4.2.2 Global Virtual Power Plant Sales Value, by Application (2020-2031)
4.2.3 Global Virtual Power Plant Sales Value, by Application (%) (2020-2031)
5 Segmentation by Region
5.1 Global Virtual Power Plant Sales Value by Region
5.1.1 Global Virtual Power Plant Sales Value by Region: 2020 VS 2024 VS 2031
5.1.2 Global Virtual Power Plant Sales Value by Region (2020-2025)
5.1.3 Global Virtual Power Plant Sales Value by Region (2026-2031)
5.1.4 Global Virtual Power Plant Sales Value by Region (%), (2020-2031)
5.2 North America
5.2.1 North America Virtual Power Plant Sales Value, 2020-2031
5.2.2 North America Virtual Power Plant Sales Value by Country (%), 2024 VS 2031
5.3 Europe
5.3.1 Europe Virtual Power Plant Sales Value, 2020-2031
5.3.2 Europe Virtual Power Plant Sales Value by Country (%), 2024 VS 2031
5.4 Asia Pacific
5.4.1 Asia Pacific Virtual Power Plant Sales Value, 2020-2031
5.4.2 Asia Pacific Virtual Power Plant Sales Value by Region (%), 2024 VS 2031
5.5 South America
5.5.1 South America Virtual Power Plant Sales Value, 2020-2031
5.5.2 South America Virtual Power Plant Sales Value by Country (%), 2024 VS 2031
5.6 Middle East & Africa
5.6.1 Middle East & Africa Virtual Power Plant Sales Value, 2020-2031
5.6.2 Middle East & Africa Virtual Power Plant Sales Value by Country (%), 2024 VS 2031
6 Segmentation by Key Countries/Regions
6.1 Key Countries/Regions Virtual Power Plant Sales Value Growth Trends, 2020 VS 2024 VS 2031
6.2 Key Countries/Regions Virtual Power Plant Sales Value, 2020-2031
6.3 United States
6.3.1 United States Virtual Power Plant Sales Value, 2020-2031
6.3.2 United States Virtual Power Plant Sales Value by Type (%), 2024 VS 2031
6.3.3 United States Virtual Power Plant Sales Value by Application, 2024 VS 2031
6.4 Europe
6.4.1 Europe Virtual Power Plant Sales Value, 2020-2031
6.4.2 Europe Virtual Power Plant Sales Value by Type (%), 2024 VS 2031
6.4.3 Europe Virtual Power Plant Sales Value by Application, 2024 VS 2031
6.5 China
6.5.1 China Virtual Power Plant Sales Value, 2020-2031
6.5.2 China Virtual Power Plant Sales Value by Type (%), 2024 VS 2031
6.5.3 China Virtual Power Plant Sales Value by Application, 2024 VS 2031
6.6 Japan
6.6.1 Japan Virtual Power Plant Sales Value, 2020-2031
6.6.2 Japan Virtual Power Plant Sales Value by Type (%), 2024 VS 2031
6.6.3 Japan Virtual Power Plant Sales Value by Application, 2024 VS 2031
6.7 South Korea
6.7.1 South Korea Virtual Power Plant Sales Value, 2020-2031
6.7.2 South Korea Virtual Power Plant Sales Value by Type (%), 2024 VS 2031
6.7.3 South Korea Virtual Power Plant Sales Value by Application, 2024 VS 2031
6.8 Southeast Asia
6.8.1 Southeast Asia Virtual Power Plant Sales Value, 2020-2031
6.8.2 Southeast Asia Virtual Power Plant Sales Value by Type (%), 2024 VS 2031
6.8.3 Southeast Asia Virtual Power Plant Sales Value by Application, 2024 VS 2031
6.9 India
6.9.1 India Virtual Power Plant Sales Value, 2020-2031
6.9.2 India Virtual Power Plant Sales Value by Type (%), 2024 VS 2031
6.9.3 India Virtual Power Plant Sales Value by Application, 2024 VS 2031
7 Company Profiles
7.1 Ørsted
7.1.1 Ørsted Profile
7.1.2 Ørsted Main Business
7.1.3 Ørsted Virtual Power Plant Products, Services and Solutions
7.1.4 Ørsted Virtual Power Plant Revenue (US$ Million) & (2020-2025)
7.1.5 Ørsted Recent Developments
7.2 Duke Energy
7.2.1 Duke Energy Profile
7.2.2 Duke Energy Main Business
7.2.3 Duke Energy Virtual Power Plant Products, Services and Solutions
7.2.4 Duke Energy Virtual Power Plant Revenue (US$ Million) & (2020-2025)
7.2.5 Duke Energy Recent Developments
7.3 RWE
7.3.1 RWE Profile
7.3.2 RWE Main Business
7.3.3 RWE Virtual Power Plant Products, Services and Solutions
7.3.4 RWE Virtual Power Plant Revenue (US$ Million) & (2020-2025)
7.3.5 RWE Recent Developments
7.4 Enbala
7.4.1 Enbala Profile
7.4.2 Enbala Main Business
7.4.3 Enbala Virtual Power Plant Products, Services and Solutions
7.4.4 Enbala Virtual Power Plant Revenue (US$ Million) & (2020-2025)
7.4.5 Enbala Recent Developments
7.5 Bosch
7.5.1 Bosch Profile
7.5.2 Bosch Main Business
7.5.3 Bosch Virtual Power Plant Products, Services and Solutions
7.5.4 Bosch Virtual Power Plant Revenue (US$ Million) & (2020-2025)
7.5.5 Bosch Recent Developments
7.6 GE Digital Energy
7.6.1 GE Digital Energy Profile
7.6.2 GE Digital Energy Main Business
7.6.3 GE Digital Energy Virtual Power Plant Products, Services and Solutions
7.6.4 GE Digital Energy Virtual Power Plant Revenue (US$ Million) & (2020-2025)
7.6.5 GE Digital Energy Recent Developments
7.7 EnerNOC
7.7.1 EnerNOC Profile
7.7.2 EnerNOC Main Business
7.7.3 EnerNOC Virtual Power Plant Products, Services and Solutions
7.7.4 EnerNOC Virtual Power Plant Revenue (US$ Million) & (2020-2025)
7.7.5 EnerNOC Recent Developments
7.8 Schneider Electric(AutoGrid)
7.8.1 Schneider Electric(AutoGrid) Profile
7.8.2 Schneider Electric(AutoGrid) Main Business
7.8.3 Schneider Electric(AutoGrid) Virtual Power Plant Products, Services and Solutions
7.8.4 Schneider Electric(AutoGrid) Virtual Power Plant Revenue (US$ Million) & (2020-2025)
7.8.5 Schneider Electric(AutoGrid) Recent Developments
7.9 Siemens
7.9.1 Siemens Profile
7.9.2 Siemens Main Business
7.9.3 Siemens Virtual Power Plant Products, Services and Solutions
7.9.4 Siemens Virtual Power Plant Revenue (US$ Million) & (2020-2025)
7.9.5 Siemens Recent Developments
7.10 Viridity Energy
7.10.1 Viridity Energy Profile
7.10.2 Viridity Energy Main Business
7.10.3 Viridity Energy Virtual Power Plant Products, Services and Solutions
7.10.4 Viridity Energy Virtual Power Plant Revenue (US$ Million) & (2020-2025)
7.10.5 Viridity Energy Recent Developments
8 Industry Chain Analysis
8.1 Virtual Power Plant Industrial Chain
8.2 Virtual Power Plant Upstream Analysis
8.2.1 Key Raw Materials
8.2.2 Raw Materials Key Suppliers
8.2.3 Manufacturing Cost Structure
8.3 Midstream Analysis
8.4 Downstream Analysis (Customers Analysis)
8.5 Sales Model and Sales Channels
8.5.1 Virtual Power Plant Sales Model
8.5.2 Sales Channel
8.5.3 Virtual Power Plant Distributors
9 Research Findings and Conclusion
10 Appendix
10.1 Research Methodology
10.1.1 Methodology/Research Approach
10.1.1.1 Research Programs/Design
10.1.1.2 Market Size Estimation
10.1.1.3 Market Breakdown and Data Triangulation
10.1.2 Data Source
10.1.2.1 Secondary Sources
10.1.2.2 Primary Sources
10.2 Author Details
10.3 Disclaimer
About Us:
QYResearch established as a research firm in 2007 and have since grown into a trusted brand amongst many industries. Over the years, we have consistently worked toward delivering high-quality customized solutions for wide range of clients ranging from ICT to healthcare industries. With over 50,000 satisfied clients, spread over 80 countries, we have sincerely strived to deliver the best analytics through exhaustive research methodologies.
Contact Us:
Arshad Shaha | Marketing Executive
QY Research, INC.
315 Work Avenue, Raheja Woods,
Survey No. 222/1, Plot No. 25, 6th Floor,
Kayani Nagar, Yervada, Pune 411006, Maharashtra
Tel: +91-8669986909
Emails - arshad@qyrindia.com
Web - https://www.qyresearch.in
This release was published on openPR.
Permanent link to this press release:
Copy
Please set a link in the press area of your homepage to this press release on openPR. openPR disclaims liability for any content contained in this release.
You can edit or delete your press release Virtual Power Plant Market Poised for Exponential Growth with 24.2% CAGR During 2025-2031 here
News-ID: 4262331 • Views: …
More Releases from QYResearch.Inc

Buy Now Pay Later Market Size, CAGR of 34.9%, Growth Trends & Forecast 2026-2032 …
Market Overview and Research Scope -
QY Research Inc., A global market research and consulting firm, has announced the release of its latest 2026 report titled "Buy Now Pay Later - Global Market Share and Ranking, Overall Sales and Demand Forecast 2026-2032." The report provides a data-driven analysis of the global Buy Now Pay Later market, integrating historical insights from 2020-2025 with forward-looking forecasts through 2032. It covers market size, competitive…

C-MET & HGF Inhibitors Market : Future Outlook, Innovations, and Growth Potentia …
Market Overview and Research Scope -
QY Research Inc., A global market research and consulting firm, has announced the release of its latest 2026 report titled "C-MET & HGF Inhibitors - Global Market Share and Ranking, Overall Sales and Demand Forecast 2026-2032." The report provides a data-driven analysis of the global C-MET & HGF Inhibitors market, integrating historical insights from 2020-2025 with forward-looking forecasts through 2032. It covers market size, competitive…

Giant Magneto Resistive (GMR) Sensors Market 2026-2032 : Trends, Growth Opportun …
Market Overview and Research Scope -
QY Research Inc., A global market research and consulting firm, has announced the release of its latest 2026 report titled "Giant Magneto Resistive (GMR) Sensors - Global Market Share and Ranking, Overall Sales and Demand Forecast 2026-2032." The report provides a data-driven analysis of the global Giant Magneto Resistive (GMR) Sensors market, integrating historical insights from 2020-2025 with forward-looking forecasts through 2032. It covers market…
Portable Document Scanner Market Insights : Emerging Trends, Business Prospects, …
Market Overview and Research Scope -
QY Research Inc., A global market research and consulting firm, has announced the release of its latest 2026 report titled "Portable Document Scanner - Global Market Share and Ranking, Overall Sales and Demand Forecast 2026-2032." The report provides a data-driven analysis of the global Portable Document Scanner market, integrating historical insights from 2020-2025 with forward-looking forecasts through 2032. It covers market size, competitive landscape, demand…
More Releases for Virtual
Virtual Office Staff and Fortitude Virtual Professionals Unite to Elevate Virtua …
On May 5, 2025, two esteemed virtual assistant agencies-Virtual Office Staff and Fortitude Virtual Professionals-officially merged, forming a dynamic alliance poised to redefine the standards of virtual executive support and business operations.
This strategic merger combines the strengths of both organizations, uniting their commitment to delivering top-tier virtual office services that exceed client expectations. Operating under the Fortitude Virtual Professionals brand, the unified entity leverages a robust infrastructure and a reputation…
Virtual Assistance Revolution: Intelligent Virtual Assistants Market (2023-2032)
Global Intelligent Virtual Assistants Market Scope and Overview Report 2023-2032
"According to the research report, the global intelligent virtual assistant market was valued at USD 2.62 billion in 2022 and is expected to reach USD 22.45 billion by 2032, to grow at a CAGR of 24.0% during the forecast period."
This visionary report entitled Intelligent Virtual Assistants Market: By Size, Latest Trends, Share, Huge Growth, Segments, Analysis and Forecast, 2030 published by…
Virtual Workplace Market Seeking Excellent Growth | Opus Virtual Offices, Blackm …
Advance Market Analytics published a new research publication on "Virtual Workplace Market Insights, to 2027" with 232 pages and enriched with self-explained Tables and charts in presentable format. In the Study you will find new evolving Trends, Drivers, Restraints, Opportunities generated by targeting market associated stakeholders. The growth of the Virtual Workplace market was mainly driven by the increasing R&D spending across the world.
Get Free Exclusive PDF Sample Copy of…
Virtual Internet launches “On-Demand” Virtual Data Centers
LONDON, England Feb. 21, 2011 | Virtual Internet – Virtual Internet has announced a new cloud package called Virtual Data Centers which allow IT managers to virtualize their infrastructure “on-demand” via the Internet.
The new self-service package allows managers to slice and dice a minimum of 10GB (or more) of physical disk space and/or physical memory into multiple configurations at will.
Incorporating the best features of a private cloud and Infrastructure-as-a-Service (IaaS),…
Caribbean Association Of Virtual Assistants Open Virtual Assistant Directory To …
CAVA Seeks Outside Assistance In Order To Meet Increased Demands For Virtual Assistants
The Caribbean Association Of Virtual Assistants, the Caribbean’s leading association for virtual assistants is set to accept listings from virtual assistants the world over.
The industry is still fairly new in the Caribbean and due to ever-increasing demands for the services provided by members of the association, the directors have made the decision to seek outside assistance.
Virtual assistants…
Virtual Assistants Become a Little Less Virtual
Toronto, Canada … North American Virtual Assistants and particularly Canadian VA’s have never before had the opportunity to meet and exchange views in this kind of forum and on Canadian soil. Barb Lang, a Toronto based Virtual Assistant specializing in Event Planning, saw a need for new and seasoned VA’s to meet in person in order to exchange ideas and business expertise in a mastermind / workshop type event.…
