Press release
Low Sugar Protein Bars Market to Reach USD 3,210 Million by 2031 Top 15 Company Globally
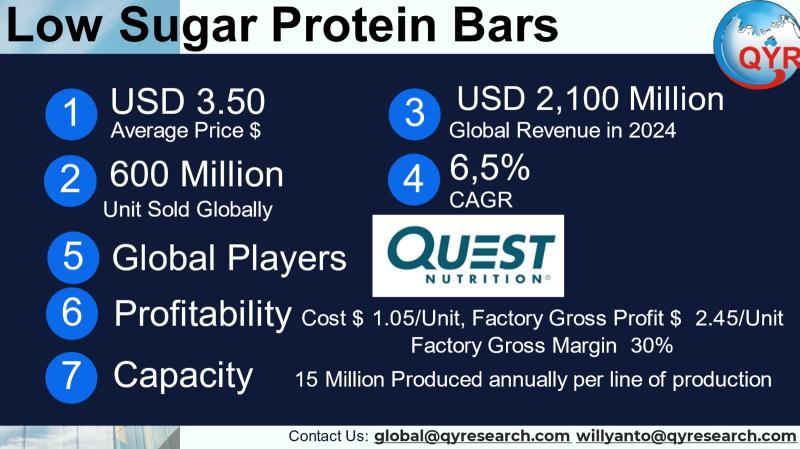
The low-sugar protein bar market is sized at USD 2,100 million in 2024 and is projected to grow at 6.5% CAGR through 2031. With an average retail/market price of USD 3.50 per unit, the global market translated to approximately 600 million units sold in 2024. For a factory gross margin of 30%, which yields a factory gross profit of USD 1.05 per bar and a cost of goods sold per unit of USD 2.45. The breakdown of COGS by category is presented here as an industry-typical allocation used by co-packers and manufacturers: Ingredients 48% (USD 1.176/unit), Packaging 12% (USD 0.294/unit), Labor 12% (USD 0.294/unit), Factory overhead & utilities 8% (USD 0.196/unit), Logistics/distribution to first buyer 8% (USD 0.196/unit), Quality & testing 3% (USD 0.0735/unit), Waste allowance 4% (USD 0.098/unit), Co-packer/contract manufacturing fee 5% (USD 0.1225/unit). The resulting factory gross profit per unit is USD 1.05, which corresponds to a factory gross margin of 30% on price USD 3.50. For a single medium/large automated line can produce on the order of 15 million bars per year depending on speed, uptime and pack size.
Supermarkets and hypermarkets represent the single largest retail channel globally (roughly 44%). E-commerce and direct-to-consumer channels are the fastest growing and account for an increasing share (around 30%), convenience stores and impulse channels contribute around 10%, specialty/health-food retailers around 8%, and foodservice & institutional channels make up the remainder. Channel mix is market-specific and skews more heavily to online and specialty retail in East Asia and urban Southeast Asia
Latest Trends and Technological Developments
The low-sugar protein bar category is being shaped by a set of simultaneous trends: sugar-reduction claims and clearer labeling (heightened by litigation risk over healthy claims), plant-based protein alternatives and clean-label formulations, multi-layer indulgent textures engineered with low-sugar sweeteners, and the rapid expansion of e-commerce subscription models for repeat purchase. In terms of hard news: in August 2024 a U.S. federal judge allowed a proposed class action alleging that PepsiCos Gatorade protein bars were marketed misleadingly despite high sugar content to proceed a high-visibility legal development that underlines regulatory and reputation risk for healthy halo claims (Reuters, August 2024). In March 2025 BioTechUSA announced commissioning of a state-of-the-art multi-layer protein bar line that boosts its annual capacity to 75 million bars and specifically calls out the ability to produce no-added-sugar indulgent bars, illustrating both demand and technology investment trends (BioTechUSA press release, March 2025). Trade and industry journalism in 2025 emphasizes reformulation (sugar reduction and fiber substitution), improved enrobing/enrichment lines and co-packing automation to handle sticky low-sugar matrices. These developments increase speed-to-market for novel low-sugar formats, but also raise capital and process-control requirements for manufacturers.
Asia represents one of the most dynamic growth territories for low-sugar and functional bars due to rising urbanization, gym/fitness proliferation, and accelerating online grocery adoption. Asia-Pacific protein bar reporting shows large and growing regional revenue pools, with many suppliers targeting an uplift in premium low-sugar SKUs tailored for local taste profiles. Market research firms that evaluate APAC show meaningful growth rates and rising plant-based subsegments; country-level adoption differs, with Japan and South Korea exhibiting more premium, low-sugar willingness-to-pay while Southeast Asian demand is driven by convenience, affordability and rising health awareness. Manufacturers looking to expand in Asia should prioritize localized flavor development, price architecture tuned to local purchasing power, and partnerships with large regional retailers and e-commerce platforms to capture both urban and suburban consumer segments.
Get Full PDF Sample Copy of Report: (Including Full TOC, List of Tables & Figures, Chart)
https://www.qyresearch.com/sample/5052253
Low Sugar Protein Bars by Type:
Plant Protein Based
Whey Protein Based
Low Sugar Protein Bars by Application:
Online Stores
Offline Stores
Global Top 15 Key Companies in the Low Sugar Protein Bars Market
Quest Nutrition
Nestlé
The Protein Works
PepsiCo
Kelloggs
Barebells
MyProtein
Unilever
Abbott Nutrition
PhD Nutrition
The Hershey Company
ThinkThin (GlaxoSmithKline (GSK))
NuGo Nutrition
ffit8
WonderLab
Regional Insights
Southeast Asia is a growth hotspot for snack bars generally and protein bars specifically. Recent SEA market reports place the SEA snack-bar market on steady growth trajectories with mid-single-digit CAGRs; Indonesia is among the fastest expanding national markets due to population scale, rising disposable income and rapid modern retail expansion. Indonesias snack-bar market was reported at roughly USD 363 million in 2024 with double-digit growth potential in energy and protein bars as consumers adopt Western snacking formats; the region also shows rising demand for affordable high-protein and low-sugar options. Local manufacturing and co-packing growth is occurring in Indonesia, Thailand and Vietnam to meet trade-cost sensitivities and to reduce landed costs for regional brands and private label. For companies entering ASEAN, the priorities are price competitiveness, simplified ingredient lists for regulatory ease, and channel partnerships with supermarkets and fast-growing local e-commerce platforms.
The category faces several material challenges. First, regulatory and litigation risk surrounding healthy or protein-forward claims has increased (recent class-action litigation examples show the reputational and legal exposure). Second, formulatory complexity for low-sugar indulgent textures increases manufacturing rejects and CAPEX on advanced enrobing/robotic lines. Third, ingredient price volatility (nuts, dairy proteins, plant proteins) and logistics cost pressure squeeze margins unless scale or premium pricing is achieved. Finally, consumer taste expectations remain tough: low sugar must still deliver indulgent mouthfeel, which raises R&D and sampling costs and can slow adoption among mainstream buyers.
Manufacturers and investors should prioritize three strategic plays: invest in formulation R&D that balances sugar reduction with mouthfeel using fiber blends and targeted sweeteners; secure flexible co-packing partnerships (or install modular multi-lane lines) to address SKU proliferation and speed to market; and target the channel mix invest in e-commerce and subscription capabilities for repeat buyers while maintaining supermarket presence for scale and impulse buys. For ASEAN market entry, design tiered pricing and pack sizes (single-serve vs multi-pack) to match income segments and partner with local distributors to shorten lead times and lower landed costs. Lastly, given legal risk on labeling, build transparent ingredient callouts and third-party certifications into branding to reduce litigation and build trust.
Product Models
Low-sugar protein bars are popular functional snacks designed to deliver high protein with reduced sugar, supporting fitness, weight management, and healthier snacking.
Plant Protein-Based using pea, soy, or nut proteins for vegan/vegetarian diets. Notable products include:
RXBAR Plant Kelloggs RXBAR: Vegan protein bar made with pea and almond protein, no added sugar.
Orgain Organic Protein Bar Orgain Inc.: Plant-based bar with low sugar, made with brown rice and pea protein.
No Cow Protein Bar No Cow LLC: Dairy-free protein bar, sweetened with stevia and monk fruit.
LÄRABAR Protein General Mills: Plant protein blend with naturally low sugar from dates and nuts.
Garden of Life Organic Fit Bar Nestlé Health Science: Low-sugar, vegan protein bar designed for weight management.
Whey Protein-Based dairy-derived, fast-digesting protein ideal for muscle recovery and athletic performance. Examples include:
Quest Protein Bar Quest Nutrition: Popular low-sugar whey protein bar with high fiber content.
Grenade Carb Killa Bar Grenade: Whey protein bar with less than 2g sugar, designed for athletes.
Atkins Protein Bar Atkins Nutritionals: Whey protein-based bar aligned with low-carb diets.
Optimum Nutrition Protein Bar Optimum Nutrition: High-quality whey protein with minimal sugar for post-workout recovery.
PowerBar Protein Plus Reduced Sugar PowerBar: Whey-based bar formulated for endurance athletes with less sugar.
The low-sugar protein bar category represents a sizable and growing intersection of convenience snacking and functional nutrition. With USD 2,100 million in reported 2024 value translating to roughly 600 million units at USD 3.50 each, there is a clear market for both scaled players and agile innovators. The industry is being shaped by sugar-reduction reformulation, advanced production lines that enable multi-layer bars, and shifting downstream channels. Key risks include regulatory/litigation exposure on health claims, ingredient price volatility and the capital intensity of producing indulgent low-sugar textures at scale. For new entrants and investors, success requires disciplined product development, channel execution and cost control via either co-packing partnerships or efficient in-house lines.
Investor Analysis
What: This report provides the market size baseline, unit economics, representative factory economics, and manufacturing throughput ranges. How: Investors can use these metrics to model revenue, factory capacity needs, capital expenditure (capex) sizing, and break-even scenarios for greenfield plants or co-packer deals. Why: Understanding per-unit COGS and channel mix helps forecast margins under alternative scenarios (premium vs value positioning), enables valuation sensitivity to ingredient cost swings, and identifies where scale or automation investments will materially improve unit economics. The included manufacturing capacity ranges and co-packing economics also clarify whether an acquisition of an existing plant or an investment in new lines is more capital-efficient given desired market share. Together, the commercial, manufacturing and channel insights let investors estimate payback timelines, required working capital and margin expansion levers in Asia and ASEAN markets.
Request for Pre-Order Enquiry On This Report
https://www.qyresearch.com/customize/5052253
5 Reasons to Buy This Report
Provides a validated 2024 baseline and unit-level economics useful for financial modeling.
Combines market size with manufacturing throughput ranges so investors can size capex and plant scale.
Regional focus on Asia and ASEAN (including Indonesia) with specific market references and channel guidance for market entry or expansion.
Summarizes latest regulatory and legal developments and production technology news that materially affect risk and capex decisions.
Actionable strategic insights on formulation, channel and co-packing choices that accelerate commercial rollout while managing margin risk.
5 Key Questions Answered
What was the 2024 market value and implied units sold at the stated price?
What are representative factory economics?
What typical production capacities can one expect per line and what are the real-world high/low ranges?
How is demand split across downstream channels and what channel strategy works best in Asia/ASEAN?
What are the principal near-term risks and how should an investor or operator mitigate them?
Chapter Outline
Chapter 1: Introduces the report scope of the report, executive summary of different market segments (by region, product type, application, etc), including the market size of each market segment, future development potential, and so on. It offers a high-level view of the current state of the market and its likely evolution in the short to mid-term, and long term.
Chapter 2: key insights, key emerging trends, etc.
Chapter 3: Manufacturers competitive analysis, detailed analysis of the product manufacturers competitive landscape, price, sales and revenue market share, latest development plan, merger, and acquisition information, etc.
Chapter 4: Provides profiles of key players, introducing the basic situation of the main companies in the market in detail, including product sales, revenue, price, gross margin, product introduction, recent development, etc.
Chapter 5 & 6: Sales, revenue of the product in regional level and country level. It provides a quantitative analysis of the market size and development potential of each region and its main countries and introduces the market development, future development prospects, market space, and market size of each country in the world.
Chapter 7: Provides the analysis of various market segments by Type, covering the market size and development potential of each market segment, to help readers find the blue ocean market in different market segments.
Chapter 8: Provides the analysis of various market segments by Application, covering the market size and development potential of each market segment, to help readers find the blue ocean market in different downstream markets.
Chapter 9: Analysis of industrial chain, including the upstream and downstream of the industry.
Chapter 10: The main points and conclusions of the report.
Contact Information:
Tel: +1 626 2952 442 (US) ; +86-1082945717 (China)
+62 896 3769 3166 (Whatsapp)
Email: willyanto@qyresearch.com; global@qyresearch.com
Website: www.qyresearch.com
About QY Research
QY Research has established close partnerships with over 71,000 global leading players. With more than 20,000 industry experts worldwide, we maintain a strong global network to efficiently gather insights and raw data.
Our 36-step verification system ensures the reliability and quality of our data. With over 2 million reports, we have become the world's largest market report vendor. Our global database spans more than 2,000 sources and covers data from most countries, including import and export details.
We have partners in over 160 countries, providing comprehensive coverage of both sales and research networks. A 90% client return rate and long-term cooperation with key partners demonstrate the high level of service and quality QY Research delivers.
More than 30 IPOs and over 5,000 global media outlets and major corporations have used our data, solidifying QY Research as a global leader in data supply. We are committed to delivering services that exceed both client and societal expectations.
This release was published on openPR.
Permanent link to this press release:
Copy
Please set a link in the press area of your homepage to this press release on openPR. openPR disclaims liability for any content contained in this release.
You can edit or delete your press release Low Sugar Protein Bars Market to Reach USD 3,210 Million by 2031 Top 15 Company Globally here
News-ID: 4194908 • Views: …
More Releases from QY Research
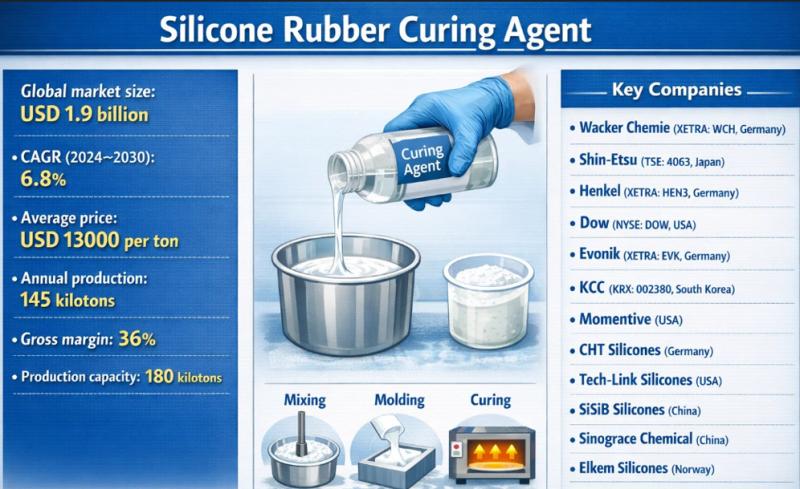
Silicone Rubber Curing Agents: From Slow Cure to Precision Performance
Problem
Manufacturers using conventional curing systems for silicone rubber often faced slow curing speed, inconsistent crosslinking, and limited control over mechanical properties. Inadequate curing could lead to uneven hardness, poor tensile strength, surface tackiness, or reduced thermal and chemical resistance. These issues increased defect rates, extended production cycles, and constrained performance in demanding applications such as electronics, automotive, medical, and industrial sealing.
Solution
Producers adopted Silicone Rubber Curing Agents, specialized additives designed to…
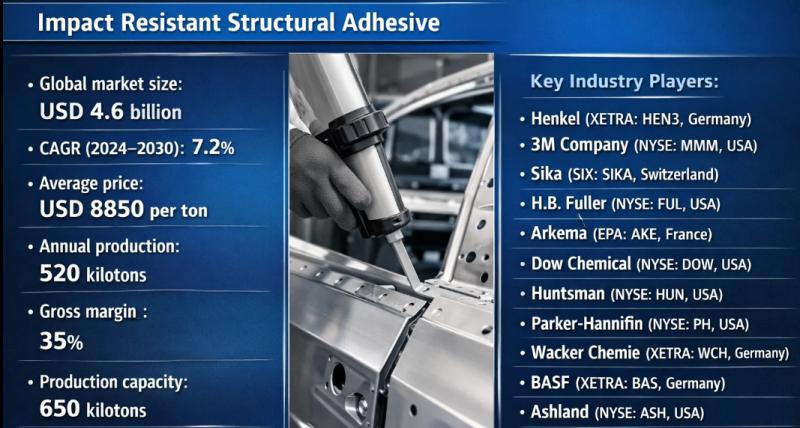
Stronger Than Steel? How Impact-Resistant Adhesives Are Transforming Structural …
Problem
Manufacturers using conventional structural adhesives often encountered brittle failure, poor impact resistance, and joint cracking under dynamic loads, vibration, or thermal cycling. In automotive, aerospace, construction, and industrial equipment, these weaknesses led to joint delamination, reduced crash performance, and higher warranty or maintenance costs-especially where metals, composites, and plastics were bonded together.
Solution
Producers adopted Impact Resistant Structural Adhesive, an advanced adhesive system-typically epoxy-, polyurethane-, or acrylic-based-engineered with rubber tougheners or nano-reinforcements.…
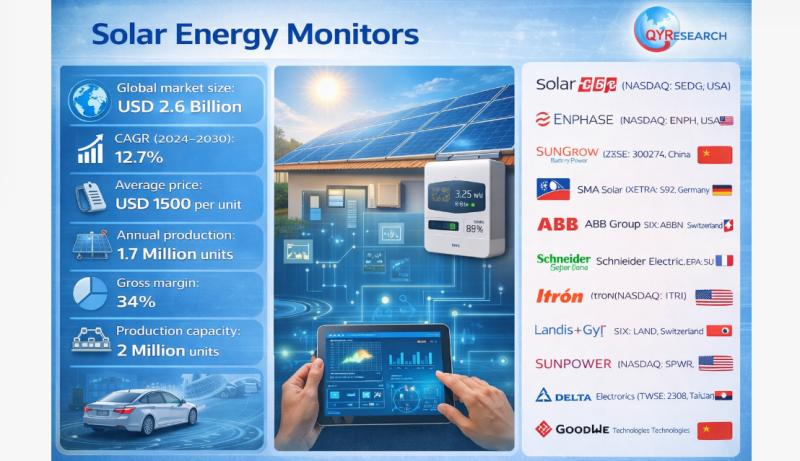
Global and U.S. Solar Energy Monitors Market Report, Published by QY Research.
QY Research has released a comprehensive new market report on Solar Energy Monitors, intelligent monitoring devices and software platforms that track, analyze, and optimize the performance of solar photovoltaic (PV) systems in real time. By measuring parameters such as power output, energy yield, voltage, current, and system efficiency, solar energy monitors are essential tools for homeowners, commercial operators, utilities, and solar asset managers seeking to maximize return on investment and…
Global and U.S. Level 4 Self-Driving Vehicles Market Report, Published by QY Res …
QY Research has released a comprehensive new market report on Level 4 Self-Driving Vehicles, highly automated vehicles capable of performing all driving tasks within defined operational design domains (ODDs) without human intervention. Unlike Level 2-3 systems that require driver supervision or fallback, Level 4 autonomous vehicles can operate safely and independently in specific environments such as urban robotaxi zones, closed campuses, ports, logistics hubs, and dedicated highway corridors. As autonomy…
More Releases for USD
Bone Cement Market Outlook USD 1,871.10M-USD 3,512.31M
How Is the Bone Cement Market Supporting the Rise of Modern Orthopedic Surgery?
The Bone Cement Market plays a critical role in modern orthopedic and spinal procedures, acting as a foundational material for joint replacement, fracture fixation, and vertebral stabilization. Bone cement is widely used to anchor implants, restore bone structure, and improve patient mobility-making it an essential component of musculoskeletal care.
In 2025, the global bone cement market was valued at…
Autologous Cell Therapy Market Outlook USD 9.31B-USD 54.83B
How Is the Autologous Cell Therapy Market Redefining the Future of Precision Medicine?
The Autologous Cell Therapy Market is rapidly emerging as one of the most transformative areas in modern healthcare, offering highly personalized treatment options for complex and chronic diseases. By using a patient's own cells to repair, replace, or regenerate damaged tissues, autologous cell therapy minimizes immune rejection risks while maximizing therapeutic effectiveness.
In 2025, the global autologous cell therapy…
PACS Market USD 5.59B in 2025, USD 9.73B by 2035
Picture Archiving and Communication System (PACS) Market Expands as Digital Imaging Transforms Global Healthcare
Introduction: PACS at the Core of Modern Medical Imaging
The healthcare industry is undergoing a rapid digital transformation, with medical imaging playing a critical role in diagnosis, treatment planning, and patient monitoring. At the heart of this transformation lies the Picture Archiving and Communication System (PACS)-a technology that enables the storage, retrieval, management, and sharing of medical images…
Global HEOR Market USD 1.70B-USD 6.03B
Health Economics and Outcomes Research (HEOR) Market Accelerates as Value-Based Healthcare Redefines Global Decision-Making
Introduction: The Growing Importance of HEOR in Modern Healthcare
The global healthcare industry is undergoing a profound transformation, shifting from volume-driven care models to value-based healthcare systems that prioritize patient outcomes, cost efficiency, and real-world effectiveness. At the center of this transformation lies Health Economics and Outcomes Research (HEOR)-a discipline that evaluates the economic value, clinical outcomes, and…
Foam Tape Market Outlook 2035: Industry Growth from USD USD 4.89 Billion (2025) …
The Foam Tape Market plays a vital role in modern industrial and manufacturing ecosystems. Foam tapes are pressure-sensitive adhesive products manufactured using materials such as polyurethane, polyethylene, PVC, and acrylic foam. These tapes are widely used for bonding, sealing, insulation, cushioning, vibration damping, and noise reduction across multiple industries. Their ability to replace traditional mechanical fasteners like screws, bolts, and rivets has positioned foam tapes as a preferred solution in…
Chlorella Market Reach USD 465.85 Million USD by 2030
Market Growth Fueled by Increased Adoption of Plant-Based Proteins and Health Supplements
Global Chlorella Market size was valued at USD 303.75 Mn. in 2023 and the total Chlorella revenue is expected to grow by 6.3 % from 2024 to 2030, reaching nearly USD 465.85 Mn. . The growth of the market is majorly due to increase in the consumer awareness about health, the inclination towards plant-based food such as chlorella and…
