Press release
Natural Gas Price Trend and Indexes Database 2025: Track Real-Time Pricing

Natural Gas Prices
Natural Gas Prices in United States:
During Q1 2025, global natural gas prices experienced significant volatility, with the USA seeing rates hit 3.65 USD/MMBtu in March. The Natural Gas Price Index reflected these fluctuations, driven by milder early winter temperatures that curbed demand, brief cold snaps that caused temporary price surges, and short-lived production drops in February due to freezing conditions. Elevated storage levels in March further contributed to instability in the global natural gas market.
Get the Real-Time Prices Analysis: https://www.imarcgroup.com/natural-gas-pricing-report/requestsample
Note: The analysis can be tailored to align with the customer's specific needs.
Natural Gas Price Trends in APAC: Q1 2025 Overview
Natural Gas Prices in China:
During Q1 2025, the natural gas price trend in China showed notable fluctuations, reaching 2.87 USD/MMBtu in March. Prices softened in February due to warmer weather and reduced heating demand but rebounded in March as supply tightened and peak-shaving demand increased. Strong domestic production and tariffs on U.S. LNG shifted sourcing strategies, impacting the Natural Gas Price Forecast 2025 and contributing to ongoing market volatility.
Regional Analysis: The price analysis can be extended to provide detailed natural gas price information for the following list of countries.
China, India, Indonesia, Pakistan, Bangladesh, Japan, Philippines, Vietnam, Thailand, South Korea, Malaysia, Nepal, Taiwan, Sri Lanka, Hongkong, Singapore, Australia, and New Zealand, among other Asian countries.
Natural Gas Price Trends in MEA: Q1 2025 Overview
Natural Gas Prices in Saudi Arabia:
During Q1 2025, natural gas prices in Saudi Arabia showed notable fluctuations, reaching 2.88 USD/MMBtu by March. Early in the quarter, strong industrial demand and a surge in electricity consumption pushed prices higher. However, milder weather in February eased power generation needs, helping to stabilize the supply-demand balance. These dynamics are clearly reflected in the updated Natural Gas Price Chart, highlighting a dynamic and evolving regional market outlook.
Regional Analysis: The price analysis can be extended to provide detailed natural gas price information for the following list of countries.
Saudi Arabia, UAE, Israel, Iran, South Africa, Nigeria, Oman, Kuwait, Qatar, Iraq, Egypt, Algeria, and Morocco, among other Middle Eastern and African countries.
Natural Gas Price Trends in APAC: Q1 2025 Overview
Natural Gas Prices in India:
During Q1 2025, India's natural gas price trend was marked by fluctuations, with prices reaching 2.88 USD/MMBtu in March. Early-quarter industrial demand and LNG sourcing pushed prices higher, but milder weather and stable storage led to a mid-quarter dip. Favourable tariff adjustments and strategic import agreements supported more economical sourcing. These dynamics are captured in the Natural Gas Price Index, reflecting India's evolving role in the global natural gas market.
Regional Analysis: The price analysis can be extended to provide detailed natural gas price information for the following list of countries.
China, India, Indonesia, Pakistan, Bangladesh, Japan, Philippines, Vietnam, Thailand, South Korea, Malaysia, Nepal, Taiwan, Sri Lanka, Hongkong, Singapore, Australia, and New Zealand, among other Asian countries.
Natural Gas Price Trends in Europe: Q1 2025 Overview
Caustic Soda Prices in Brazil:
During Q1 2025, Brazil's natural gas prices declined to 12.8 USD/MMBtu in March, driven by government initiatives to lower transportation and processing costs. Strategic infrastructure investments and optimized supply routes eased market pressures and improved distribution efficiency. These measures are reflected in the Natural Gas Price Index, helping to stabilize global natural gas prices by strengthening regional supply capabilities and reducing reliance on more expensive imports.
Regional Analysis: The price analysis can be expanded to include detailed natural gas price data for a wide range of European countries:
such as Germany, France, the United Kingdom, Italy, Spain, Russia, Turkey, the Netherlands, Poland, Sweden, Belgium, Austria, Ireland, Switzerland, Norway, Denmark, Romania, Finland, the Czech Republic, Portugal, and Greece, along with other European nations.
Key Factors Influencing Natural Gas Prices, Trend, Index, and Forecast (2025)
Key factors impacting prices:
• Weather: Drives heating (winter) and cooling (summer) demand.
• Production: Drilling activity and technological advancements (e.g., fracking).
• Storage Levels: High levels suggest ample supply, low levels signal potential
shortages.
• LNG Trade: Growing global exports/imports connect markets.
• Geopolitics: Conflicts or instability can disrupt supply.
• Economic Conditions: Influences industrial and power generation demand.
• Competition: Prices of coal and renewables affect gas demand for electricity.
Main Price Indexes:
• Henry Hub (U.S.): North American benchmark.
• Dutch TTF (Europe): Key European benchmark.
• JKM (Asia): Asian LNG spot price marker.
Forecasting involves:
• Fundamental Analysis: Balancing supply, demand, weather, and economic outlooks.
• Technical Analysis: Chart patterns and indicators.
• Quantitative Models: Statistical and AI-driven predictions.
In short, natural gas prices are highly volatile and influenced by a dynamic mix of physical market fundamentals, geopolitical risks, and global energy trends.
FAQs about the Natural Gas Price Trend & Forecast:
What is the current trend in natural gas prices globally?
Natural gas prices are showing mixed trends across regions. In the U.S., prices have remained relatively stable due to strong domestic production. However, in Europe and Asia, prices are more volatile because of supply chain issues, geopolitical tensions, and seasonal demand changes. Overall, prices have cooled off since the 2022-2023 energy crisis but still fluctuate based on regional factors.
How is the natural gas price index calculated?
The natural gas price index is calculated by averaging spot prices from different trading hubs like Henry Hub (U.S.), TTF (Europe), and JKM (Asia). These indices reflect the market value of gas at specific locations and times. They are used by traders, industries, and governments to monitor trends and benchmark contract prices.
What factors influence the forecast of natural gas prices?
Several key factors impact natural gas price forecasts, including supply levels, global demand, weather conditions, geopolitical events, and LNG trade flows. For example, colder winters increase demand for heating, while political instability in gas-producing regions can affect supply. Storage levels and transition to renewable energy also play a role in long-term forecasts.
What is the expected outlook for natural gas prices in 2025?
Natural gas prices in 2025 are expected to rise gradually, with some seasonal and regional fluctuations. Increased demand from growing economies, especially in Asia, may push prices up. However, expanded LNG production and higher output from the U.S. could help stabilize prices. Experts predict average prices to stay between $2.50-$4.00/MMBtu in the U.S., with more variability in international markets.
Speak to An Analyst: https://www.imarcgroup.com/request?type=report&id=22409&flag=C
Key Coverage:
• Market Analysis
• Market Breakup by Region
• Demand Supply Analysis by Type
• Demand Supply Analysis by Application
• Demand Supply Analysis of Raw Materials
• Price Analysis
o Spot Prices by Major Ports
o Price Breakup
o Price Trends by Region
o Factors influencing the Price Trends
• Market Drivers, Restraints, and Opportunities
• Competitive Landscape
• Recent Developments
• Global Event Analysis
How IMARC Pricing Database Can Help:
The latest IMARC Group study, "Natural Gas Prices, Trend, Chart, Demand, Market Analysis, News, Historical and Forecast Data 2025 Edition," presents a detailed analysis of Natural Gas price trend, offering key insights into global Natural Gas market dynamics. This report includes comprehensive price charts, which trace historical data and highlights major shifts in the market.
The analysis delves into the factors driving these trends, including raw material costs, production fluctuations, and geopolitical influences. Moreover, the report examines Natural Gas demand, illustrating how consumer behaviour and industrial needs affect overall market dynamics. By exploring the intricate relationship between supply and demand, the prices report uncovers critical factors influencing current and future prices.
About Us:
IMARC Group is a global management consulting firm that provides a comprehensive suite of services to support market entry and expansion efforts. The company offers detailed market assessments, feasibility studies, regulatory approvals and licensing support, and pricing analysis, including spot pricing and regional price trends. Its expertise spans demand-supply analysis alongside regional insights covering Asia-Pacific, Europe, North America, Latin America, and the Middle East and Africa. IMARC also specializes in competitive landscape evaluations, profiling key market players, and conducting research into market drivers, restraints, and opportunities. IMARC's data-driven approach helps businesses navigate complex markets with precision and confidence.
Contact us:
IMARC Group
134 N 4th St. Brooklyn, NY 11249, USA
Email: sales@imarcgroup.com
Tel No: (D) +91 120 433 0800
United States: +1-631-791-1145
This release was published on openPR.
Permanent link to this press release:
Copy
Please set a link in the press area of your homepage to this press release on openPR. openPR disclaims liability for any content contained in this release.
You can edit or delete your press release Natural Gas Price Trend and Indexes Database 2025: Track Real-Time Pricing here
News-ID: 4037755 • Views: …
More Releases from IMARC Group
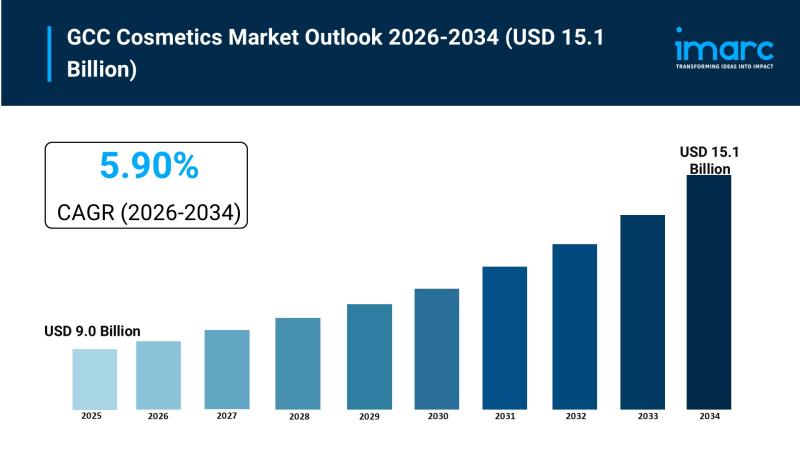
GCC Cosmetics Market Size to Hit USD 15.1 Billion by 2034 | With a 5.90% CAGR
GCC Cosmetics Market Overview
Market Size in 2025: USD 9.0 Billion
Market Size in 2034: USD 15.1 Billion
Market Growth Rate 2026-2034: 5.90%
According to IMARC Group's latest research publication, "GCC Cosmetics Market Size, Share, Trends and Forecast by Product Type, Category, Gender, Distribution Channel, and Country, 2026-2034", The GCC cosmetics market size was valued at USD 9.0 Billion in 2025. Looking forward, IMARC Group estimates the market to reach USD 15.1 Billion by…
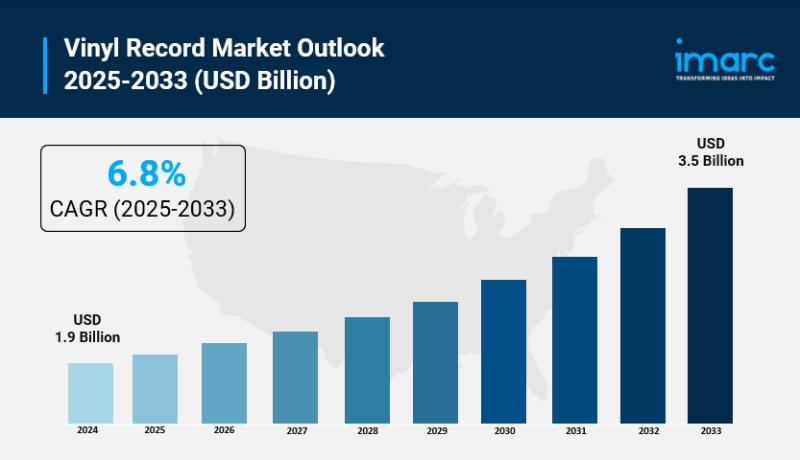
Vinyl Record Market Size to Reach USD 3.5 Billion by 2033 | With a 6.8% CAGR
Market Overview:
According to IMARC Group's latest research publication, "Vinyl Record Market Report by Product (LP/EP Vinyl Records, Single Vinyl Records), Feature (Colored, Gatefold, Picture), Gender (Men, Women), Age Group (13-17, 18-25, 26-35, 36-50, Above 50), Application (Private, Commercial), Distribution Channel (Supermarkets and Hypermarkets, Independent Retailers, Online Stores, and Others), and Region 2025-2033", The global vinyl record market size reached USD 1.9 Billion in 2024. Looking forward, IMARC Group expects the…
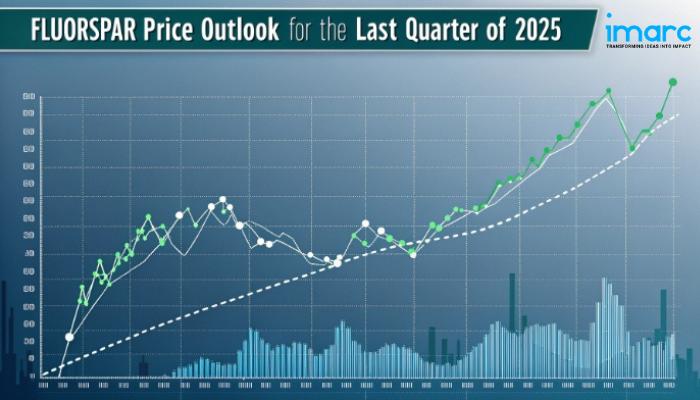
North America Fluorspar Prices Rise in Q4 2025: USA at USD 484/MT, Canada Peaks …
North America Fluorspar Prices Movement Q4 2025:
Fluorspar Prices in USA:
In Q4 2025, fluorspar prices in the USA averaged USD 484 per metric ton. Stable demand from aluminum production and chemical manufacturing supported price levels. Domestic mining operations maintained consistent output, while transportation and energy costs influenced overall supply. Moderate industrial activity and inventory management helped prevent significant price fluctuations across the regional market.
Get the Real-Time Prices Analysis: https://www.imarcgroup.com/fluorspar-pricing-report/requestsample
Note: The analysis…

Brazil Hybrid Electric Vehicle Market: Growth Dynamics, Consumer Shifts, and Com …
The Brazil hybrid electric vehicle market size was 348.75 Thousand Units in 2025 and is forecasted to reach 2,551.74 Thousand Units by 2034, reflecting a CAGR of 24.75% during 2026-2034. This robust expansion is fueled by increasing environmental awareness, rising fuel costs, and government policies aimed at emission reduction. Advances in battery technology and flex-fuel hybrid variants leveraging Brazil's ethanol resources also contribute to market growth.
Sample Request Link: https://www.imarcgroup.com/brazil-hybrid-electric-vehicle-market/requestsample
Study Assumption…
More Releases for Price
Bitcoin Price, XRP Price, and Dogecoin Price Analysis: Turn Volatility into Prof …
London, UK, 4th October 2025, ZEX PR WIRE, The price movements in the cryptocurrency market can be crazy. Bitcoin price (BTC price), XRP price, and Dogecoin price vary from day to day, which can make it complicated for traders. Some investors win, but many more lose, amid unpredictable volatility. But there's a more intelligent way and that is Hashf . Instead of contemplating charts, Hashf provides an opportunity for investors…
HOTEL PRICE KILLER - BEAT YOUR BEST PRICE!
Noble Travels Launches 'Hotel Price Killer' to Beat OTA Hotel Prices
New Delhi, India & Atlanta, USA - August 11, 2025 - Noble Travels, a trusted name in the travel industry for over 30 years, has launched a bold new service called Hotel Price Killer, promising to beat the best hotel prices offered by major online travel agencies (OTAs) and websites.
With offices in India and USA, Noble Travels proudly serves an…
Toluene Price Chart, Index, Price Trend and Forecast
Toluene TDI Grade Price Trend Analysis - EX-Kandla (India)
The pricing trend for Toluene Diisocyanate (TDI) grade at EX-Kandla in India reveals notable fluctuations over the past year, influenced by global supply-demand dynamics and domestic economic conditions. From October to December 2023, the average price of TDI declined from ₹93/KG in October to ₹80/KG in December. This downward trend continued into 2024, with October witnessing a significant drop to ₹73/KG, a…
Glutaraldehyde Price Trend, Price Chart 2025 and Forecast
North America Glutaraldehyde Prices Movement Q1:
Glutaraldehyde Prices in USA:
Glutaraldehyde prices in the USA dropped to 1826 USD/MT in March 2025, driven by oversupply and weak demand across manufacturing and healthcare. The price trend remained negative as inventories rose and procurement slowed sharply in February. The price index captured this decline, while the price chart reflected persistent downward pressure throughout the quarter.
Get the Real-Time Prices Analysis: https://www.imarcgroup.com/glutaraldehyde-pricing-report/requestsample
Note: The analysis can…
Butane Price Trend 2025, Update Price Index and Real Time Price Analysis
MEA Butane Prices Movement Q1 2025:
Butane Prices in Saudi Arabia:
In the first quarter of 2025, butane prices in Saudi Arabia reached 655 USD/MT in March. The pricing remained stable due to consistent domestic production and strong export activities. The country's refining capacity and access to natural gas feedstock supported price control, even as global energy markets saw fluctuations driven by seasonal demand and geopolitical developments impacting the Middle East.
Get the…
Tungsten Price Trend, Chart, Price Fluctuations and Forecast
North America Tungsten Prices Movement:
Tungsten Prices in USA:
In the last quarter, tungsten prices in the United States reached 86,200 USD/MT in December. The price increase was influenced by high demand from the aerospace and electronics industries. Factors such as production costs and raw material availability, alongside market fluctuations, also contributed to the pricing trend.
Get the Real-Time Prices Analysis: https://www.imarcgroup.com/tungsten-pricing-report/requestsample
Note: The analysis can be tailored to align with the customer's specific…
