Press release
Optical Amplifiers Market Trends, Growth Analysis, Investigation by Regions, Types, Applications and Analysis of Key Players
QY Research released a latest market research report on the Global Optical Amplifiers market, which is segmented by region (country), company, by Purity, and by Application. Players, stakeholders, and other participants in the global Optical Amplifiers market will be able to gain the upper hand as they use the report as a powerful resource. The segmental analysis focuses on sales, revenue and forecast by region (country) and by Application for the period 2017-2028.For More Information About This Report, Please Enter:
https://us.qyresearch.com/reports/348368/optical-amplifiers
Summary
Market Analysis and Insights: Global Optical Amplifiers Market
The global Optical Amplifiers market was valued at US$ 911.59 million in 2020 and it is expected to reach US$ 1580.90 million by the end of 2027, growing at a CAGR of 7.83% during 2021-2027.
Global Optical Amplifiers Scope and Segment
Optical Amplifiers market is segmented by Type, and by Application. Players, stakeholders, and other participants in the global Optical Amplifiers market will be able to gain the upper hand as they use the report as a powerful resource. The segmental analysis focuses on production capacity, revenue and forecast by Type, and by Application for the period 2016-2027.
By Company
Finisar (II-VI Incorporated)
VIAVI Solutions Inc
Accelink
Lumentum
Wuxi Taclink
Keopsys
Cisco
IPG
O-Net Technologies
Nuphoton Technologies
Inphenix
Bktel photonics
Shanghai Hopecom Optic Communications
Thorlabs
Emcore
Segment by Type
EDFA (Erbium Doped Fiber Amplifier)
SOA (Semiconductor Optical Amplifier)
Nonlinear Optical Amplifier
Segment by Application
Broadcast/CATV
Telecommunication
Data Center
Others
The Goal of the Report
1.To study and analyze the global Optical Amplifiers consumption (value & volume) by key regions/countries, type and application, history data from 2017 to 2022, and forecast to 2028.
2.To understand the structure of Optical Amplifiers market by identifying its various subsegments.
3.Focuses on the key global Optical Amplifiers manufacturers, to define, describe and analyze the sales volume, value, market share, market competition landscape, SWOT analysis and development plans in next few years.
4.To analyze the Optical Amplifiers with respect to individual growth trends, prospects, and their contribution to the total market.
5.To share detailed information about the key factors influencing the growth of the market (growth potential, opportunities, drivers, industry-specific challenges, and risks).
6.To project the consumption of Optical Amplifiers submarkets, with respect to key regions (along with their respective key countries).
7.To analyze competitive developments such as expansions, agreements, new product launches, and acquisitions in the market.
8.To strategically profile the key players and comprehensively analyze their growth strategies.
Target Audience
> Optical Amplifiers companies
> Research organizations
> Government Organizations
> Research/Consultancy firms
Table of Contents
1 STUDY COVERAGE 1
1.1 Optical Amplifiers Product Introduction 1
1.2 Market by Type 1
1.2.1 Global Optical Amplifiers Market Size Growth Rate Analysis by Type: 2021 VS 2027 1
1.2.2 EDFA (Erbium Doped Fiber Amplifier) 2
1.2.3 SOA (Semiconductor Optical Amplifier) 3
1.2.4 Nonlinear Optical Amplifier 4
1.3 Market by Application 5
1.3.1 Global Optical Amplifiers Consumption Comparison by Application: 2016 VS 2021 VS 2027 5
1.3.2 Broadcast/CATV 6
1.3.3 Telecommunication 7
1.3.4 Data Center 7
1.4 Study Objectives 8
1.5 Years Considered 9
2 GLOBAL OPTICAL AMPLIFIERS PRODUCTION 10
2.1 Global Optical Amplifiers Production by Region: 2016 VS 2021 VS 2027 10
2.2 Global Optical Amplifiers Production by Region 11
2.2.1 Global Optical Amplifiers Historic Production by Region (2016-2021) 11
2.2.2 Global Optical Amplifiers Forecasted Production by Region (2022-2027) 12
2.3 North America 14
2.4 Europe 15
2.5 China 16
2.6 Asia Other 17
3 GLOBAL OPTICAL AMPLIFIERS SALES IN VOLUME & VALUE ESTIMATES AND FORECASTS 18
3.1 Global Optical Amplifiers Sales Estimates and Forecasts 2016-2027 18
3.2 Global Optical Amplifiers Revenue Estimates and Forecasts 2016-2027 19
3.3 Global Optical Amplifiers Revenue by Region: 2016 VS 2021 VS 2027 20
3.4 Global Top Optical Amplifiers Regions by Sales 21
3.4.1 Global Top Optical Amplifiers Regions by Sales (2016-2021) 21
3.4.2 Global Top Optical Amplifiers Regions by Sales (2022-2027) 22
3.5 Global Top Optical Amplifiers Regions by Revenue 23
3.5.1 Global Top Optical Amplifiers Regions by Revenue (2016-2021) 23
3.5.2 Global Top Optical Amplifiers Regions by Revenue (2022-2027) 24
3.6 North America 25
3.7 Europe 26
3.8 Asia-Pacific 27
3.9 South America 28
3.10 Middle East & Africa 29
4 COMPETITION BY MANUFACTURERS 31
4.1 Global Optical Amplifiers Sales by Manufacturers 31
4.1.1 Global Top Optical Amplifiers Manufacturers by Sales (2016-2021) 31
4.1.2 Global Top Optical Amplifiers Manufacturers Market Share by Sales (2016-2021) 31
4.1.3 Global Top 3 and Top 5 Companies by Optical Amplifiers Sales in 2020 33
4.2 Global Optical Amplifiers Revenue by Manufacturers 34
4.2.1 Global Top Optical Amplifiers Manufacturers by Revenue (2016-2021) 34
4.2.2 Global Top Optical Amplifiers Manufacturers Market Share by Revenue (2016-2021) 34
4.2.3 Global Top 3 and Top 5 Companies by Optical Amplifiers Revenue in 2020 36
4.3 Global Optical Amplifiers Sales Price by Manufacturers 37
4.4 Analysis of Competitive Landscape 38
4.4.1 Manufacturers Market Concentration Ratio (CR5 and HHI) 38
4.4.2 Global Optical Amplifiers Manufacturers Geographical Distribution 39
4.5 Mergers & Acquisitions, Expansion Plans 40
5 MARKET SIZE BY TYPE 42
5.1 Global Optical Amplifiers Sales by Type 42
5.1.1 Global Optical Amplifiers Historical Sales by Type (2016-2021) 42
5.1.2 Global Optical Amplifiers Forecasted Sales by Type (2022-2027) 42
5.1.3 Global Optical Amplifiers Sales Market Share by Type (2016-2027) 42
5.2 Global Optical Amplifiers Revenue by Type 43
5.2.1 Global Optical Amplifiers Historical Revenue by Type (2016-2021) 43
5.2.2 Global Optical Amplifiers Forecasted Revenue by Type (2022-2027) 44
5.2.3 Global Optical Amplifiers Revenue Market Share by Type (2016-2027) 44
5.3 Global Optical Amplifiers Price by Type 45
5.3.1 Global Optical Amplifiers Price by Type (2016-2021) 45
5.3.2 Global Optical Amplifiers Price Forecast by Type (2022-2027) 45
6 MARKET SIZE BY APPLICATION 47
6.1 Global Optical Amplifiers Sales by Application 47
6.1.1 Global Optical Amplifiers Historical Sales by Application (2016-2021) 47
6.1.2 Global Optical Amplifiers Forecasted Sales by Application (2022-2027) 47
6.1.3 Global Optical Amplifiers Sales Market Share by Application (2016-2027) 47
6.2 Global Optical Amplifiers Revenue by Application 48
6.2.1 Global Optical Amplifiers Historical Revenue by Application (2016-2021) 48
6.2.2 Global Optical Amplifiers Forecasted Revenue by Application (2022-2027) 49
6.2.3 Global Optical Amplifiers Revenue Market Share by Application (2016-2027) 49
6.3 Global Optical Amplifiers Price by Application 50
6.3.1 Global Optical Amplifiers Price by Application (2016-2021) 50
6.3.2 Global Optical Amplifiers Price Forecast by Application (2022-2027) 50
7 NORTH AMERICA 52
7.1 North America Optical Amplifiers Market Size by Type 52
7.2 North America Optical Amplifiers Market Size by Application 52
7.3 North America Optical Amplifiers Sales by Country 53
7.3.1 North America Optical Amplifiers Sales by Country (2016-2027) 53
7.3.2 North America Optical Amplifiers Revenue by Country (2016-2027) 54
7.3.3 United States 55
7.3.4 Canada 56
7.3.5 Mexico 56
8 EUROPE 57
8.1 Europe Optical Amplifiers Market Size by Type 57
8.2 Europe Optical Amplifiers Market Size by Application 57
8.3 Europe Optical Amplifiers Market Size by Country 58
8.3.1 Europe Optical Amplifiers Sales by Country (2016-2027) 58
8.3.2 Europe Optical Amplifiers Revenue by Country (2016-2027) 59
8.3.3 Germany 60
8.3.4 France 61
8.3.5 U.K. 61
8.3.6 Italy 61
8.3.7 Russia 61
9 ASIA PACIFIC 62
9.1 Asia Pacific Optical Amplifiers Market Size by Type 62
9.2 Asia Pacific Optical Amplifiers Market Size by Application 62
9.3 Asia Pacific Optical Amplifiers Market Size by Region 63
9.3.1 Asia Pacific Optical Amplifiers Sales by Region (2016-2027) 63
9.3.2 Asia Pacific Optical Amplifiers Revenue by Region (2016-2027) 65
9.3.3 China 66
9.3.4 Japan 66
9.3.5 South Korea 66
9.3.6 India 67
9.3.7 Southeast Asia 67
9.3.8 Australia 67
10 LATIN AMERICA 68
10.1 Latin America Optical Amplifiers Market Size by Type 68
10.2 Latin America Optical Amplifiers Market Size by Application 68
10.3 Latin America Optical Amplifiers Market Size by Country 69
10.3.1 Latin America Optical Amplifiers Sales by Country (2016-2027) 69
10.3.2 Latin America Optical Amplifiers Revenue by Country (2016-2027) 70
10.3.3 Brazil 71
10.3.4 Argentina 71
11 MIDDLE EAST AND AFRICA 72
11.1 Middle East and Africa Optical Amplifiers Market Size by Type 72
11.2 Middle East and Africa Optical Amplifiers Market Size by Application 72
11.3 Middle East and Africa Optical Amplifiers Market Size by Country 73
11.3.1 Middle East and Africa Optical Amplifiers Sales by Country (2016-2027) 73
11.3.2 Middle East and Africa Optical Amplifiers Revenue by Country (2016-2027) 74
11.3.3 Turkey 76
11.3.4 Saudi Arabia 76
11.3.5 UAE 76
12 CORPORATE PROFILE 77
12.1 Finisar (II-VI Incorporated) 77
12.1.1 Finisar (II-VI Incorporated) Optical Amplifiers Corporation Information 77
12.1.2 Finisar (II-VI Incorporated) Optical Amplifiers Product Portfolio 77
12.1.3 Finisar (II-VI Incorporated) Optical Amplifiers Sales, Revenue, Price and Gross Margin (2016-2021) 78
12.1.4 Finisar (II-VI Incorporated) Main Business and Markets Served 79
12.2 VIAVI Solutions Inc 79
12.2.1 VIAVI Solutions Inc Optical Amplifiers Corporation Information 79
12.2.2 VIAVI Solutions Inc Optical Amplifiers Product Portfolio 80
12.2.3 VIAVI Solutions Inc Optical Amplifiers Sales, Revenue, Price and Gross Margin (2016-2021) 81
12.2.4 VIAVI Solutions Inc Main Business and Markets Served 81
12.3 Accelink 82
12.3.1 Accelink Optical Amplifiers Corporation Information 82
12.3.2 Accelink Optical Amplifiers Product Portfolio 82
12.3.3 Accelink Optical Amplifiers Sales, Revenue, Price and Gross Margin (2016-2021) 83
12.3.4 Accelink Main Business and Markets Served 83
12.4 Lumentum 85
12.4.1 Lumentum Optical Amplifiers Corporation Information 85
12.4.2 Lumentum Optical Amplifiers Product Portfolio 85
12.4.3 Lumentum Optical Amplifiers Sales, Revenue, Price and Gross Margin (2016-2021) 87
12.4.4 Lumentum Main Business and Markets Served 88
12.5 Wuxi Taclink 88
12.5.1 Wuxi Taclink Optical Amplifiers Corporation Information 88
12.5.2 Wuxi Taclink Optical Amplifiers Product Portfolio 89
12.5.3 Wuxi Taclink Optical Amplifiers Sales, Revenue, Price and Gross Margin (2016-2021) 89
12.5.4 Wuxi Taclink Main Business and Markets Served 90
12.6 Keopsys 90
12.6.1 Keopsys Optical Amplifiers Corporation Information 90
12.6.2 Keopsys Optical Amplifiers Product Portfolio 91
12.6.3 Keopsys Optical Amplifiers Sales, Revenue, Price and Gross Margin (2016-2021) 92
12.6.4 Keopsys Main Business and Markets Served 92
12.7 Cisco 93
12.7.1 Cisco Optical Amplifiers Corporation Information 93
12.7.2 Cisco Optical Amplifiers Product Portfolio 93
12.7.3 Cisco Optical Amplifiers Sales, Revenue, Price and Gross Margin (2016-2021) 95
12.7.4 Cisco Main Business and Markets Served 95
12.8 IPG 95
12.8.1 IPG Optical Amplifiers Corporation Information 95
12.8.2 IPG Optical Amplifiers Product Portfolio 96
12.8.3 IPG Optical Amplifiers Sales, Revenue, Price and Gross Margin (2016-2021) 97
12.8.4 IPG Main Business and Markets Served 97
12.9 O-Net Technologies 98
12.9.1 O-Net Technologies Optical Amplifiers Corporation Information 98
12.9.2 O-Net Technologies Optical Amplifiers Product Portfolio 98
12.9.3 O-Net Technologies Optical Amplifiers Sales, Revenue, Price and Gross Margin (2016-2021) 99
12.9.4 O-Net Technologies Main Business and Markets Served 99
12.10 Nuphoton Technologies 100
12.10.1 Nuphoton Technologies Optical Amplifiers Corporation Information 100
12.10.2 Nuphoton Technologies Optical Amplifiers Product Portfolio 101
12.10.3 Nuphoton Technologies Optical Amplifiers Sales, Revenue, Price and Gross Margin (2016-2021) 102
12.10.4 Nuphoton Technologies Main Business and Markets Served 102
12.11 Inphenix 103
12.11.1 Inphenix Optical Amplifiers Corporation Information 103
12.11.2 Inphenix Optical Amplifiers Product Portfolio 103
12.11.3 Inphenix Optical Amplifiers Sales, Revenue, Price and Gross Margin (2016-2021) 105
12.11.4 Inphenix Main Business and Markets Served 105
12.12 Bktel photonics 106
12.12.1 Bktel photonics Optical Amplifiers Corporation Information 106
12.12.2 Bktel photonics Optical Amplifiers Product Portfolio 106
12.12.3 Bktel photonics Optical Amplifiers Sales, Revenue, Price and Gross Margin (2016-2021) 107
12.12.4 Bktel photonics Main Business and Markets Served 107
12.13 Shanghai Hopecom Optic Communications 108
12.13.1 Shanghai Hopecom Optic Communications Optical Amplifiers Corporation Information 108
12.13.2 Shanghai Hopecom Optic Communications Optical Amplifiers Product Portfolio 109
12.13.3 Shanghai Hopecom Optic Communications Optical Amplifiers Sales, Revenue, Price and Gross Margin (2016-2021) 109
12.13.4 Shanghai Hopecom Optic Communications Main Business and Markets Served 110
12.14 Thorlabs 110
12.14.1 Thorlabs Optical Amplifiers Corporation Information 110
12.14.2 Thorlabs Optical Amplifiers Product Portfolio 111
12.14.3 Thorlabs Optical Amplifiers Sales, Revenue, Price and Gross Margin (2016-2021) 112
12.14.4 Thorlabs Main Business and Markets Served 112
12.15 Emcore 113
12.15.1 Emcore Optical Amplifiers Corporation Information 113
12.15.2 Emcore Optical Amplifiers Product Portfolio 113
12.15.3 Emcore Optical Amplifiers Sales, Revenue, Price and Gross Margin (2016-2021) 114
12.15.4 Emcore Main Business and Markets Served 114
13 INDUSTRY CHAIN AND SALES CHANNELS ANALYSIS 116
13.1 Optical Amplifiers Industry Chain Analysis 116
13.2 Optical Amplifiers Key Components Analysis 116
13.2.1 Key Components 116
13.2.2 Key Suppliers of Components 117
13.3 Optical Amplifiers Production Mode & Process 118
13.4 Optical Amplifiers Sales and Marketing 118
13.4.1 Optical Amplifiers Sales Channels 118
13.4.2 Optical Amplifiers Distributors 120
13.5 Optical Amplifiers Customers 121
14 OPTICAL AMPLIFIERS MARKET DYNAMICS 122
14.1 Optical Amplifiers Industry Trends 122
14.2 Optical Amplifiers Growth Drivers 123
14.3 Optical Amplifiers Market Challenges and Restraints 123
15 KEY FINDINGS IN THE GLOBAL OPTICAL AMPLIFIERS STUDY 124
16 APPENDIX 125
16.1 Research Methodology 125
16.1.1 Methodology/Research Approach 125
16.1.2 Data Source 128
16.2 Author Details 130
16.3 Disclaimer 131
Access full Report Description, Table of Figure, Chart, FREE sample, etc. please clic
https://us.qyresearch.com/reports/348368/optical-amplifiers
Any doubts and questions will be welcome.
Customization of the Report:
This report can be customized to meet the client's requirements. Please contact with us (global@qyresearch.com), who will ensure that you get a report that suits your needs.
About Us:
QYResearch founded in California, USA in 2007.It is a leading global market research and consulting company. With over 15 years' experience and professional research team in various cities over the world,QY Research focuses on management consulting, database and seminar services, IPO consulting, industry chain research and customized research to help our clients in providing non-linear revenue model and make them successful. We are globally recognized for our expansive portfolio of services, good corporate citizenship, and our strong commitment to sustainability. Up to now, we have cooperated with more than 59,000 clients across five continents. Let's work closely with you and build a bold and better future.
Contact Us
QY Research
E-mail: global@qyresearch.com
Tel: +1-626-842-1666(US) +852-5808-0956 (HK)
Add: 17890 Castleton Street Suite 369 City of Industry CA 91748 United States
Website: https://us.qyresearch.com
QY Research released a latest market research report on the Global Optical Amplifiers market, which is segmented by region (country), company, by Purity, and by Application. Players, stakeholders, and other participants in the global Optical Amplifiers market will be able to gain the upper hand as they use the report as a powerful resource. The segmental analysis focuses on sales, revenue and forecast by region (country) and by Application for the period 2017-2028.
QYResearch founded in California, USA in 2007.It is a leading global market research and consulting company. With over 15 years' experience and professional research team in various cities over the world,QY Research focuses on management consulting, database and seminar services, IPO consulting, industry chain research and customized research to help our clients in providing non-linear revenue model and make them successful. We are globally recognized for our expansive portfolio of services, good corporate citizenship, and our strong commitment to sustainability. Up to now, we have cooperated with more than 59,000 clients across five continents. Let's work closely with you and build a bold and better future.
This release was published on openPR.
Permanent link to this press release:
Copy
Please set a link in the press area of your homepage to this press release on openPR. openPR disclaims liability for any content contained in this release.
You can edit or delete your press release Optical Amplifiers Market Trends, Growth Analysis, Investigation by Regions, Types, Applications and Analysis of Key Players here
News-ID: 2604914 • Views: …
More Releases from QY Research
Top 30 Indonesian Rubber Public Companies - Q3 2025 Revenue & Performance
1) Overall companies' performance (Q3 2025 snapshot)
PT Gajah Tunggal Tbk
PT Multistrada Arah Sarana Tbk
PT Goodyear Indonesia Tbk
PT King Tire Indonesia
PT Indo Kordsa Tbk
PT Kirana Megatara Tbk
PT Bumi Serpong Damai Tbk
PT Adaro Energy Tbk
PT ACE Hardware Indonesia Tbk
PT Suryaraya Rubberindo Tbk
PT Dharma Polimetal Tbk
PT Selamat Sempurna Tbk
PT Indospring Tbk
PT Autopedia Sukses Lestari Tbk
PT Nipress Tbk
PT Prima Alloy Steel Universal Tbk
PT Anugerah Spareparts Sejahtera Tbk
PT Bintang Oto…
Smart Vacuum Grippers Reshape Industrial Handling Market Through 2032
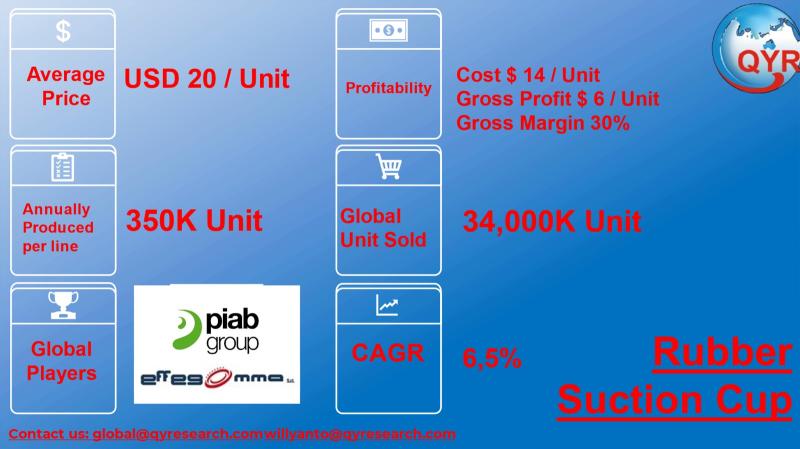
Rubber suction cups are flexible vacuum-based gripping components used for temporary adhesion and handling across consumer, industrial, and automation applications
Widely applied in packaging lines, glass handling, automotive assembly, electronics pick-and-place, medical devices, and household accessories
Manufactured primarily from silicone rubber, EPDM, nitrile (NBR), natural rubber, and thermoplastic elastomers
Industry characterized by high-volume standardized parts combined with customized industrial vacuum grippers for robotics and smart factories
Demand closely linked to automation penetration, e-commerce packaging…
Renewable Plastic Packaging 2025: ASEAN Growth and 28% Margins Driving the Next …
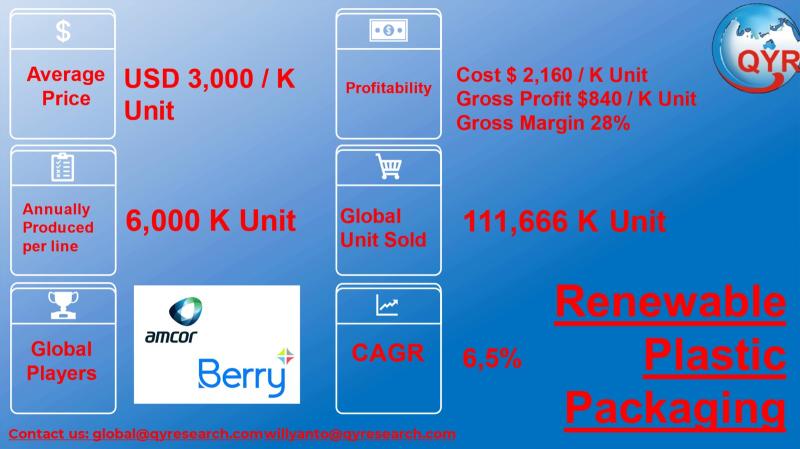
Renewable plastic packaging refers to packaging materials produced from bio-based, compostable, or renewable feedstocks such as PLA, PHA, starch blends, bio-PE, and bio-PET.
Derived from corn, sugarcane, cassava, cellulose, and plant oils, replacing fossil-fuel plastics to reduce carbon footprint and landfill load.
Applications include:
Food & beverage flexible packs
Retail carry bags
Personal care bottles
E-commerce mailers
Agricultural films
Adoption driven by:
Government plastic taxes & EPR mandates
ESG commitments from FMCG brands
Consumer preference for biodegradable/low-carbon materials
Retailers banning single-use fossil…
From Plastic-Free to Premium: The Future of the Global Facial Wipes Industry
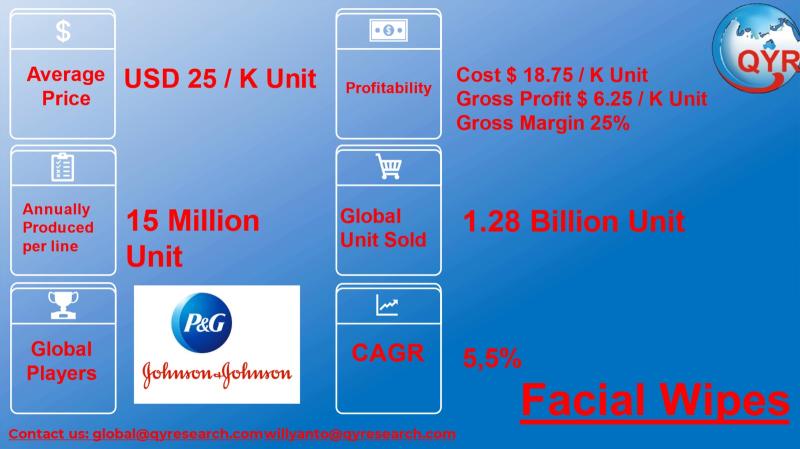
Facial wipes are disposable non-woven textile products pre-saturated with cleansing or skincare solutions used for makeup removal, hygiene, moisturizing, and antibacterial purposes
Widely adopted across personal care, travel, baby care, sports, hospital, and on-the-go convenience segments
Increasing penetration driven by busy lifestyles, urbanization, higher disposable income, and rising skincare awareness
Core buyers include mass retail, convenience stores, e-commerce, beauty chains, pharmacies, and hospitality sectors
Industry Explanation and Global Overview
Combines nonwoven fabric manufacturing (spunlace, airlaid)…
More Releases for Optic
Enhancing Fiber Optic Network Efficiency: Innovations in MPO Patch Cords and Fib …
As the demand for data transmission continues to grow, businesses and service providers are placing higher expectations on the reliability and efficiency of fiber optic networks. In response, innovations in MPO patch cords [https://www.sdgicable.com/products-detail/id-30.html] and fiber optic splitters [https://www.sdgicable.com/products-detail/Fiber-Optic-Splitter.html ] have emerged as key solutions for optimizing fiber optic networks. These advancements not only increase transmission speed and reliability but also simplify cabling systems, offering more efficient solutions for data…
Fiber Optic Ring for Fiber Optic Gyro Market Research Report | Valuates Reports
Fiber Optic Ring for Fiber Optic Gyro Market Research Report | Valuates Reports
Fiber Optic Ring for Fiber Optic Gyro is the fiber optic ring applied to fiber optic gyroscope manufacturing.
The global Fiber Optic Ring for Fiber Optic Gyro market was valued at US$ million in 2023 and is anticipated to reach US$ million by 2030, witnessing a CAGR of % during the forecast period 2024-2030.
North American market for Fiber Optic…
Fiber optic adhesives glue for fiber optic cable assembly and their benefits
Fiber optic adhesives glue for fiber optic cable assembly and their benefits
Adhesives for fiber optic are an important part of the whole system as they play a very integral role. These adhesives can act as coatings and sealants in fiber optic devices. Some of the most common applications of adhesives for fiber optics include:
Handling Vgroove types of assemblies
Field and splices repairs
Bonding the fiber optic bundles to ferrules
Potting the fiber optic…
Global fiber optic connectivity market | fibre broadband, fiber internet, fiber …
In order to study the various trends and patterns prevailing in the concerned market, Market Research Reports Search Engine (MRRSE) has included a new report titled “Global Fiber Optic Connectivity Market” to its wide online database. This research assessment offers a clear insight about the influential factors that are expected to transform the global market in the near future.
The fiber optic connectivity market report provides analysis for the period 2016…
Global Presents Fiber-optic Filters Market Growth and Forecast 2018 to 2028(Segm …
Fiber-optic filters market: Market Overview
Due to increasing reliance of organizations on IT (Information Technology), the demand for robust, agile and cost effective IT infrastructure is growing rapidly. The fabric-optic filter market is expanding rapidly as the telecom service providers in this modern era are moving towards fiber-based networking services. Increasing advancements in telecom industry is one of the major factors driving the growth of the fiber-optic filter market worldwide. Furthermore,…
Fiber-optic couplers Market Segmentation By Type Y Fiber-optic Couplers, T Fiber …
Fiber-optic couplers market: Market Overview
Due to increasing reliance of organizations on IT, the demand for robust, agile and cost effective IT infrastructure is growing rapidly and supporting the Fiber-optic couplers market. The fabric-optic couplers market is expanding rapidly as the telecom services providers in this modern era are moving towards fiber based networking services. Increasing advancements in the telecom industry are one of the major factors driving the growth of…
