Press release
5G Infrastructure Market o Garner $58,174.6 Million - Competitive Analysis of Leading Market Players - AT&T, Ericsson, Huawei Technologies Co., Ltd., Hewlett Packard Enterprise (HPE), Intel Corporation, Mediatek Inc, Nokia Corporation, Qualcomm Technologi
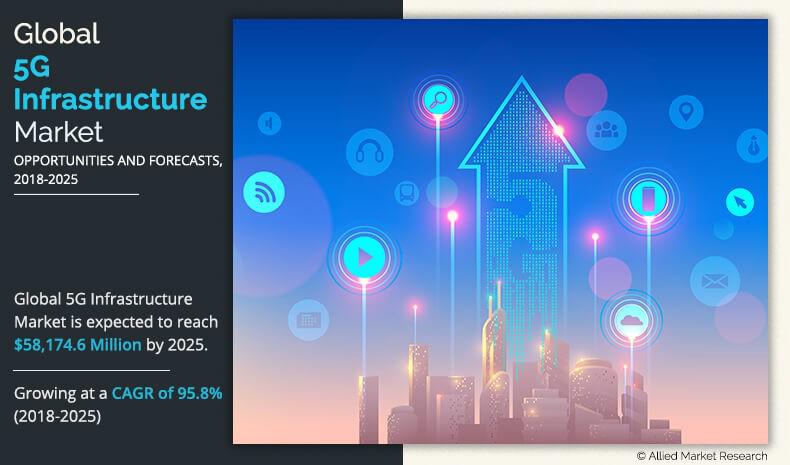
5G Infrastructure Market
Download PDF Report Sample @ https://www.alliedmarketresearch.com/request-sample/5196?utm_source=OPR
Growing penetration M2M/IoT connections and surge in demand for mobile broadband services drive the global 5G infrastructure market. However, huge initial investment, implementation challenges regarding technology & infrastructure, and increase in security and privacy concerns limit the market growth. On the other hand, increase in government initiatives for building smart cities in emerging economies create new pathways in the industry.
Based on communication infrastructure, the small cell segment contributed nearly two-fifths of the total market share in 2017 and will maintain its dominance by 2025. This is due to surge in demand for mobile broadband service and its ability to efficiently offer high-speed broadband. However, the radio access network segment would grow at the highest CAGR of 108.0% during the forecast period, 2018–2025, owing to its evolution and support for multiple-input, multiple-output (MIMO) antennas, multi-band carrier aggregation, large spectrum bandwidths, and Distributed Antenna System.
Based on chipset type, ASIC held the major share in 2017, accounting for nearly half of the total market share and is expected to maintain its leadership status by 2025. This is due to increase in demand for custom chips. On the other hand, FPGA is expected to register the highest growth rate with a CAGR of 109.6% from 2018 to 2025, owing to its reprogramming characteristics that led to wide adoption.
According to report Asia-Pacific accounted for more than one-third of the total share in 2017 and will maintain its dominant position by 2025, owing to huge adoption of smart technologies in the region. However, LAMEA is expected to grow at the highest rate, with a CAGR of 119.4% from 2018 to 2025, owing to high rate of adoption of advanced systems and solutions in different industry verticals in the region.
Buy Now at 20% Discount: https://www.alliedmarketresearch.com/checkout/349377?utm_source=OPR
Leading market players analyzed in the report include AT&T, Huawei Technologies Co., Ltd., Ericsson, Intel Corporation, Hewlett Packard Enterprise (HPE), Nokia Corporation, Mediatek Inc., Samsung Electronics Co. Ltd., Qualcomm Technologies, Inc., and Verizon.
LIST OF FIGURES
FIGURE 01. KEY MARKET SEGMENTS
FIGURE 02. EXECUTIVE SUMMARY
FIGURE 03. EXECUTIVE SUMMARY
FIGURE 04. EXECUTIVE SUMMARY
FIGURE 05. EXECUTIVE SUMMARY
FIGURE 06. EXECUTIVE SUMMARY
FIGURE 07. TOP IMPACTING FACTORS
FIGURE 08. TOP INVESTMENT POCKETS
FIGURE 09. TOP WINNING STRATEGIES, BY YEAR, 20162019*
FIGURE 10. TOP WINNING STRATEGIES, BY YEAR, 20162019*
FIGURE 11. TOP WINNING STRATEGIES, BY COMPANY, 20162019*
FIGURE 12. MODERATE-TO-HIGH BARGAINING POWER OF SUPPLIERS
FIGURE 13. MODERATE-TO-HIGH THREAT OF NEW ENTRANTS
FIGURE 14. MODERATE THREAT OF SUBSTITUTES
FIGURE 15. HIGH-TO-MODERATE INTENSITY OF RIVALRY
FIGURE 16. HIGH-TO-MODERATE BARGAINING POWER OF BUYERS
FIGURE 17. MARKET SHARE ANALYSIS (2017)
FIGURE 18. GLOBAL 5G INFRASTRUCTURE MARKET SHARE, BY COMMUNICATION INFRASTRUCTURE, 20172025 (%)
FIGURE 19. COMPARATIVE SHARE ANALYSIS OF GLOBAL 5G INFRASTRUCTURE MARKET FOR SMALL CELL, BY COUNTRY, 2017 & 2025 (%)
FIGURE 20. COMPARATIVE SHARE ANALYSIS OF GLOBAL 5G INFRASTRUCTURE MARKET FOR MACRO CELL, BY COUNTRY, 2017 & 2025 (%)
FIGURE 21. COMPARATIVE SHARE ANALYSIS OF GLOBAL 5G INFRASTRUCTURE MARKET FOR RADIO ACCESS NETWORK, BY COUNTRY, 2017 & 2025 (%)
FIGURE 22. COMPARATIVE SHARE ANALYSIS OF GLOBAL 5G INFRASTRUCTURE MARKET FOR DISTRIBUTED ANTENNA SYSTEM, BY COUNTRY, 2017 & 2025 (%)
FIGURE 23. GLOBAL 5G INFRASTRUCTURE MARKET SHARE, BY CHIPSET TYPE, 20172025 (%)
FIGURE 24. COMPARATIVE SHARE ANALYSIS OF GLOBAL 5G INFRASTRUCTURE MARKET FOR SOFTWARE DEFINED NETWORKING & NETWORK FUNCTION VIRTUALIZATION, BY COUNTRY, 2017 & 2025 (%)
FIGURE 25. COMPARATIVE SHARE ANALYSIS OF GLOBAL 5G INFRASTRUCTURE MARKET FOR MOBILE EDGE COMPUTING, BY COUNTRY, 2017 & 2025 (%)
FIGURE 26. COMPARATIVE SHARE ANALYSIS OF GLOBAL 5G INFRASTRUCTURE MARKET FOR FOG COMPUTING, BY COUNTRY, 2017 & 2025 (%)
FIGURE 27. GLOBAL 5G INFRASTRUCTURE MARKET SHARE, BY CHIPSET TYPE, 20172025 (%)
FIGURE 28. COMPARATIVE SHARE ANALYSIS OF GLOBAL 5G INFRASTRUCTURE MARKET FOR ASIC, BY COUNTRY, 2017 & 2025 (%)
FIGURE 29. COMPARATIVE SHARE ANALYSIS OF GLOBAL 5G INFRASTRUCTURE MARKET FOR RFIC, BY COUNTRY, 2017 & 2025 (%)
FIGURE 30. COMPARATIVE SHARE ANALYSIS OF GLOBAL 5G INFRASTRUCTURE MARKET FOR MMWAVE TECHNOLOGY CHIPS, BY COUNTRY, 2017 & 2025 (%)
FIGURE 31. COMPARATIVE SHARE ANALYSIS OF GLOBAL 5G INFRASTRUCTURE MARKET FOR FPGA, BY COUNTRY, 2017 & 2025 (%)
FIGURE 32. GLOBAL 5G INFRASTRUCTURE MARKET SHARE, BY APPLICATION, 20172025 (%)
FIGURE 33. COMPARATIVE SHARE ANALYSIS OF GLOBAL 5G INFRASTRUCTURE MARKET FOR AUTOMOTIVE, BY COUNTRY, 2017 & 2025 (%)
FIGURE 34. COMPARATIVE SHARE ANALYSIS OF GLOBAL 5G INFRASTRUCTURE MARKET FOR ENERGY & UTILITIES, BY COUNTRY, 2017 & 2025 (%)
FIGURE 35. COMPARATIVE SHARE ANALYSIS OF GLOBAL 5G INFRASTRUCTURE MARKET FOR HEALTHCARE, BY COUNTRY, 2017 & 2025 (%)
FIGURE 36. COMPARATIVE SHARE ANALYSIS OF GLOBAL 5G INFRASTRUCTURE MARKET FOR RETAIL, BY COUNTRY, 2017 & 2025 (%)
FIGURE 37. COMPARATIVE SHARE ANALYSIS OF GLOBAL 5G INFRASTRUCTURE MARKET FOR OTHERS, BY COUNTRY, 2017 & 2025 (%)
FIGURE 38. 5G INFRASTRUCTURE MARKET, BY REGION, 2017-2025 (%)
FIGURE 39. COMPARATIVE SHARE ANALYSIS OF 5G INFRASTRUCTURE MARKET, BY COUNTRY, 20172025 (%)
FIGURE 40. U. S. 5G INFRASTRUCTURE MARKET, 20172025 ($MILLION)
FIGURE 41. CANADA 5G INFRASTRUCTURE MARKET, 20172025 ($MILLION)
FIGURE 42. MEXICO 5G INFRASTRUCTURE MARKET, 20172025 ($MILLION)
FIGURE 43. COMPARATIVE SHARE ANALYSIS OF 5G INFRASTRUCTURE MARKET, BY COUNTRY, 20172025 (%)
FIGURE 44. U.K. 5G INFRASTRUCTURE MARKET, 20172025 ($MILLION)
FIGURE 45. GERMANY 5G INFRASTRUCTURE MARKET, 20172025 ($MILLION)
FIGURE 46. FRANCE 5G INFRASTRUCTURE MARKET, 20172025 ($MILLION)
FIGURE 47. RUSSIA 5G INFRASTRUCTURE MARKET, 20172025 ($MILLION)
FIGURE 48. REST OF EUROPE 5G INFRASTRUCTURE MARKET, 20172025 ($MILLION)
FIGURE 49. COMPARATIVE SHARE ANALYSIS OF 5G INFRASTRUCTURE MARKET, BY COUNTRY, 20172025 (%)
FIGURE 50. CHINA 5G INFRASTRUCTURE MARKET, 20172025 ($MILLION)
FIGURE 51. JAPAN 5G INFRASTRUCTURE MARKET, 20172025 ($MILLION)
FIGURE 52. INDIA 5G INFRASTRUCTURE MARKET, 20172025 ($MILLION)
FIGURE 53. SOUTH KOREA 5G INFRASTRUCTURE MARKET, 20172025 ($MILLION)
FIGURE 54. REST OF ASIA-PACIFIC 5G INFRASTRUCTURE MARKET, 20172025 ($MILLION)
FIGURE 55. COMPARATIVE SHARE ANALYSIS OF 5G INFRASTRUCTURE MARKET, BY COUNTRY, 20172025 (%)
FIGURE 56. LATIN AMERICA 5G INFRASTRUCTURE MARKET, 20172025 ($MILLION)
FIGURE 57. MIDDLE EAST 5G INFRASTRUCTURE MARKET, 20172025 ($MILLION)
FIGURE 58. AFRICA 5G INFRASTRUCTURE MARKET, 20172025 ($MILLION)
FIGURE 59. AETHON (ST ENGINEERING LTD): REVENUE, 20152017 ($MILLION)
FIGURE 60. AETHON (ST ENGINEERING LTD): REVENUE SHARE BY SEGMENT, 2017 (%)
FIGURE 61. AETHON (ST ENGINEERING LTD): REVENUE SHARE BY REGION, 2017 (%)
FIGURE 62. KUKA AG: REVENUE, 20152017 ($MILLION)
FIGURE 63. KUKA AG: REVENUE SHARE BY SEGMENT, 2017 (%)
FIGURE 64. KUKA AG: REVENUE SHARE BY REGION, 2017 (%)
FIGURE 65. MOBILE INDUSTRIAL ROBOTS APS (TERADYNE, INC.): REVENUE, 20152017 ($MILLION)
FIGURE 66. MOBILE INDUSTRIAL ROBOTS APS (TERADYNE, INC.): REVENUE SHARE BY SEGMENT, 2017 (%)
FIGURE 67. MOBILE INDUSTRIAL ROBOTS APS (TERADYNE, INC.): REVENUE SHARE BY REGION, 2017 (%)
FIGURE 68. OMRON ADEPT TECHNOLOGIES, INC. (OMRON CORPORATION): REVENUE, 20162018 ($MILLION)
FIGURE 69. OMRON ADEPT TECHNOLOGIES, INC. (OMRON CORPORATION): REVENUE SHARE BY SEGMENT, 2018 (%)
FIGURE 70. OMRON ADEPT TECHNOLOGIES, INC. (OMRON CORPORATION): REVENUE SHARE BY REGION, 2018 (%)
Make a purchase enquiry @ https://www.alliedmarketresearch.com/purchase-enquiry/5196?utm_source=OPR
About Us
Allied Market Research (AMR) is a full-service market research and business-consulting wing of Allied Analytics LLP based in Portland, Oregon. Allied Market Research provides global enterprises as well as medium and small businesses with unmatched quality of "Market Research Reports" and "Business Intelligence Solutions.” AMR has a targeted view to provide business insights and consulting to assist its clients to make strategic business decisions and achieve sustainable growth in their respective market domain.
We are in professional corporate relations with various companies and this helps us in digging out market data that helps us generate accurate research data tables and confirms utmost accuracy in our market forecasting. Each and every data presented in the reports published by us is extracted through primary interviews with top officials from leading companies of domain concerned. Our secondary data procurement methodology includes deep online and offline research and discussion with knowledgeable professionals and analysts in the industry.
Contact:
David Correa
5933 NE Win Sivers Drive
#205, Portland, OR 97220
United States
Toll Free (USA/Canada):
+1-800-792-5285, +1-503-894-6022, +1-503-446-1141
UK: +44-845-528-1300
Hong Kong: +852-301-84916
India (Pune): +91-20-66346060
Fax: +1?855?550-5975
help@alliedmarketresearch.com
Web: https://www.alliedmarketresearch.com
This release was published on openPR.
Permanent link to this press release:
Copy
Please set a link in the press area of your homepage to this press release on openPR. openPR disclaims liability for any content contained in this release.
You can edit or delete your press release 5G Infrastructure Market o Garner $58,174.6 Million - Competitive Analysis of Leading Market Players - AT&T, Ericsson, Huawei Technologies Co., Ltd., Hewlett Packard Enterprise (HPE), Intel Corporation, Mediatek Inc, Nokia Corporation, Qualcomm Technologi here
News-ID: 1678206 • Views: …
More Releases from Allied Market Research
Peanut Oil Market to garner $15,684.70 million by 2032, registering at a CAGR of …
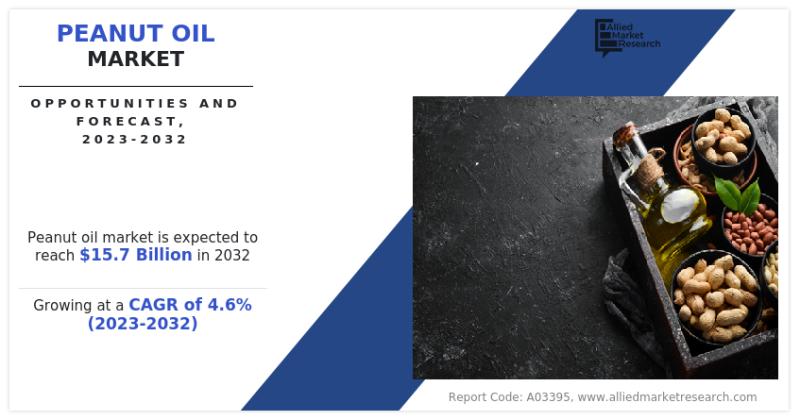
Peanut oil market size was valued at $10,099.80 million in 2022 and is projected to reach $15,684.70 million by 2032, registering a CAGR of 4.6% from 2023 to 2032.
As the cost of living continues to rise, consumer lifestyles are evolving leading to a noticeable trend toward hosting and dining at home rather than going out. This shift is playing a key role in increasing the demand for peanut oil. Peanut…
Global Sandwich Panels Market to Generate $39.16 Billion by 2031: Dana Group, 3A …
According to the report published by Allied Market Research, the global sandwich panels market garnered $20.21 billion in 2021, and is estimated to generate $39.16 billion by 2031, manifesting a CAGR of 6.7% from 2022 to 2031. The report provides an extensive analysis of changing market dynamics, major segments, value chain, competitive scenario, and regional landscape. This research offers a valuable guidance to leading players, investors, shareholders, and startups in…
Brushless DC Motor Market to Reach $72.24 Billion by 2030, Growing at 8.1% CAGR …
Allied Market Research recently published a report, titled, "Brushless DC Motors Market by Rotor type (Inner Rotor, Outer Rotor), by Power range (0-750 W, 751 W- 3 KW, More Than 3 KW), by Speed (Less Than 500 RPM, 501 To 2000 RPM, 2001 To 10,000 RPM, More Than 10,000 RPM), by End user (Industrial Machinery, Automotive, Healthcare, HVAC Industry, Power tools, Others): Global Opportunity Analysis and Industry Forecast, 2020-2030". As…
Service Robotics Market to Reach $293.0 Billion, Globally, by 2032 at 24.3% CAGR …
Allied Market Research published a report, titled, "Service Robotics Market by Type (Professional Service Robotics, and Personal Service Robotics), and Application (Agriculture, Professional Cleaning, Inspection and Maintenance, Construction and Demolition, Transportation and Logistics, Medical, Search, Rescue, And Security, Hospitality, and Others): Global Opportunity Analysis and Industry Forecast, 2023-2032.". According to the report, the global service robotics industry generated $21.0 billion in 2020, and is anticipated to generate $293.0 billion by…
More Releases for FIGURE
PVC Figure And Garage Kits Market Size Analysis by Application, Type, and Region …
According to Market Research Intellect, the global PVC Figure And Garage Kits market under the Internet, Communication and Technology category is expected to register notable growth from 2025 to 2032. Key drivers such as advancing technologies, changing consumer behavior, and evolving market dynamics are poised to shape the trajectory of this market throughout the forecast period.
The PVC Figure and Garage Kits market is witnessing substantial growth due to the rising…
Elevating Ice Performance with Premium Figure Skates
The latest collection of figure skates from Figure Skating Store is setting a new standard in ice skating performance.
Designed to meet the needs of skaters at every level, these skates combine advanced technology with expert craftsmanship to enhance every move on the ice.
Key Features of the New Figure Skates
* High-Performance Blades: Precision-engineered stainless steel blades deliver smooth glides, sharp turns, and dependable edge retention.
* Optimized Comfort: Memory foam…
Enhanced Performance with Advanced Figure Skates Technology
For athletes, enthusiasts, and professionals in the world of figure skating, achieving the perfect glide, spin, and jump is about precision and excellence. The latest advancements in figure skates are transforming performance on the ice, providing skaters with cutting-edge technology, unmatched comfort, and unparalleled durability.
Designed for both beginners and elite-level skaters, modern figure skates [https://figureskatingstore.com/skates/] combine innovative materials and engineering to deliver superior support and flexibility. Key features include:
Enhanced Blade…
Enhance Performance with Exquisite Figure Skating Dresses
As figure skating enthusiasts gear up for another exciting season, the importance of elegant and functional figure skating dresses cannot be overstated. These dresses not only enhance a skater's performance but also reflect their unique style and grace on the ice.
Unveiling the Essence of Figure Skating Dresses
Figure skating dresses [https://figureskatingstore.com/dresses/] are more than just attire; they are an extension of a skater's artistry and skill. Designed to blend aesthetics with…
Alexander Estrada Launches Transformative Online Course To Help Barbers Scale Th …
Alexander Estrada launches online course to help barbers scale their businesses to multi 6-figure to7-figure success
Image: https://www.getnews.info/uploads/a07459953886d22459dd28e62253e44b.png
San Clemente, CA - Alexander Estrada, a renowned name in the local barbering community, is set to expand his influence beyond the barber chair. With two highly successful barbershops in San Clemente and Mission Viejo, Estrada's journey from a modest beginning in his mother's garage to becoming a celebrated entrepreneur serves as a beacon…
THE WORLD'S MOST CONTROVERSIAL ACTION FIGURE...EVER!
FOR IMMEDIATE RELEASE
THE WORLD'S MOST CONTROVERSIAL ACTION FIGURE...EVER!
Contact: William Hirsch - Schlock Toys @ +1-949-677-9353 or DocSchlock@SchlockToys.com
Featured on Tomi with Fox News host Tomi Lahren! SCHLOCK TOYS join forces with Kickstarter to Make Toys Great Again!
The Kickstarter campaign page can be found HERE: https://www.kickstarter.com/projects/schlocktoys/collectors-edition-talking-trump-2020-man-of-action-figure/description
“What a great message to be sent, and I think Trump himself would love this and that he’d be excited about it!”
- Tomi Lahren, Fox News
“You…
