Press release
NGS Data Analysis Market Value Share, Supply Demand, share and Value Chain 2018-2028

NGS Data Analysis
North America to Remain Largest Market for NGS Data Analysis
North America is home to several well-established organizations of NGS data analysis. A significant number of NGS research projects are being carried out in Canadian universities, which in turn has resulted into huge demand for NGS data analysis, thereby affecting the revenue growth in the region. North America is set to remain the fastest-expanding and largest market for NGS data analysis.
Asia-Pacific excluding Japan will also record an impressive expansion in the market through 2026, mainly driven by rising number of research grants related to sequencing projects in its developing nations such as China and India. Incorporation of high-throughput screening encouraged by positive research & development outcomes in the region will further drive the market growth in APEJ.
Request Sample Report @ https://www.factmr.com/connectus/sample?flag=S&rep_id=505
Of all end-users in the global NGS data analysis market, academic research institutes are projected to account for the largest market revenue share during 2017 to 2026. Dominance of academic research institutes in the market can be attributed to robust utilization of high-throughput sequencing in university-based and academic research projects.
Key Research Findings from the Report
Sequencing by synthesis (SBS) technology will remain the most preferred technique for NGS data analysis globally
Exome sequencing is anticipated to endure as the largest revenue contributing service type segment in the market
Competition Tracking
Major companies providing the NGS data analysis solutions have been undertaking strategic collaborations & partnerships, in a bid to increase their existing product portfolios, meanwhile maintaining a competitive edge in the market. These collaborations & partnerships are primarily focused at developing feasible infrastructure solutions for enabling researchers in performing a population-scale genomic analysis. Key market participants supporting growth of the global NGS data analysis market include ABM, Inc., Agilent Technologies, Biomatters, Ltd, DNAnexus, Dovetail Genomics, LLC, Edge Biosystems, Genestack, Illumina, and Roche.
Continual advancements in data integration & cloud computing solutions have effectively helped in addressing the data-handling bottlenecks, which involves analyzing large high-throughput sequence data. Such technological advancements in the field of bioinformatics are anticipated to offer promising avenues for this vertical, in turn driving demand for NGS data analysis in the foreseeable future.
Browse Full Report @ https://www.factmr.com/report/505/ngs-data-analysis-market
There has been a rise in demand for rapid and accurate sequence interpretation tools and algorithms for expediting data analysis, with the emergence of NGS solutions along with their surging employment in genomics research, personalized treatment of various ailments, and clinical diagnosis. Additionally, scope of sequencing projects is set to expand on the back of concurrent fall in cost of sequencing and high genetic data output, which in turn will fuel demand for elaborate bioinformatics pipeline incorporating efficient and sophisticated solutions. Narrowing the difference between sequence processing and generation, the trend of substituting local computing software with the cloud-based computing databases is being increasingly employed by researchers in the healthcare sector. Existing challenges concerning biological interpretation of output genomic data will direct research efforts toward the development of precise healthcare data analytical tools, thereby driving the market growth in the near future.
However, infrastructural investments required for the development of algorithms & software will keep the market growth in check. NGS data analysis solutions have been deemed time consuming, and have been witnessing a confined adoption since the recent past. Commercial service providers have lucrative opportunities in the design and development of novel solutions to offer faster turnaround times.
Speak To Research Analyst for Detailed Insights @ https://www.factmr.com/connectus/sample?flag=AE&rep_id=505
Table of Contents Covered in the report are:
1. Global Economic Outlook
2. Global NGS Data Analysis Market - Executive Summary
3. Global NGS Data Analysis Market Overview
3.1. Introduction
3.1.1. Global NGS Data Analysis Market Taxonomy
3.1.2. Global NGS Data Analysis Market Definition
3.2. Global NGS Data Analysis Market Size (US$ Mn) and Forecast, 2012-2026
3.2.1. Global NGS Data Analysis Market Y-o-Y Growth
3.3. Global NGS Data Analysis Market Dynamics
3.4. Supply Chain
3.5. PEST Analysis
3.6. Market Positioning and Behaviour Assessment
3.7. Market Competition Structure
3.8. Porter's Five Factors
3.9. Sequencing Cost and Data Output Since 2000
3.10. Human Genome Sequencing Over the Decades
3.11. Next Generation Sequencing Commercial Developments
3.12. Next Generation Sequencing Clinical Research Developments
3.13. List of Service Providers
3.14. Key Participants Market Presence (Intensity Map) By Region
4. Global NGS Data Analysis Market Analysis and Forecast 2012-2026
4.1. Global NGS Data Analysis Market Size and Forecast By Service Type, 2012-2026
4.1.1. Whole-genome Sequencing Market Size and Forecast, 2012-2026
4.1.1.1. Revenue (US$ Mn) Comparison, By Region
4.1.1.2. Market Share Comparison, By Region
4.1.1.3. Y-o-Y growth Comparison, By Region
4.1.2. Exome Sequencing Market Size and Forecast, 2012-2026
4.1.2.1. Revenue (US$ Mn) Comparison, By Region
4.1.2.2. Market Share Comparison, By Region
4.1.2.3. Y-o-Y growth Comparison, By Region
4.1.3. Targeted Resequencing Market Size and Forecast, 2012-2026
4.1.3.1. Revenue (US$ Mn) Comparison, By Region
4.1.3.2. Market Share Comparison, By Region
4.1.3.3. Y-o-Y growth Comparison, By Region
4.1.4. De Novo Sequencing Market Size and Forecast, 2012-2026
4.1.4.1. Revenue (US$ Mn) Comparison, By Region
4.1.4.2. Market Share Comparison, By Region
4.1.4.3. Y-o-Y growth Comparison, By Region
4.1.5. RNA Sequencing Market Size and Forecast, 2012-2026
4.1.5.1. Revenue (US$ Mn) Comparison, By Region
4.1.5.2. Market Share Comparison, By Region
4.1.5.3. Y-o-Y growth Comparison, By Region
4.1.6. ChIP Sequencing Market Size and Forecast, 2012-2026
4.1.6.1. Revenue (US$ Mn) Comparison, By Region
4.1.6.2. Market Share Comparison, By Region
4.1.6.3. Y-o-Y growth Comparison, By Region
4.1.7. Methyl Sequencing Market Size and Forecast, 2012-2026
4.1.7.1. Revenue (US$ Mn) Comparison, By Region
4.1.7.2. Market Share Comparison, By Region
4.1.7.3. Y-o-Y growth Comparison, By Region
4.1.8. Other Services Market Size and Forecast, 2012-2026
4.1.8.1. Revenue (US$ Mn) Comparison, By Region
4.1.8.2. Market Share Comparison, By Region
4.1.8.3. Y-o-Y growth Comparison, By Region
4.2. Global NGS Data Analysis Market Size and Forecast By End User, 2012-2026
4.2.1. Hospitals Market Size and Forecast, 2012-2026
4.2.1.1. Revenue (US$ Mn) Comparison, By Region
4.2.1.2. Market Share Comparison, By Region
4.2.1.3. Y-o-Y growth Comparison, By Region
4.2.2. Academic Research Institutes Market Size and Forecast, 2012-2026
4.2.2.1. Revenue (US$ Mn) Comparison, By Region
4.2.2.2. Market Share Comparison, By Region
4.2.2.3. Y-o-Y growth Comparison, By Region
4.2.3. Diagnostics Laboratories Market Size and Forecast, 2012-2026
4.2.3.1. Revenue (US$ Mn) Comparison, By Region
4.2.3.2. Market Share Comparison, By Region
4.2.3.3. Y-o-Y growth Comparison, By Region
4.2.4. Biotechnology/Pharmaceutical Companies Market Size and Forecast, 2012-2026
4.2.4.1. Revenue (US$ Mn) Comparison, By Region
4.2.4.2. Market Share Comparison, By Region
4.2.4.3. Y-o-Y growth Comparison, By Region
4.2.5. Contract Research Organization Market Size and Forecast, 2012-2026
4.2.5.1. Revenue (US$ Mn) Comparison, By Region
4.2.5.2. Market Share Comparison, By Region
4.2.5.3. Y-o-Y growth Comparison, By Region
4.2.6. Forensic & Government Laboratories Market Size and Forecast, 2012-2026
4.2.6.1. Revenue (US$ Mn) Comparison, By Region
4.2.6.2. Market Share Comparison, By Region
4.2.6.3. Y-o-Y growth Comparison, By Region
4.3. Global NGS Data Analysis Market Size and Forecast By Technique , 2012-2026
4.3.1. Sequencing by Synthesis (SBS) Data Type Market Size and Forecast, 2012-2026
4.3.1.1. Revenue (US$ Mn) Comparison, By Region
4.3.1.2. Market Share Comparison, By Region
4.3.1.3. Y-o-Y growth Comparison, By Region
4.3.2. Real-Time (SMRT) Data Type Market Size and Forecast, 2012-2026
4.3.2.1. Revenue (US$ Mn) Comparison, By Region
4.3.2.2. Market Share Comparison, By Region
4.3.2.3. Y-o-Y growth Comparison, By Region
4.3.3. Ion semiconductor sequencing Data Type Market Size and Forecast, 2012-2026
4.3.3.1. Revenue (US$ Mn) Comparison, By Region
4.3.3.2. Market Share Comparison, By Region
4.3.3.3. Y-o-Y growth Comparison, By Region
4.3.4. Others Market Size and Forecast, 2012-2026
4.3.4.1. Revenue (US$ Mn) Comparison, By Region
4.3.4.2. Market Share Comparison, By Region
4.3.4.3. Y-o-Y growth Comparison, By Region
4.4. Global NGS Data Analysis Market Size and Forecast By Data Type, 2012-2026
4.4.1. Primary Market Size and Forecast, 2012-2026
4.4.1.1. Revenue (US$ Mn) Comparison, By Region
4.4.1.2. Market Share Comparison, By Region
4.4.1.3. Y-o-Y growth Comparison, By Region
4.4.2. Secondary Market Size and Forecast, 2012-2026
4.4.2.1. Revenue (US$ Mn) Comparison, By Region
4.4.2.2. Market Share Comparison, By Region
4.4.2.3. Y-o-Y growth Comparison, By Region
4.4.3. Tertiary Market Size and Forecast, 2012-2026
4.4.3.1. Revenue (US$ Mn) Comparison, By Region
4.4.3.2. Market Share Comparison, By Region
4.4.3.3. Y-o-Y growth Comparison, By Region
5. North America NGS Data Analysis Market Size and Forecast, 2012-2025
5.1. North America Outlook
5.2. North America Parent Market Outlook
5.3. North America Target Market Outlook
5.4. Revenue (US$ Mn) Comparison, By Country
5.4.1. US Market Size and Forecast (US$ Mn), 2012-2025
5.4.2. Canada Market Size and Forecast (US$ Mn), 2012-2025
5.5. Revenue (US$ Mn) Comparison, By Service Type
5.6. Revenue (US$ Mn) Comparison, By End User
5.7. Revenue (US$ Mn) Comparison, By Technique
5.8. Revenue (US$ Mn) Comparison, By Data Type
And Continue...
About FactMR
FactMR is a fast-growing market research firm that offers the most comprehensive suite of syndicated and customized market research reports. We believe transformative intelligence can educate and inspire businesses to make smarter decisions. We know the limitations of the one-size-fits-all approach; that's why we publish multi-industry global, regional, and country-specific research reports.
Contact Us
FactMR
11140 Rockville Pike
Suite 400
Rockville, MD 20852
United States
Email: sales@factmr.com
Web: www.factmr.com/
Follow Us on Linkedin: www.linkedin.com/company/factmr/
This release was published on openPR.
Permanent link to this press release:
Copy
Please set a link in the press area of your homepage to this press release on openPR. openPR disclaims liability for any content contained in this release.
You can edit or delete your press release NGS Data Analysis Market Value Share, Supply Demand, share and Value Chain 2018-2028 here
News-ID: 1606456 • Views: …
More Releases from Fact.MR
Snacks Market is Growing at USD 569.2 billion in 2025 | Fact.MR Report
The global snacks market is projected to grow from USD 545.2 billion in 2026 to approximately USD 835.4 billion by 2036. This growth reflects a steady compound annual growth rate (CAGR) of 4.3% over the ten-year forecast period. The market is being fundamentally reshaped by the "snackification" of meals, where busy consumers are increasingly replacing traditional breakfast, lunch, and dinner with portable, nutrient-dense snacking options.
Get Access of Report Sample: https://www.factmr.com/connectus/sample?flag=S&rep_id=50
Quick…
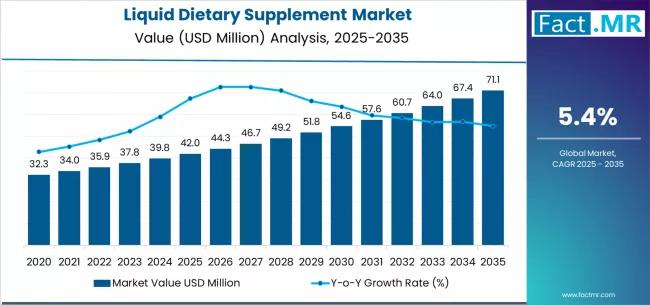
Liquid Nutritional Supplement Market Growing from USD 42.0 billion in 2025 to US …
The global liquid Nutritional supplements market is projected to grow from USD 33.25 billion in 2026 to approximately USD 45.10 billion by 2036. This growth represents a compound annual growth rate (CAGR) of 6.1% to 10.2% depending on the specific product segment (e.g., high-growth Ready-to-Drink formulations vs. traditional tonics).
The market is being primarily driven by a "pill fatigue" trend among consumers and an aging global population that increasingly prefers…
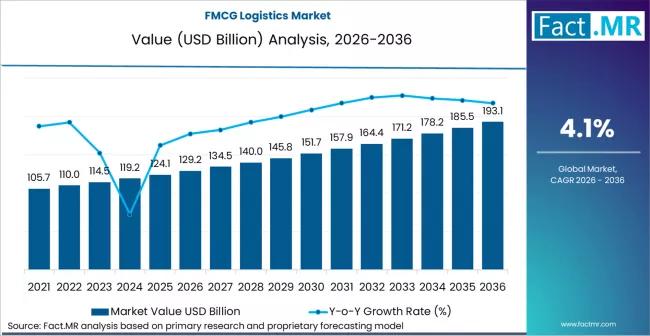
FMCG Logistics Market is Expected to Hit USD 190.5 billion by 2036 | Fact.MR Ins …
The global FMCG logistics market is projected to grow from USD 126.9 billion in 2026 to approximately USD 189.5 billion by 2036. This growth reflects a steady compound annual growth rate (CAGR) of 4.1% over the ten-year forecast period.
The market is entering a decade of transformation, shifting from a focus on cost-driven efficiency to automation-led resilience as retailers and brands navigate the complexities of quick-commerce and global supply chain…
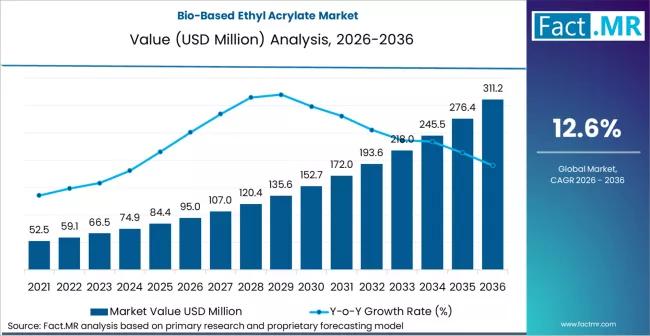
Bio-Based Ethyl Acrylate Market Forecasted CAGR of 12.6% by 2036 | Fact.MR Repor …
The global Bio-Based Ethyl Acrylate Market is projected to expand significantly over the next decade as demand for sustainable, performance-oriented monomers rises across coatings, adhesives, textiles, and specialty chemical applications. Industry analysts estimate that the market, valued at approximately USD 450 million in 2025, is expected to reach around USD 940 million by 2035, representing a compound annual growth rate (CAGR) of about 7.9% over the forecast period.
Get Access of…
More Releases for Comparison
Waveguide port - flange size comparison table
The relationship between waveguide port dimensions, flange [https://www.leader-mw.com/rf-integrated-load-dc-18ghz-with-tab-mount-20w-power-product/] sizes, and frequency bands is standardized to ensure mechanical compatibility and optimal RF performance. Below is a simplified comparison table and key principles for common rectangular waveguides and their associated flanges.
Key Concepts
1. Waveguide Designation: Waveguides are labeled with "WR" (Waveguide Rectangular) followed by a number (e.g., WR-90). The number approximates the inner broad-wall dimension in hundredths of an inch (e.g., WR-90 almost…
Polyester vs Chenille: A Detailed Comparison
Choosing between polyester and chenille can make or break your next furniture purchase, clothing investment, or home decor project. These two fabrics [https://www.yituofabrics.com/cotton-embroidery-fabric/] couldn't be more different-one prioritizes durability and easy care, while the other delivers unmatched softness and luxury.
Polyester dominates the textile industry as a synthetic workhorse that resists wrinkles, dries quickly, and costs less than most alternatives. Chenille offers the plush, velvety texture that makes blankets irresistible and…
Velvet vs Chenille: A Comprehensive Comparison
Choosing between velvet and chenille for your furniture can make or break your living space's comfort and style. These two popular upholstery fabrics might both feel soft, but they're completely different in terms of durability, maintenance, and overall vibe.
Chenille gives you that cozy, lived-in comfort that's perfect for Netflix marathons and family gatherings. Velvet delivers luxury and elegance but demands more careful treatment to keep looking its best.
Chenille
Chenille is a…
Fabric Cutting Methods: A Technical Comparison
Introduction to Cutting Technologies
Modern textile production utilizes various cutting methods, each with distinct advantages depending on application requirements. This analysis compares four primary techniques to help professionals select optimal solutions for their operations.
Laser cutting fabric has become a popular technique for creating precise, intricate designs. The process works best with materials that are stable, heat-resistant, and easy to cut. Common fabrics for laser cutting include cotton, polyester, felt, and synthetic…
STM32F vs STM32G: A Comprehensive Comparison
When it comes to embedded systems development, selecting the right microcontroller (MCU) can significantly impact the performance, power consumption, and cost-effectiveness of your project. STM32F vs STM32G ( https://www.chipmall.com/blogs/stm32f-vs-stm32g_92 ) is a common comparison in the embedded community, as both series from STMicroelectronics offer powerful solutions, but they serve different needs and use cases. The STM32F and STM32G families, both based on ARM Cortex-M cores, provide developers with a wide…
Moneybrag.com Offers Reliable Financial Comparison Services
Moneybrag.com is a leading online firm that specializes in online comparison services that enable clients to make comparisons of utility and personal finance products. Their primary goal is to provide information in an understandable format that allows for initial comparisons to be made at a glance. This enables customers to make healthy financial decisions. Moneybrag.com gives customers the ability to compare side by side and select a vendor based on…
