Press release
Global Briefing 2017 3D-Printing Medical Devices Industry Analyzer Technique, Advancements, Market Size, Share, Opportunity and Trend with Growing CAGR till 2023

3D-Printing Medical Devices
3D-printing medical devices are enabling surgeons in planning surgeries, which in turn lower the operative risks faced during complex procedures, decrease duration of anesthesia exposure, and risk of infection. This further enables patients in recovering faster, and reducing the duration of hospital stay. These factors might impact growth of the global 3D-printing medical devices market. 3D printing technology is facilitating surgeons in improving the rate of success in complicated procedures. In addition, this technology is revolutionizing preclinical drug testing by making testing convenient on 3D-printed organs, an alternative to testing of animals.
Request Sample Report @ https://www.factmr.com/connectus/sample?flag=S&rep_id=248
The advent of 3D-printed tablets has created new avenues for 3D printing technology, enhancing its application in the pharmaceutical industry. A number of collaborations are being witnessed between leading market players and academic institutions across the globe, investing extensively in research and development activities, which in turn is further influencing the market growth. However, factors such as lack of structured regulatory framework, high prices of printers, unfavorable reimbursement policies, limited technical expertise, biocompatibility issues pertaining to 3D-printed medical devices, and concerns related to copyright and patent infringement are expected to hinder the market growth in the near future.
Competition Tracking
Key market players profiled in the report include 3D Systems Corporation, Biomedical Modeling Inc., Carbon, Inc., General Electric Company, EnvisionTEC GmbH, Materialise NV, Organovo Holdings, Inc., Groupe Gorgé SA, Renishaw plc, SLM Solutions Group AG, Stratasys Ltd., and Cyfuse Biomedical K.K.
Although North America is expected to dominate the global 3D-printing medical devices market, sales of these devices in Asia-Pacific excluding Japan (APEJ) will exhibit the highest CAGR through 2022. Europe will continue to be the second largest market for 3D-printing medical devices, in terms of revenues.
Request/View Toc@ https://www.factmr.com/connectus/sample?flag=T&rep_id=248
Software & Services to be Sought-After among Products
Software & services are expected to be sought-after among products in the market, accounting for over one-third revenue share of the market during 2017 to 2022. However, sales of materials will register the fastest expansion through 2022. Hospitals are expected to be the most attractive end-users of 3D-printing medical devices, with sales expected to surpass US$ 1,000 Mn in revenues by 2022-end. Revenues from sales of 3D-printing medical devices in hospitals will account for more than half share of the market during the forecast period.
In terms of revenues, implants are anticipated to remain the largest application of 3D-printing medical devices, followed by tissue engineering. 3D-printing medical devices sales for application in external wearable devices will exhibit a relatively lower CAGR through 2022. Photo polymerization will remain the most lucrative technology for 3D-printing medical devices, followed by laser beam melting. In addition, three-dimensional printing technology, and electron beam melting technology are expected to register a parallel expansion through 2022.
Speak To Research Analyst for Detailed Insights @ https://www.factmr.com/connectus/sample?flag=AE&rep_id=248
Table of Contents Covered in this report are:
1. Global 3D-Printing Medical Devices Market - Executive Summary
2. Global 3D-Printing Medical Devices Market Overview
2.1. Introduction
2.1.1. Global 3D-Printing Medical Devices Market Taxonomy
2.1.2. Global 3D-Printing Medical Devices Market Definition
2.2. Global 3D-Printing Medical Devices Market Size (US$ Mn) and Forecast, 2012-2022
2.2.1. Global 3D-Printing Medical Devices Market Y-o-Y Growth
2.3. Global 3D-Printing Medical Devices Market Dynamics
2.4. Regulations
2.5. Supply Chain
2.6. Cost Structure
2.7. Average Pricing Analysis
2.8. List of Distributors
2.9. Key Participants Market Presence (Intensity Map) By Region
Access This Report @ https://www.factmr.com/checkout/248/S
3. Global 3D-Printing Medical Devices Market Analysis and Forecast By Product Type
3.1. Global 3D-Printing Medical Devices Market Size and Forecast By Product Type, 2012-2022
3.1.1. 3D Printers 3D-Printing Medical Devices Market Size and Forecast, 2012-2022
3.1.1.1. Revenue (US$ Mn) Comparison, By Region
3.1.1.2. Market Share Comparison, By Region
3.1.1.3. Y-o-Y growth Comparison, By Region
3.1.2. 3D Bio-Printers 3D-Printing Medical Devices Market Size and Forecast, 2012-2022
3.1.2.1. Revenue (US$ Mn) Comparison, By Region
3.1.2.2. Market Share Comparison, By Region
3.1.2.3. Y-o-Y growth Comparison, By Region
3.1.3. Materials 3D-Printing Medical Devices Market Size and Forecast, 2012-2022
3.1.3.1. Revenue (US$ Mn) Comparison, By Region
3.1.3.2. Market Share Comparison, By Region
3.1.3.3. Y-o-Y growth Comparison, By Region
3.1.4. Software & Services 3D-Printing Medical Devices Market Size and Forecast, 2012-2022
3.1.4.1. Revenue (US$ Mn) Comparison, By Region
3.1.4.2. Market Share Comparison, By Region
3.1.4.3. Y-o-Y growth Comparison, By Region
4. Global 3D-Printing Medical Devices Market Analysis and Forecast By End User
4.1. Global 3D-Printing Medical Devices Market Size and Forecast By End User, 2012-2022
4.1.1. Hospitals 3D-Printing Medical Devices Market Size and Forecast, 2012-2022
4.1.1.1. Revenue (US$ Mn) Comparison, By Region
4.1.1.2. Market Share Comparison, By Region
4.1.1.3. Y-o-Y growth Comparison, By Region
4.1.2. Academic Institutes 3D-Printing Medical Devices Market Size and Forecast, 2012-2022
4.1.2.1. Revenue (US$ Mn) Comparison, By Region
4.1.2.2. Market Share Comparison, By Region
4.1.2.3. Y-o-Y growth Comparison, By Region
4.1.3. Contract Research Organizations 3D-Printing Medical Devices Market Size and Forecast, 2012-2022
4.1.3.1. Revenue (US$ Mn) Comparison, By Region
4.1.3.2. Market Share Comparison, By Region
4.1.3.3. Y-o-Y growth Comparison, By Region
4.1.4. Pharma and Biotech Companies 3D-Printing Medical Devices Market Size and Forecast, 2012-2022
4.1.4.1. Revenue (US$ Mn) Comparison, By Region
4.1.4.2. Market Share Comparison, By Region
4.1.4.3. Y-o-Y growth Comparison, By Region
5. Global 3D-Printing Medical Devices Market Analysis and Forecast By Application
5.1. Global 3D-Printing Medical Devices Market Size and Forecast By Application, 2012-2022
5.1.1. Implants 3D-Printing Medical Devices Market Size and Forecast, 2012-2022
5.1.1.1. Revenue (US$ Mn) Comparison, By Region
5.1.1.2. Market Share Comparison, By Region
5.1.1.3. Y-o-Y growth Comparison, By Region
5.1.2. Tissue Engineering 3D-Printing Medical Devices Market Size and Forecast, 2012-2022
5.1.2.1. Revenue (US$ Mn) Comparison, By Region
5.1.2.2. Market Share Comparison, By Region
5.1.2.3. Y-o-Y growth Comparison, By Region
5.1.3. External Wearable Devices 3D-Printing Medical Devices Market Size and Forecast, 2012-2022
5.1.3.1. Revenue (US$ Mn) Comparison, By Region
5.1.3.2. Market Share Comparison, By Region
5.1.3.3. Y-o-Y growth Comparison, By Region
6. Global 3D-Printing Medical Devices Market Analysis and Forecast By Technology
6.1. Global 3D-Printing Medical Devices Market Size and Forecast By Technology, 2012-2022
6.1.1. Laser Beam Melting 3D-Printing Medical Devices Market Size and Forecast, 2012-2022
6.1.1.1. Revenue (US$ Mn) Comparison, By Region
6.1.1.2. Market Share Comparison, By Region
6.1.1.3. Y-o-Y growth Comparison, By Region
6.1.2. Photopolymerization 3D-Printing Medical Devices Market Size and Forecast, 2012-2022
6.1.2.1. Revenue (US$ Mn) Comparison, By Region
6.1.2.2. Market Share Comparison, By Region
6.1.2.3. Y-o-Y growth Comparison, By Region
6.1.3. Three-Dimensional Printing 3D-Printing Medical Devices Market Size and Forecast, 2012-2022
6.1.3.1. Revenue (US$ Mn) Comparison, By Region
6.1.3.2. Market Share Comparison, By Region
6.1.3.3. Y-o-Y growth Comparison, By Region
6.1.4. Electron Beam Melting 3D-Printing Medical Devices Market Size and Forecast, 2012-2022
6.1.4.1. Revenue (US$ Mn) Comparison, By Region
6.1.4.2. Market Share Comparison, By Region
6.1.4.3. Y-o-Y growth Comparison, By Region
6.1.5. Droplet Deposition 3D-Printing Medical Devices Market Size and Forecast, 2012-2022
6.1.5.1. Revenue (US$ Mn) Comparison, By Region
6.1.5.2. Market Share Comparison, By Region
6.1.5.3. Y-o-Y growth Comparison, By Region
7. Global 3D-Printing Medical Devices Market Analysis and Forecast By Region
7.1. Global 3D-Printing Medical Devices Market Size and Forecast, 2012-2022
7.1.1. North America 3D-Printing Medical Devices Market Size and Forecast, 2012-2022
7.1.1.1. Revenue (US$ Mn) Comparison, By Product Type
7.1.1.2. Revenue (US$ Mn) Comparison, By End User
7.1.1.3. Revenue (US$ Mn) Comparison, By Application
7.1.1.4. Revenue (US$ Mn) Comparison, By Technology
7.1.2. Latin America 3D-Printing Medical Devices Market Size and Forecast, 2012-2022
7.1.2.1. Revenue (US$ Mn) Comparison, By Product Type
7.1.2.2. Revenue (US$ Mn) Comparison, By End User
7.1.2.3. Revenue (US$ Mn) Comparison, By Application
7.1.2.4. Revenue (US$ Mn) Comparison, By Technology
7.1.3. Europe 3D-Printing Medical Devices Market Size and Forecast, 2012-2022
7.1.3.1. Revenue (US$ Mn) Comparison, By Product Type
7.1.3.2. Revenue (US$ Mn) Comparison, By End User
7.1.3.3. Revenue (US$ Mn) Comparison, By Application
7.1.3.4. Revenue (US$ Mn) Comparison, By Technology
7.1.4. Japan 3D-Printing Medical Devices Market Size and Forecast, 2012-2022
7.1.4.1. Revenue (US$ Mn) Comparison, By Product Type
7.1.4.2. Revenue (US$ Mn) Comparison, By End User
7.1.4.3. Revenue (US$ Mn) Comparison, By Application
7.1.4.4. Revenue (US$ Mn) Comparison, By Technology
7.1.5. APEJ 3D-Printing Medical Devices Market Size and Forecast, 2012-2022
7.1.5.1. Revenue (US$ Mn) Comparison, By Product Type
7.1.5.2. Revenue (US$ Mn) Comparison, By End User
7.1.5.3. Revenue (US$ Mn) Comparison, By Application
7.1.5.4. Revenue (US$ Mn) Comparison, By Technology
7.1.6. MEA 3D-Printing Medical Devices Market Size and Forecast, 2012-2022
7.1.6.1. Revenue (US$ Mn) Comparison, By Product Type
7.1.6.2. Revenue (US$ Mn) Comparison, By End User
7.1.6.3. Revenue (US$ Mn) Comparison, By Application
7.1.6.4. Revenue (US$ Mn) Comparison, By Technology
8. North America 3D-Printing Medical Devices Market Analysis and Forecast, By Country, 2012-2022
8.1. US 3D-Printing Medical Devices Market Size and Forecast, 2012-2022
8.1.1. Revenue (US$ Mn) Comparison, By Product Type
8.1.2. Revenue (US$ Mn) Comparison, By End User
8.1.3. Revenue (US$ Mn) Comparison, By Application
8.1.4. Revenue (US$ Mn) Comparison, By Technology
8.2. Canada 3D-Printing Medical Devices Market Size and Forecast, 2012-2022
8.2.1. Revenue (US$ Mn) Comparison, By Product Type
8.2.2. Revenue (US$ Mn) Comparison, By End User
8.2.3. Revenue (US$ Mn) Comparison, By Application
8.2.4. Revenue (US$ Mn) Comparison, By Technology
9. Latin America 3D-Printing Medical Devices Market Analysis and Forecast, By Country, 2012-2022
9.1. Brazil 3D-Printing Medical Devices Market Size and Forecast, 2012-2022
9.1.1. Revenue (US$ Mn) Comparison, By Product Type
9.1.2. Revenue (US$ Mn) Comparison, By End User
9.1.3. Revenue (US$ Mn) Comparison, By Application
9.1.4. Revenue (US$ Mn) Comparison, By Technology
9.2. Mexico 3D-Printing Medical Devices Market Size and Forecast, 2012-2022
9.2.1. Revenue (US$ Mn) Comparison, By Product Type
9.2.2. Revenue (US$ Mn) Comparison, By End User
9.2.3. Revenue (US$ Mn) Comparison, By Application
9.2.4. Revenue (US$ Mn) Comparison, By Technology
9.3. Argentina 3D-Printing Medical Devices Market Size and Forecast, 2012-2022
9.3.1. Revenue (US$ Mn) Comparison, By Product Type
9.3.2. Revenue (US$ Mn) Comparison, By End User
9.3.3. Revenue (US$ Mn) Comparison, By Application
9.3.4. Revenue (US$ Mn) Comparison, By Technology
About FactMR
FactMR is a fast-growing market research firm that offers the most comprehensive suite of syndicated and customized market research reports. We believe transformative intelligence can educate and inspire businesses to make smarter decisions. We know the limitations of the one-size-fits-all approach; that's why we publish multi-industry global, regional, and country-specific research reports.
Contact Us
FactMR
11140 Rockville Pike
Suite 400
Rockville, MD 20852
United States
Email: sales@factmr.com
Web: www.factmr.com/
Follow Us on Linkedin: www.linkedin.com/company/factmr/
This release was published on openPR.
Permanent link to this press release:
Copy
Please set a link in the press area of your homepage to this press release on openPR. openPR disclaims liability for any content contained in this release.
You can edit or delete your press release Global Briefing 2017 3D-Printing Medical Devices Industry Analyzer Technique, Advancements, Market Size, Share, Opportunity and Trend with Growing CAGR till 2023 here
News-ID: 1598142 • Views: …
More Releases from Fact.MR
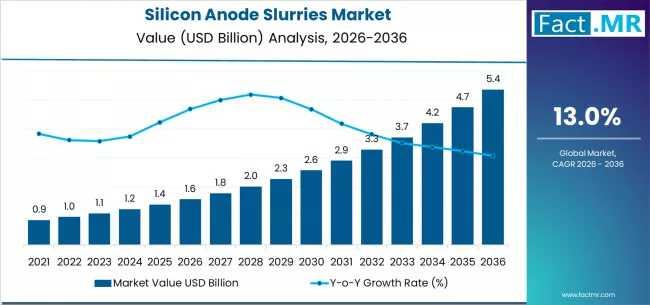
Silicon Anode Slurries Market Forecast 2026-2036: Market Size, Share, Competitiv …
The global silicon anode slurries market is set for significant expansion between 2026 and 2036, fueled by the rising adoption of high-energy-density lithium-ion batteries across electric vehicles (EVs), consumer electronics, and grid-scale energy storage. As battery manufacturers increasingly transition from graphite to silicon-enhanced anodes, the demand for high-performance, scalable silicon anode slurries is projected to grow sharply.
To access the complete data tables and in-depth insights, request a Discount On The…
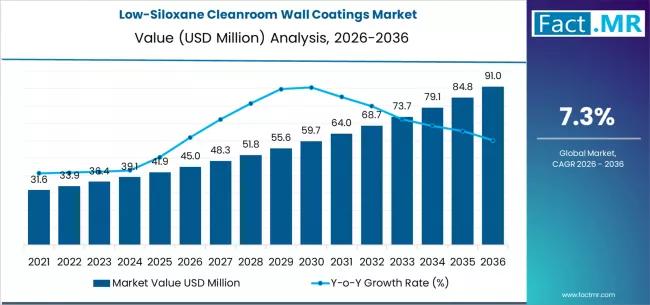
Low-Siloxane Cleanroom Wall Coatings Market Deep-Dive 2026-2036: Strategic Forec …
The low-siloxane cleanroom wall coatings market is poised for steady growth over the next decade, driven by rising contamination-control requirements across semiconductor, pharmaceutical, biotechnology, and precision manufacturing industries. These coatings are specifically engineered to minimize siloxane outgassing and volatile organic compound emissions, helping maintain ultra-clean environments where even trace contamination can disrupt production quality.
By 2036, the market for low-siloxane cleanroom wall coatings is expected to grow to USD 91.04 million.…
More Releases for Comparison
Polyester vs Chenille: A Detailed Comparison
Choosing between polyester and chenille can make or break your next furniture purchase, clothing investment, or home decor project. These two fabrics [https://www.yituofabrics.com/cotton-embroidery-fabric/] couldn't be more different-one prioritizes durability and easy care, while the other delivers unmatched softness and luxury.
Polyester dominates the textile industry as a synthetic workhorse that resists wrinkles, dries quickly, and costs less than most alternatives. Chenille offers the plush, velvety texture that makes blankets irresistible and…
Velvet vs Chenille: A Comprehensive Comparison
Choosing between velvet and chenille for your furniture can make or break your living space's comfort and style. These two popular upholstery fabrics might both feel soft, but they're completely different in terms of durability, maintenance, and overall vibe.
Chenille gives you that cozy, lived-in comfort that's perfect for Netflix marathons and family gatherings. Velvet delivers luxury and elegance but demands more careful treatment to keep looking its best.
Chenille
Chenille is a…
Fabric Cutting Methods: A Technical Comparison
Introduction to Cutting Technologies
Modern textile production utilizes various cutting methods, each with distinct advantages depending on application requirements. This analysis compares four primary techniques to help professionals select optimal solutions for their operations.
Laser cutting fabric has become a popular technique for creating precise, intricate designs. The process works best with materials that are stable, heat-resistant, and easy to cut. Common fabrics for laser cutting include cotton, polyester, felt, and synthetic…
STM32F vs STM32G: A Comprehensive Comparison
When it comes to embedded systems development, selecting the right microcontroller (MCU) can significantly impact the performance, power consumption, and cost-effectiveness of your project. STM32F vs STM32G ( https://www.chipmall.com/blogs/stm32f-vs-stm32g_92 ) is a common comparison in the embedded community, as both series from STMicroelectronics offer powerful solutions, but they serve different needs and use cases. The STM32F and STM32G families, both based on ARM Cortex-M cores, provide developers with a wide…
Moneybrag.com Offers Reliable Financial Comparison Services
Moneybrag.com is a leading online firm that specializes in online comparison services that enable clients to make comparisons of utility and personal finance products. Their primary goal is to provide information in an understandable format that allows for initial comparisons to be made at a glance. This enables customers to make healthy financial decisions. Moneybrag.com gives customers the ability to compare side by side and select a vendor based on…
Comparison of Time recording applications
With hiring remote staff and freelancers halfway around the world turning into further common, it is necessary to look out the only thanks to keep track of the hours they work. Not entirely are you able to would like to know the hours to be able to pay them at the tip of the month but together notice an easy due to manage the invoices of an entire team. If…
