Press release
Trends in the Ready To Use Blood Cancer Diagnostics Market 2018-2020

Blood Cancer Diagnostics
Fact.MR’s report offers market analysis and forecast on the global blood cancer diagnostics market on the basis of test type. Liquid biopsy is another test type that remains widely used among end-users. Studies have shown that liquid biopsy can overcome challenges related to intra- and inter-tumor heterogeneity. The research was carried out at Harvard Medical School and Massachusetts General Hospital Cancer Center. Inclusion of liquid biopsy can help in identifying resistance alternations in patients with advanced cholangiocarcinoma. On account of growing preference for liquid biopsy, this segment is projected to increase at a CAGR of over 10% through 2022.
Request Sample Report @ https://www.factmr.com/connectus/sample?flag=S&rep_id=47
According to the report, the CBC test segment type of the global blood cancer market is valued at nearly US$ 77 million in 2017. By 2022, this is projected to grow at a healthy rate. The market in North America will remain lucrative for manufacturers throughout the forecast period. The CTC tests segment on the other hand, is anticipated to grow at a relatively higher CAGR than the CBC test segments.
Owing to accuracy and convenience of blood testing protein test type, it is anticipated that more end-use sectors will continue to use this type of testing globally. Fact.MR estimates the global blood protein testing market to rake in significant revenues during the forecast period.
By end-users, hospital associated labs account for a significant percentage of the global blood cancer diagnostics market. Valued at over US$ 136 million in 2017, the hospital associated labs segment is projected to surpass US$ 180 million in revenues by 2022. Demand from hospital associated labs segment is projected to grow at a steady CAGR during the forecast period.
Request/View Toc@ https://www.factmr.com/connectus/sample?flag=T&rep_id=47
Competition Tracking
The key companies profiled in Fact.MR’s research include Abbott Laboratories, Roche Holding A.G., Thermo Fisher Scientific Inc., Laboratory Corporation of America Holdings, Luminex Corporation, Myriad Genetics Inc., NanoString Technologies Inc, NeoGenomics Laboratories, Inc., Siemens AG, Quest Diagnostics Incorporated, Qiagen N.V., Agilent Technologies, Biotheranostics, Inc, Almac Group Limited, and GeneNews Limited.
Overall, the global blood cancer diagnostics market is anticipated to witness steady growth through 2022. The market will continue to be influenced by regulatory policies and guidelines.
Table of Contents Covered in the report are:
Chapter 1. Global Blood Cancer Diagnostics Market - Executive Summary. 12
Chapter 2. Global Blood Cancer Diagnostics Market Overview. 14
2.1. Introduction. 14
2.1.1. Global Blood Cancer Diagnostics Market Taxonomy. 14
2.1.2. Global Blood Cancer Diagnostics Market Definition. 14
2.2. Global Blood Cancer Diagnostics Market Size (US$ Mn) and Forecast, 2012-2022. 15
2.2.1. Global Blood Cancer Diagnostics Market Y-o-Y Growth. 15
2.3. Global Blood Cancer Diagnostics Market Dynamics. 15
2.3.1. Drivers. 15
2.3.2. Restraints. 16
2.3.3. Trends. 16
2.4. Supply Chain. 16
2.5. Epidemiology. 16
2.6. List of Distributors. 16
2.7. Average Pricing Analysis. 17
2.8. Regulations. 17
2.9. Key Participants Market Presence (Intensity Map) By Region. 17
Speak To Research Analyst for Detailed Insights @ https://www.factmr.com/connectus/sample?flag=AE&rep_id=47
Chapter 3. Global Blood Cancer Diagnostics Market Analysis and Forecast By Test Type. 18
3.1. Global Blood Cancer Diagnostics Market Size and Forecast By Test Type, 2012-2022. 18
3.1.1. CBC Tests Blood Cancer Diagnostics Market Size and Forecast, 2012-2022. 18
3.1.1.1. Revenue (US$ Mn) Comparison, By Region. 18
3.1.1.2. Market Share Comparison, By Region. 20
3.1.1.3. Y-o-Y growth Comparison, By Region. 20
3.1.2. CTC Tests Blood Cancer Diagnostics Market Size and Forecast, 2012-2022. 21
3.1.2.1. Revenue (US$ Mn) Comparison, By Region. 21
3.1.2.2. Market Share Comparison, By Region. 23
3.1.2.3. Y-o-Y growth Comparison, By Region. 23
3.1.3. Blood Protein Testing Blood Cancer Diagnostics Market Size and Forecast, 2012-2022. 24
3.1.3.1. Revenue (US$ Mn) Comparison, By Region. 24
3.1.3.2. Market Share Comparison, By Region. 26
3.1.3.3. Y-o-Y growth Comparison, By Region. 26
3.1.4. Liquid Biopsy Blood Cancer Diagnostics Market Size and Forecast, 2012-2022. 27
3.1.4.1. Revenue (US$ Mn) Comparison, By Region. 27
3.1.4.2. Market Share Comparison, By Region. 29
3.1.4.3. Y-o-Y growth Comparison, By Region. 29
3.1.5. Bone Marrow Biopsy Blood Cancer Diagnostics Market Size and Forecast, 2012-2022. 30
3.1.5.1. Revenue (US$ Mn) Comparison, By Region. 30
3.1.5.2. Market Share Comparison, By Region. 32
3.1.5.3. Y-o-Y growth Comparison, By Region. 32
3.1.6. Others Blood Cancer Diagnostics Market Size and Forecast, 2012-2022. 33
3.1.6.1. Revenue (US$ Mn) Comparison, By Region. 33
3.1.6.2. Market Share Comparison, By Region. 35
3.1.6.3. Y-o-Y growth Comparison, By Region. 35
Access This Report @ https://www.factmr.com/checkout/47/S
Chapter 4. Global Blood Cancer Diagnostics Market Analysis and Forecast By End User. 37
4.1. Global Blood Cancer Diagnostics Market Size and Forecast By End User, 2012-2022. 37
4.1.1. Hospital Associated Labs Blood Cancer Diagnostics Market Size and Forecast, 2012-2022. 37
4.1.1.1. Revenue (US$ Mn) Comparison, By Region. 37
4.1.1.2. Market Share Comparison, By Region. 39
4.1.1.3. Y-o-Y growth Comparison, By Region. 39
4.1.2. Independent Diagnostic Laboratories Blood Cancer Diagnostics Market Size and Forecast, 2012-2022. 40
4.1.2.1. Revenue (US$ Mn) Comparison, By Region. 40
4.1.2.2. Market Share Comparison, By Region. 42
4.1.2.3. Y-o-Y growth Comparison, By Region. 42
4.1.3. Cancer Research Institutes Blood Cancer Diagnostics Market Size and Forecast, 2012-2022. 43
4.1.3.1. Revenue (US$ Mn) Comparison, By Region. 43
4.1.3.2. Market Share Comparison, By Region. 45
4.1.3.3. Y-o-Y growth Comparison, By Region. 45
4.1.4. Others Blood Cancer Diagnostics Market Size and Forecast, 2012-2022. 46
4.1.4.1. Revenue (US$ Mn) Comparison, By Region. 46
4.1.4.2. Market Share Comparison, By Region. 48
4.1.4.3. Y-o-Y growth Comparison, By Region. 48
Chapter 5. Global Blood Cancer Diagnostics Market Analysis and Forecast By Region. 50
5.1. Global Blood Cancer Diagnostics Market Size and Forecast, 2012-2022. 50
5.1.1. North America Blood Cancer Diagnostics Market Size and Forecast, 2012-2022. 50
5.1.1.1. Revenue (US$ Mn) Comparison, By Test Type. 50
5.1.1.2. Revenue (US$ Mn) Comparison, By End User. 52
5.1.2. Latin America Blood Cancer Diagnostics Market Size and Forecast, 2012-2022. 54
5.1.2.1. Revenue (US$ Mn) Comparison, By Test Type. 54
5.1.2.2. Revenue (US$ Mn) Comparison, By End User. 55
5.1.3. Europe Blood Cancer Diagnostics Market Size and Forecast, 2012-2022. 57
5.1.3.1. Revenue (US$ Mn) Comparison, By Test Type. 57
5.1.3.2. Revenue (US$ Mn) Comparison, By End User. 59
5.1.4. Japan Blood Cancer Diagnostics Market Size and Forecast, 2012-2022. 61
5.1.4.1. Revenue (US$ Mn) Comparison, By Test Type. 61
5.1.4.2. Revenue (US$ Mn) Comparison, By End User. 62
5.1.5. APEJ Blood Cancer Diagnostics Market Size and Forecast, 2012-2022. 64
5.1.5.1. Revenue (US$ Mn) Comparison, By Test Type. 64
5.1.5.2. Revenue (US$ Mn) Comparison, By End User. 66
5.1.6. MEA Blood Cancer Diagnostics Market Size and Forecast, 2012-2022. 67
5.1.6.1. Revenue (US$ Mn) Comparison, By Test Type. 67
5.1.6.2. Revenue (US$ Mn) Comparison, By End User. 69
Chapter 6. North America Blood Cancer Diagnostics Market Analysis and Forecast, By Country, 2012-2022. 71
6.1. US Blood Cancer Diagnostics Market Size and Forecast, 2012-2022. 71
6.1.1. Revenue (US$ Mn) Comparison, By Test Type. 71
6.1.2. Revenue (US$ Mn) Comparison, By End User. 72
6.2. Canada Blood Cancer Diagnostics Market Size and Forecast, 2012-2022. 73
6.2.1. Revenue (US$ Mn) Comparison, By Test Type. 73
6.2.2. Revenue (US$ Mn) Comparison, By End User. 74
Chapter 7. Latin America Blood Cancer Diagnostics Market Analysis and Forecast, By Country, 2012-2022. 75
7.1. Brazil Blood Cancer Diagnostics Market Size and Forecast, 2012-2022. 75
7.1.1. Revenue (US$ Mn) Comparison, By Test Type. 75
7.1.2. Revenue (US$ Mn) Comparison, By End User. 76
7.2. Mexico Blood Cancer Diagnostics Market Size and Forecast, 2012-2022. 77
7.2.1. Revenue (US$ Mn) Comparison, By Test Type. 77
7.2.2. Revenue (US$ Mn) Comparison, By End User. 78
7.3. Argentina Blood Cancer Diagnostics Market Size and Forecast, 2012-2022. 79
7.3.1. Revenue (US$ Mn) Comparison, By Test Type. 79
7.3.2. Revenue (US$ Mn) Comparison, By End User. 80
And Continue...
About FactMR
FactMR is a fast-growing market research firm that offers the most comprehensive suite of syndicated and customized market research reports. We believe transformative intelligence can educate and inspire businesses to make smarter decisions. We know the limitations of the one-size-fits-all approach; that's why we publish multi-industry global, regional, and country-specific research reports.
Contact Us
FactMR
11140 Rockville Pike
Suite 400
Rockville, MD 20852
United States
Email: sales@factmr.com
Web: www.factmr.com/
Follow Us on Linkedin: www.linkedin.com/company/factmr/
This release was published on openPR.
Permanent link to this press release:
Copy
Please set a link in the press area of your homepage to this press release on openPR. openPR disclaims liability for any content contained in this release.
You can edit or delete your press release Trends in the Ready To Use Blood Cancer Diagnostics Market 2018-2020 here
News-ID: 1583926 • Views: …
More Releases from Fact.MR
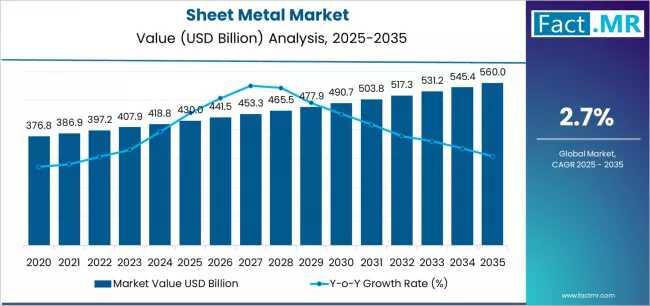
Sheet Metal Market Forecast 2026-2036: Market Value to Reach USD 560.0 Billion b …
The global sheet metal market is valued at USD 430.0 billion in 2025 and is projected to climb to USD 560.0 billion by 2035. Expanding at a compound annual growth rate (CAGR) of 2.7%, this market serves as a cornerstone for global infrastructure, automotive production, and industrial machinery, expected to grow nearly 1.3X over the forecast period.
Get Aceess Sample Report : https://www.factmr.com/connectus/sample?flag=S&rep_id=4531
sheet metal market Quick Stats
Market size 2025? USD…
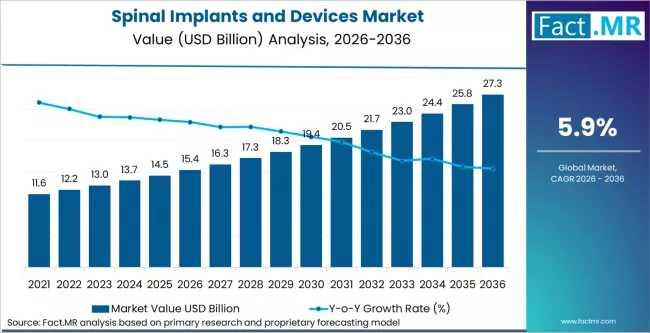
Spinal Implants and Devices Market Forecast 2026-2036: Market to Reach USD 26.9 …
The global spinal implants and devices market is projected to be valued at USD 15.4 billion in 2026 and is expected to climb to USD 26.9 billion by 2036. This steady expansion, represented by a CAGR of 5.9%, is fueled by the rising prevalence of spinal disorders, an aging global population, and a shifting clinical preference toward advanced surgical treatments and minimally invasive procedures.
Get Aceess Sample Report : https://www.factmr.com/connectus/sample?flag=S&rep_id=12557
Spinal…
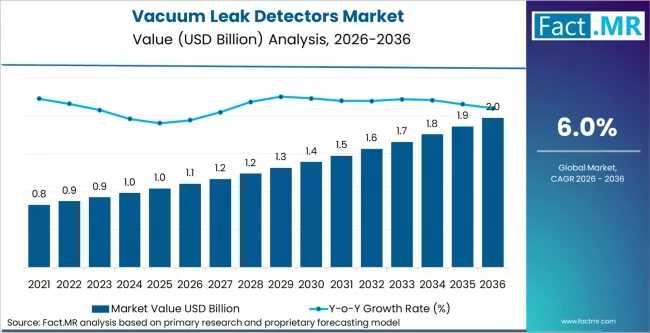
Vacuum Leak Detectors Market Forecast 2026-2036: Market to Reach USD 1.9 Billion …
The global vacuum leak detectors market is projected to reach a valuation of USD 1.1 billion in 2026, expanding to USD 1.9 billion by 2036. This steady growth, representing a CAGR of 6.0%, is fueled by massive semiconductor fab expansions and the rapid rise of electric vehicle (EV) battery manufacturing requiring high-precision integrity testing.
Get Aceess Sample Report : https://www.factmr.com/connectus/sample?flag=S&rep_id=14438
global vacuum leak detectors market Quick Stats
Market size 2026? USD 1.1…
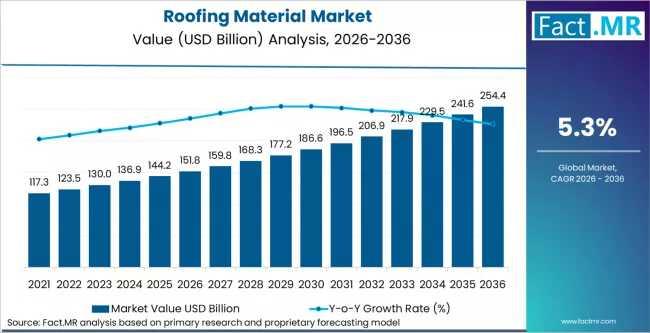
Roofing Material Market Forecast 2026-2036: Market to Hit USD 254.4 Billion by 2 …
The global roofing material market is projected to reach a valuation of USD 151.8 billion in 2026, climbing to USD 254.4 billion by 2036. This expansion represents a steady CAGR of 5.3% over the ten-year forecast period. The market's momentum is primarily anchored by an accelerating re-roofing wave in North America and Europe alongside robust new construction across Asian and Latin American urban centers.
Get Aceess Sample Report : https://www.factmr.com/connectus/sample?flag=S&rep_id=14436
Roofing Material…
More Releases for Comparison
Waveguide port - flange size comparison table
The relationship between waveguide port dimensions, flange [https://www.leader-mw.com/rf-integrated-load-dc-18ghz-with-tab-mount-20w-power-product/] sizes, and frequency bands is standardized to ensure mechanical compatibility and optimal RF performance. Below is a simplified comparison table and key principles for common rectangular waveguides and their associated flanges.
Key Concepts
1. Waveguide Designation: Waveguides are labeled with "WR" (Waveguide Rectangular) followed by a number (e.g., WR-90). The number approximates the inner broad-wall dimension in hundredths of an inch (e.g., WR-90 almost…
Polyester vs Chenille: A Detailed Comparison
Choosing between polyester and chenille can make or break your next furniture purchase, clothing investment, or home decor project. These two fabrics [https://www.yituofabrics.com/cotton-embroidery-fabric/] couldn't be more different-one prioritizes durability and easy care, while the other delivers unmatched softness and luxury.
Polyester dominates the textile industry as a synthetic workhorse that resists wrinkles, dries quickly, and costs less than most alternatives. Chenille offers the plush, velvety texture that makes blankets irresistible and…
Velvet vs Chenille: A Comprehensive Comparison
Choosing between velvet and chenille for your furniture can make or break your living space's comfort and style. These two popular upholstery fabrics might both feel soft, but they're completely different in terms of durability, maintenance, and overall vibe.
Chenille gives you that cozy, lived-in comfort that's perfect for Netflix marathons and family gatherings. Velvet delivers luxury and elegance but demands more careful treatment to keep looking its best.
Chenille
Chenille is a…
Fabric Cutting Methods: A Technical Comparison
Introduction to Cutting Technologies
Modern textile production utilizes various cutting methods, each with distinct advantages depending on application requirements. This analysis compares four primary techniques to help professionals select optimal solutions for their operations.
Laser cutting fabric has become a popular technique for creating precise, intricate designs. The process works best with materials that are stable, heat-resistant, and easy to cut. Common fabrics for laser cutting include cotton, polyester, felt, and synthetic…
STM32F vs STM32G: A Comprehensive Comparison
When it comes to embedded systems development, selecting the right microcontroller (MCU) can significantly impact the performance, power consumption, and cost-effectiveness of your project. STM32F vs STM32G ( https://www.chipmall.com/blogs/stm32f-vs-stm32g_92 ) is a common comparison in the embedded community, as both series from STMicroelectronics offer powerful solutions, but they serve different needs and use cases. The STM32F and STM32G families, both based on ARM Cortex-M cores, provide developers with a wide…
Moneybrag.com Offers Reliable Financial Comparison Services
Moneybrag.com is a leading online firm that specializes in online comparison services that enable clients to make comparisons of utility and personal finance products. Their primary goal is to provide information in an understandable format that allows for initial comparisons to be made at a glance. This enables customers to make healthy financial decisions. Moneybrag.com gives customers the ability to compare side by side and select a vendor based on…
