Press release
Patient Positioning Market : Latest Innovations, Drivers and Industry Key Events 2018 – 2028

Patient Positioning
Competition Tracking
The report has also outlined the competitive landscape of global market for patient positioning systems, which includes Mizuho OSI, LEONI AG, C-RAD, Elekta AB(publ), Skytron, Span-America Medical Systems, Inc., STERIS plc., Stryker Corporation, and Hill-Rom, Inc.
Request Sample Report @ https://www.factmr.com/connectus/sample?flag=S&rep_id=52
Surgical Tables Have the Largest Revenue Share Contribution
The surgical tables segment accounted for 27% revenue share in the patient positioning systems market in the year 2017 which was higher than the 19% revenue share of tables segment. The surgical tables segment is poised to grow to almost half a billion by the end of 2022.
Lesser Opportunity in Radiolucent Imaging and Examination Tables
Radiolucent imaging is estimated to be a little over US$ 360 million by end 2022 and is on track to witness a steady CAGR of over 6%. North America accounts for approx. 40% of the radiolucent segment, and it is highly likely to retain this share for the rest of the study period. With respect to examination tables, a market opportunity of under US$ 200 million in 2017 might not seem very attractive initially but a CAGR of 5.2% for the five year period could be enough to sway major players to focus on this segment in the patient positioning systems market. The companies would be recommended to target Europe owing to the potential of emerging opportunities during the forecast period.
Request/View Toc@ https://www.factmr.com/connectus/sample?flag=T&rep_id=52
Accessories and 'Other' Patient Positioning Systems Niche Segments
With a revenue share of 12% and 7.7% in Accessories and Other patient positioning systems respectively, the two are undoubtedly niche segments in the patient positioning systems market. However, it would be unwise to ignore them entirely and manufacturers could focus on targeting North America in both cases as the region can present a significantly large market opportunity. The combined market value of the two segments in North America in the year 2017 could easily exceed US$ 100 million which manufacturers should take cognizance of while devising their investment plans. In both cases, North America alone accounts for roughly 2/5th of the patient positioning systems market.
Ambulatory Surgical and Global Diagnostic Centres Remain Lucrative
The market opportunity that exists in the ambulatory surgical centres and global diagnostic centres is quite similar. Ambulatory surgical centres were worth just over US$ 330 million in 2017 and may grow with a CAGR of 7.3% from 2017-2022. On the other hand, global diagnostic centres may near a value of half a billion dollars by the end of the forecast period which would be equal to a revenue share of 27%. Europe and North America dominate the global diagnostics centre segment of the patient positioning systems market as they comprise more than half the market opportunity.
Speak To Research Analyst for Detailed Insights @ https://www.factmr.com/connectus/sample?flag=AE&rep_id=52
Table of Contents Covered in the report are:
Chapter 1. Global Patient Positioning Systems Market - Executive Summary. 27
Chapter 2. Global Patient Positioning Systems Market Overview. 29
2.1. Introduction. 29
2.1.1. Global Patient Positioning Systems Market Taxonomy. 29
2.1.2. Global Patient Positioning Systems Market Definition. 29
2.2. Global Patient Positioning Systems Market Size (US$ Mn) and Forecast, 2012-2022. 30
2.2.1. Global Patient Positioning Systems Market Y-o-Y Growth. 30
2.3. Global Patient Positioning Systems Market Dynamics. 30
2.3.1. Drivers. 30
2.3.2. Restraints. 31
2.3.3. Trends. 31
2.4. Supply Chain. 31
2.5. Cost Structure. 31
2.6. Pricing Analysis. 31
2.7. Raw Material Sourcing Strategy and Analysis. 32
2.8. List of Distributors. 32
2.9. Key Participants Market Presence (Intensity Map) By Region. 32
Access This Report @ https://www.factmr.com/checkout/52/S
Chapter 3. Global Patient Positioning Systems Market Analysis and Forecast By By Product. 33
3.1. Global Patient Positioning Systems Market Size and Forecast By By Product, 2012-2022. 33
3.1.1. Tables Patient Positioning Systems Market Size and Forecast, 2012-2022. 33
3.1.1.1. Revenue (US$ Mn) Comparison, By Region. 33
3.1.1.2. Market Share Comparison, By Region. 35
3.1.1.3. Y-o-Y growth Comparison, By Region. 35
3.1.2. Surgical Tables Patient Positioning Systems Market Size and Forecast, 2012-2022. 36
3.1.2.1. Revenue (US$ Mn) Comparison, By Region. 36
3.1.2.2. Market Share Comparison, By Region. 38
3.1.2.3. Y-o-Y growth Comparison, By Region. 38
3.1.3. Radiolucent Imaging Tables Patient Positioning Systems Market Size and Forecast, 2012-2022. 39
3.1.3.1. Revenue (US$ Mn) Comparison, By Region. 39
3.1.3.2. Market Share Comparison, By Region. 41
3.1.3.3. Y-o-Y growth Comparison, By Region. 41
3.1.4. Examination Tables Patient Positioning Systems Market Size and Forecast, 2012-2022. 42
3.1.4.1. Revenue (US$ Mn) Comparison, By Region. 42
3.1.4.2. Market Share Comparison, By Region. 44
3.1.4.3. Y-o-Y growth Comparison, By Region. 44
3.1.5. Accessories Patient Positioning Systems Market Size and Forecast, 2012-2022. 45
3.1.5.1. Revenue (US$ Mn) Comparison, By Region. 45
3.1.5.2. Market Share Comparison, By Region. 47
3.1.5.3. Y-o-Y growth Comparison, By Region. 47
3.1.6. Other Patient Positioning Systems Patient Positioning Systems Market Size and Forecast, 2012-2022. 48
3.1.6.1. Revenue (US$ Mn) Comparison, By Region. 48
3.1.6.2. Market Share Comparison, By Region. 51
3.1.6.3. Y-o-Y growth Comparison, By Region. 51
Chapter 4. Global Patient Positioning Systems Market Analysis and Forecast By By End User. 53
4.1. Global Patient Positioning Systems Market Size and Forecast By By End User, 2012-2022. 53
4.1.1. Hospitals Patient Positioning Systems Market Size and Forecast, 2012-2022. 53
4.1.1.1. Revenue (US$ Mn) Comparison, By Region. 53
4.1.1.2. Market Share Comparison, By Region. 55
4.1.1.3. Y-o-Y growth Comparison, By Region. 55
4.1.2. Ambulatory Surgical Centers Patient Positioning Systems Market Size and Forecast, 2012-2022. 56
4.1.2.1. Revenue (US$ Mn) Comparison, By Region. 56
4.1.2.2. Market Share Comparison, By Region. 58
4.1.2.3. Y-o-Y growth Comparison, By Region. 58
4.1.3. Diagnostic Centers Patient Positioning Systems Market Size and Forecast, 2012-2022. 59
4.1.3.1. Revenue (US$ Mn) Comparison, By Region. 59
4.1.3.2. Market Share Comparison, By Region. 61
4.1.3.3. Y-o-Y growth Comparison, By Region. 61
4.1.4. Others Patient Positioning Systems Market Size and Forecast, 2012-2022. 62
4.1.4.1. Revenue (US$ Mn) Comparison, By Region. 62
4.1.4.2. Market Share Comparison, By Region. 64
4.1.4.3. Y-o-Y growth Comparison, By Region. 64
Chapter 5. Global Patient Positioning Systems Market Analysis and Forecast By By Application. 66
5.1. Global Patient Positioning Systems Market Size and Forecast By By Application, 2012-2022. 66
5.1.1. Surgery Patient Positioning Systems Market Size and Forecast, 2012-2022. 66
5.1.1.1. Revenue (US$ Mn) Comparison, By Region. 66
5.1.1.2. Market Share Comparison, By Region. 68
5.1.1.3. Y-o-Y growth Comparison, By Region. 68
5.1.2. Diagnostics & Imaging Patient Positioning Systems Market Size and Forecast, 2012-2022. 69
5.1.2.1. Revenue (US$ Mn) Comparison, By Region. 69
5.1.2.2. Market Share Comparison, By Region. 71
5.1.2.3. Y-o-Y growth Comparison, By Region. 71
5.1.3. Cancer Therapy Patient Positioning Systems Market Size and Forecast, 2012-2022. 72
5.1.3.1. Revenue (US$ Mn) Comparison, By Region. 72
5.1.3.2. Market Share Comparison, By Region. 74
5.1.3.3. Y-o-Y growth Comparison, By Region. 74
Chapter 6. Global Patient Positioning Systems Market Analysis and Forecast By Region. 76
6.1. Global Patient Positioning Systems Market Size and Forecast, 2012-2022. 76
6.1.1. North America Patient Positioning Systems Market Size and Forecast, 2012-2022. 76
6.1.1.1. Revenue (US$ Mn) Comparison, By By Product. 76
6.1.1.2. Revenue (US$ Mn) Comparison, By By Application. 81
6.1.2. Latin America Patient Positioning Systems Market Size and Forecast, 2012-2022. 83
6.1.2.1. Revenue (US$ Mn) Comparison, By By Product. 83
6.1.2.2. Revenue (US$ Mn) Comparison, By By End User. 84
6.1.2.3. Revenue (US$ Mn) Comparison, By By Application. 86
6.1.3. Europe Patient Positioning Systems Market Size and Forecast, 2012-2022. 88
6.1.3.1. Revenue (US$ Mn) Comparison, By By Product. 88
6.1.3.2. Revenue (US$ Mn) Comparison, By By End User. 89
6.1.3.3. Revenue (US$ Mn) Comparison, By By Application. 91
6.1.4. Japan Patient Positioning Systems Market Size and Forecast, 2012-2022. 93
6.1.4.1. Revenue (US$ Mn) Comparison, By By Product. 93
6.1.4.2. Revenue (US$ Mn) Comparison, By By End User. 94
6.1.4.3. Revenue (US$ Mn) Comparison, By By Application. 96
6.1.5. APEJ Patient Positioning Systems Market Size and Forecast, 2012-2022. 98
6.1.5.1. Revenue (US$ Mn) Comparison, By By Product. 98
6.1.5.2. Revenue (US$ Mn) Comparison, By By End User. 99
6.1.5.3. Revenue (US$ Mn) Comparison, By By Application. 101
6.1.6. MEA Patient Positioning Systems Market Size and Forecast, 2012-2022. 103
6.1.6.1. Revenue (US$ Mn) Comparison, By By Product. 103
6.1.6.2. Revenue (US$ Mn) Comparison, By By End User. 104
6.1.6.3. Revenue (US$ Mn) Comparison, By By Application. 106
And Continue...
About FactMR
FactMR is a fast-growing market research firm that offers the most comprehensive suite of syndicated and customized market research reports. We believe transformative intelligence can educate and inspire businesses to make smarter decisions. We know the limitations of the one-size-fits-all approach; that's why we publish multi-industry global, regional, and country-specific research reports.
Contact Us
FactMR
11140 Rockville Pike
Suite 400
Rockville, MD 20852
United States
Email: sales@factmr.com
Web: www.factmr.com/
Follow Us on Linkedin: www.linkedin.com/company/factmr/
This release was published on openPR.
Permanent link to this press release:
Copy
Please set a link in the press area of your homepage to this press release on openPR. openPR disclaims liability for any content contained in this release.
You can edit or delete your press release Patient Positioning Market : Latest Innovations, Drivers and Industry Key Events 2018 – 2028 here
News-ID: 1583911 • Views: …
More Releases from Fact.MR
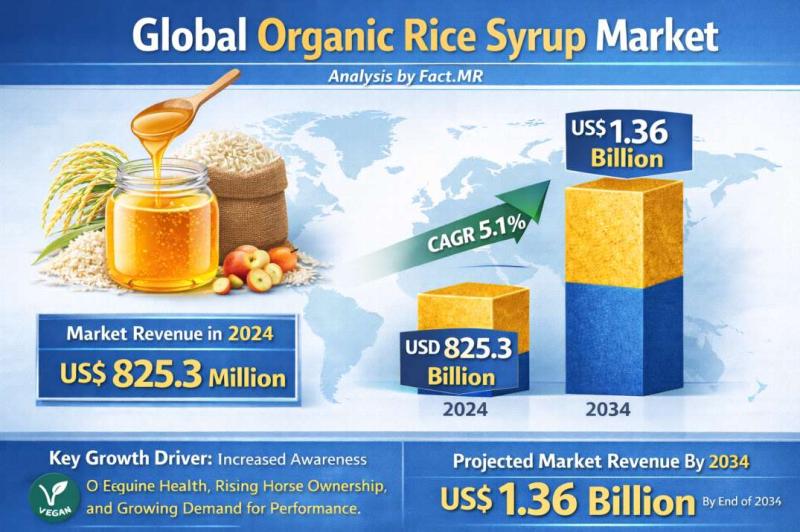
Organic Rice Syrup Market is forecasted to increase at a CAGR of 5.1% and US$ 1. …
The global Organic Rice Syrup Market is projected to expand steadily over the coming decade, driven by rising consumer demand for natural, clean-label sweeteners and growing awareness of health and wellness trends. Industry analysts estimate that the organic rice syrup market, valued at approximately USD 450 million in 2025, is expected to reach nearly USD 880 million by 2035, registering a compound annual growth rate (CAGR) of about 7.1% during…
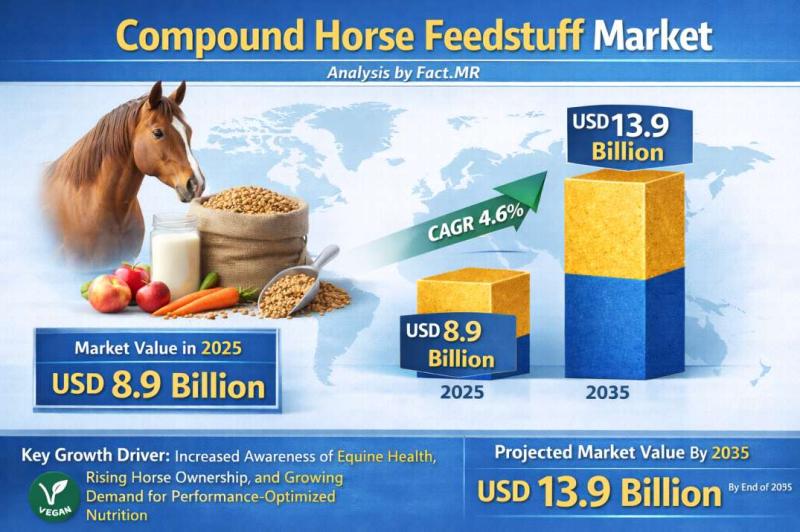
Compound Horse Feedstuff Market is Estimated to Grow at a CAGR of 4.6%, Reaching …
The global compound horse feedstuff market is galloping toward steady growth, projected to expand from a valuation of USD 3.8 billion in 2026 to approximately USD 5.4 billion by 2036. This represents a compound annual growth rate (CAGR) of 3.6% over the ten-year forecast period.
The market is being driven by the "humanization" of equine companions, the professionalization of equestrian sports, and a significant shift toward specialized performance nutrition that…
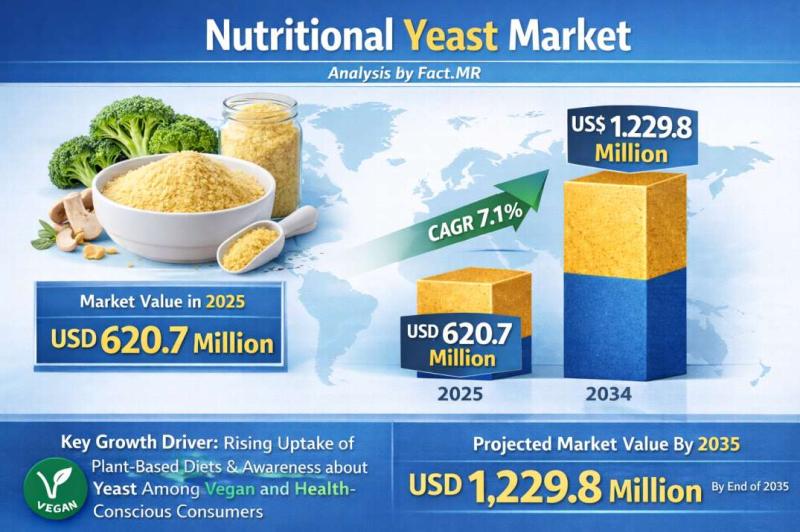
Nutritional Yeast Market Forecasted CAGR is 7.1% by 2035 | Fact.MR Report
The global nutritional yeast market is experiencing a significant surge in demand, projected to grow from a valuation of USD 515.2 million in 2026 to approximately USD 1.2 billion by 2036. This represents a robust compound annual growth rate (CAGR) of 8.8% over the ten-year forecast period.
The market is being propelled by the global explosion of plant-based diets and the "clean-label" movement, with nutritional yeast emerging as the primary…
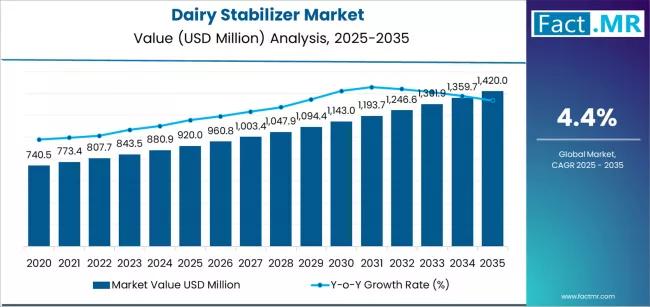
Dairy Stabilizer Market is Expected to Reach USD 1,420.0 million by 2035 | Resea …
The global Dairy Stabilizers Market is projected to sustain solid growth over the next decade as consumer demand for high-quality dairy and dairy-based products continues to expand across foodservice and retail sectors. Industry analysts estimate that the dairy stabilizers market, valued at approximately USD 2.4 billion in 2025, is expected to reach around USD 4.3 billion by 2035, registering a compound annual growth rate (CAGR) of about 6.5% during the…
More Releases for Comparison
Waveguide port - flange size comparison table
The relationship between waveguide port dimensions, flange [https://www.leader-mw.com/rf-integrated-load-dc-18ghz-with-tab-mount-20w-power-product/] sizes, and frequency bands is standardized to ensure mechanical compatibility and optimal RF performance. Below is a simplified comparison table and key principles for common rectangular waveguides and their associated flanges.
Key Concepts
1. Waveguide Designation: Waveguides are labeled with "WR" (Waveguide Rectangular) followed by a number (e.g., WR-90). The number approximates the inner broad-wall dimension in hundredths of an inch (e.g., WR-90 almost…
Polyester vs Chenille: A Detailed Comparison
Choosing between polyester and chenille can make or break your next furniture purchase, clothing investment, or home decor project. These two fabrics [https://www.yituofabrics.com/cotton-embroidery-fabric/] couldn't be more different-one prioritizes durability and easy care, while the other delivers unmatched softness and luxury.
Polyester dominates the textile industry as a synthetic workhorse that resists wrinkles, dries quickly, and costs less than most alternatives. Chenille offers the plush, velvety texture that makes blankets irresistible and…
Velvet vs Chenille: A Comprehensive Comparison
Choosing between velvet and chenille for your furniture can make or break your living space's comfort and style. These two popular upholstery fabrics might both feel soft, but they're completely different in terms of durability, maintenance, and overall vibe.
Chenille gives you that cozy, lived-in comfort that's perfect for Netflix marathons and family gatherings. Velvet delivers luxury and elegance but demands more careful treatment to keep looking its best.
Chenille
Chenille is a…
Fabric Cutting Methods: A Technical Comparison
Introduction to Cutting Technologies
Modern textile production utilizes various cutting methods, each with distinct advantages depending on application requirements. This analysis compares four primary techniques to help professionals select optimal solutions for their operations.
Laser cutting fabric has become a popular technique for creating precise, intricate designs. The process works best with materials that are stable, heat-resistant, and easy to cut. Common fabrics for laser cutting include cotton, polyester, felt, and synthetic…
STM32F vs STM32G: A Comprehensive Comparison
When it comes to embedded systems development, selecting the right microcontroller (MCU) can significantly impact the performance, power consumption, and cost-effectiveness of your project. STM32F vs STM32G ( https://www.chipmall.com/blogs/stm32f-vs-stm32g_92 ) is a common comparison in the embedded community, as both series from STMicroelectronics offer powerful solutions, but they serve different needs and use cases. The STM32F and STM32G families, both based on ARM Cortex-M cores, provide developers with a wide…
Moneybrag.com Offers Reliable Financial Comparison Services
Moneybrag.com is a leading online firm that specializes in online comparison services that enable clients to make comparisons of utility and personal finance products. Their primary goal is to provide information in an understandable format that allows for initial comparisons to be made at a glance. This enables customers to make healthy financial decisions. Moneybrag.com gives customers the ability to compare side by side and select a vendor based on…
