Press release
Thresher Segments, Opportunity, Growth and Forecast By End-use Industry 2018-2020

Thresher
Request Sample Report @ https://www.factmr.com/connectus/sample?flag=S&rep_id=514
Spike-tooth threshers and axial flow threshers will collectively represent the largest share on global market value through 2026
The performance advantages of spike-tooth threshers will drive their adoption in developing countries. Less laborious operability of these threshers will drive their use across traditional agricultural landscape. Axial flow threshers are also expected to witness significant sales growth as farmers from around the world will be eyeing at their use in increasing the profitability of threshing and harvesting. By the end of 2026, axial flow threshers and spike-tooth threshers will collectively account for more than 45% of the overall global market value.
Mechanical advantages of threshers equipped with hydraulics shall bolster their sales in the approaching years
Major players in the market are manufacturing threshers on hydraulics systems, offering machines that reflect high efficiency in terms of power transmission, torque consistency and economical maintenance. By 2026-end, more than half a million units of threshers sold in the global market will be developed on hydraulics mechanism. However, the demand for hybrid threshers will gain significant traction in the years to come. Over the forecast period, sales of threshers developed on hybrid mechanism will register a volume CAGR of 3.5%. Flexible operability, improved safety and sensor-integrated designs of hybrid threshers will drive their sales globally through 2026.
Request/View Toc@ https://www.factmr.com/connectus/sample?flag=T&rep_id=514
Manufacturers to consider wheat threshing as the most profitable and suitable operation for their offerings
It has been estimated that wheat threshing will account for more than one-fourth share on global thresher market value throughout the forecast period. Majority of thresher manufacturers in the world will be improving the designs of their threshers to befit the needs of farmers with respect to threshing and harvesting of cash crops. High profitability of threshing a cash crop such as wheat will be lucrative for adoption of threshers. And, Derre And Company, Mahindra and Mahindra, Deluxe Agro Industries, Rizhao Peakrising International Co. Ltd, Wuhan acme agro-tech co. ltd, AGCO, Zhaoqing Fengxiang Food Machinery Co. Ltd., Golden machinery equipment co. ltd., Shandong Guangzhong Machinery Co., Ltd., Hunan Sunfield Agricultural Machinery Co., Ltd., ALVAN BLANCH, ALMACO, Zhengzhou aix machinery equipment co. ltd., Amisy Farming Machine, Vishwakarmaagro, Cicoria, Amar Agriculture Machinery Group, and Iseki and Co. will be the leading thresher manufacturers that will be spearheading the production in the global threshers market through 2026.
The trend of mechanization continues to penetrate farming activities, wherein a range of agricultural equipment and machines provide the essential input to increase the crop yield. Threshers are among the key heavy fieldwork machineries in agriculture industry that can directly enhance the farm produce by effectively separating the grains and seeds from the chaff. As agricultural mechanization continues to gain grounds across the globe, new technologies and equipment are being integrated in the development of advanced threshers that separate the seeds from the straw and chaff, and also remove their stalks and husks to protect the quality of grains.
Speak To Research Analyst for Detailed Insights @ https://www.factmr.com/connectus/sample?flag=AE&rep_id=514
Table of Contents COvered in the report are:
1. Global Economic Outlook
2. Global Threshers Market - Executive Summary
2.1. Global Threshers Market – Opportunity Analysis & Mega Trends
3. Global Threshers Market Overview
3.1. Introduction
3.1.1. Global Threshers Market Taxonomy
3.1.2. Global Threshers Market Definition
3.2. Global Threshers Market Size (US$ Mn),volume (units) and Forecast, 2012-2026
3.2.1. Global Threshers Market Y-o-Y Growth
3.3. Global Agricultural Machinery Market
3.3.1. Macroeconomic Factors and Impact Analysis
3.3.2. Global Agriculture Machinery Market Value (US$ Mn), 2017–2026
3.4. Growth Opportunities of Threshers and Other Agricultural Equipment in Agriculture Sector
3.5. Impactful Trends Transforming Agriculture to High-Tech Industry
3.6. Key Challenges and Opportunities for Agriculture Machinery
3.7. Global Threshers Market Dynamics
3.7.1.Market Drivers
3.7.2.Market Restraints
3.7.3.Market trends
3.7.3.1. Impact Analysis By Product Type
3.7.3.2. Impact Analysis By Application Type
3.8. Value Chain
3.9. List of New Entrants
3.10. Global Threshers Market Forecast Factors
3.11. Technology Roadmap
3.12. PEST Analysis
3.13. Porter's Five Forces
3.14. Global Threshers Market Scenario forecast
3.14.1.Conservative Scenario
3.14.2.Likely Scenario
3.14.3.Optimistic Scenario
3.15. Pricing Analysis
3.15.1.Pricing Analysis, By Region and Product Type
3.15.2.Factors Influencing Pricing
3.16. Trade Analysis
3.16.1.Global Threshers Market: Import Data Analysis
3.16.2.Global Threshers Market: Export Data Analysis
3.17. Investment Feasible Index
3.18. Market Competition Structure
Access This Report @ https://www.factmr.com/checkout/514/S
4. Global Threshers Market Analysis and Forecast 2012-2026
4.1. Global Threshers Market Size and Forecast By Product Type, 2012-2026
4.1.1. Drummy type Market Size and Forecast, 2012-2026
4.1.1.1. Revenue (US$ Mn) & Volume (Unit) Comparison, By Region
4.1.1.2. Market Share Comparison, By Region
4.1.1.3. Y-o-Y growth Comparison, By Region
4.1.2. Hammer mill type Market Size and Forecast, 2012-2026
4.1.2.1. Revenue (US$ Mn) & Volume (Unit) Comparison, By Region
4.1.2.2. Market Share Comparison, By Region
4.1.2.3. Y-o-Y growth Comparison, By Region
4.1.3. Spike-tooth type Market Size and Forecast, 2012-2026
4.1.3.1. Revenue (US$ Mn) & Volume (Unit) Comparison, By Region
4.1.3.2. Market Share Comparison, By Region
4.1.3.3. Y-o-Y growth Comparison, By Region
4.1.4. Raspbar type Market Size and Forecast, 2012-2026
4.1.4.1. Revenue (US$ Mn) & Volume (Unit) Comparison, By Region
4.1.4.2. Market Share Comparison, By Region
4.1.4.3. Y-o-Y growth Comparison, By Region
4.1.5. Wire-loop type Market Size and Forecast, 2012-2026
4.1.5.1. Revenue (US$ Mn) & Volume (Unit) Comparison, By Region
4.1.5.2. Market Share Comparison, By Region
4.1.5.3. Y-o-Y growth Comparison, By Region
4.1.6. Axial flow type Market Size and Forecast, 2012-2026
4.1.6.1. Revenue (US$ Mn) & Volume (Unit) Comparison, By Region
4.1.6.2. Market Share Comparison, By Region
4.1.6.3. Y-o-Y growth Comparison, By Region
4.1.7. Syndicator type Market Size and Forecast, 2012-2026
4.1.7.1. Revenue (US$ Mn) & Volume (Unit) Comparison, By Region
4.1.7.2. Market Share Comparison, By Region
4.1.7.3. Y-o-Y growth Comparison, By Region
4.2. Global Threshers Market Size and Forecast By Mechanism Type, 2012-2026
4.2.1. Manual Market Size and Forecast, 2012-2026
4.2.1.1. Revenue (US$ Mn) & Volume (Unit) Comparison, By Region
4.2.1.2. Market Share Comparison, By Region
4.2.1.3. Y-o-Y growth Comparison, By Region
4.2.2. Hydraulic Market Size and Forecast, 2012-2026
4.2.2.1. Revenue (US$ Mn) & Volume (Unit) Comparison, By Region
4.2.2.2. Market Share Comparison, By Region
4.2.2.3. Y-o-Y growth Comparison, By Region
4.2.3. Hybrid Market Size and Forecast, 2012-2026
4.2.3.1. Revenue (US$ Mn) & Volume (Unit) Comparison, By Region
4.2.3.2. Market Share Comparison, By Region
4.2.3.3. Y-o-Y growth Comparison, By Region
4.3. Global Threshers Market Size and Forecast By Crop Type, 2012-2026
4.3.1. Wheat Thresher Market Size and Forecast, 2012-2026
4.3.1.1. Revenue (US$ Mn) & Volume (Unit) Comparison, By Region
4.3.1.2. Market Share Comparison, By Region
4.3.1.3. Y-o-Y growth Comparison, By Region
4.3.2. Rice Thresher Market Size and Forecast, 2012-2026
4.3.2.1. Revenue (US$ Mn) & Volume (Unit) Comparison, By Region
4.3.2.2. Market Share Comparison, By Region
4.3.2.3. Y-o-Y growth Comparison, By Region
4.3.3. Corn Sheller Market Size and Forecast, 2012-2026
4.3.3.1. Revenue (US$ Mn) & Volume (Unit) Comparison, By Region
4.3.3.2. Market Share Comparison, By Region
4.3.3.3. Y-o-Y growth Comparison, By Region
4.3.4. Maize Dehusker/Sheller Market Size and Forecast, 2012-2026
4.3.4.1. Revenue (US$ Mn) & Volume (Unit) Comparison, By Region
4.3.4.2. Market Share Comparison, By Region
4.3.4.3. Y-o-Y growth Comparison, By Region
4.3.5. Groundnut Thresher Market Size and Forecast, 2012-2026
4.3.5.1. Revenue (US$ Mn) & Volume (Unit) Comparison, By Region
4.3.5.2. Market Share Comparison, By Region
4.3.5.3. Y-o-Y growth Comparison, By Region
4.3.6. Sunflower Thresher Market Size and Forecast, 2012-2026
4.3.6.1. Revenue (US$ Mn) & Volume (Unit) Comparison, By Region
4.3.6.2. Market Share Comparison, By Region
4.3.6.3. Y-o-Y growth Comparison, By Region
4.3.7. Other Crops Market Size and Forecast, 2012-2026
4.3.7.1. Revenue (US$ Mn) & Volume (Unit) Comparison, By Region
4.3.7.2. Market Share Comparison, By Region
4.3.7.3. Y-o-Y growth Comparison, By Region
5. North America Threshers Market Size and Forecast, 2012-2026
5.1. North America Outlook
5.2. North America Parent Market Outlook
5.3. North America Target Market Outlook
5.4. Revenue (US$ Mn) & Volume (Unit) Comparison, By Country
5.4.1. US Market Size (US$ Mn) & volume (units) and Forecast, 2012-2026
5.4.2. Canada Market Size (US$ Mn) & volume (units) and Forecast, 2012-2026
5.5. Revenue (US$ Mn) & Volume (Unit) Comparison, By Product Type
5.6. Revenue (US$ Mn) & Volume (Unit) Comparison, By Mechanism Type
5.7. Revenue (US$ Mn) & Volume (Unit) Comparison, By Crop Type
And Continue...
About FactMR
FactMR is a fast-growing market research firm that offers the most comprehensive suite of syndicated and customized market research reports. We believe transformative intelligence can educate and inspire businesses to make smarter decisions. We know the limitations of the one-size-fits-all approach; that's why we publish multi-industry global, regional, and country-specific research reports.
Contact Us
FactMR
11140 Rockville Pike
Suite 400
Rockville, MD 20852
United States
Email: sales@factmr.com
Web: www.factmr.com/
Follow Us on Linkedin: www.linkedin.com/company/factmr/
This release was published on openPR.
Permanent link to this press release:
Copy
Please set a link in the press area of your homepage to this press release on openPR. openPR disclaims liability for any content contained in this release.
You can edit or delete your press release Thresher Segments, Opportunity, Growth and Forecast By End-use Industry 2018-2020 here
News-ID: 1563569 • Views: …
More Releases from Fact.MR
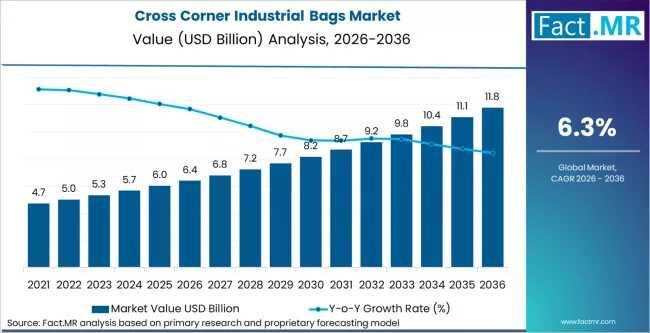
Cross Corner Industrial Bags Market Forecast 2026-2036: Market Value to Reach US …
global cross corner industrial bags market is valued at USD 6.4 billion in 2026 and is projected to surge to USD 11.8 billion by 2036. Growing at a compound annual growth rate (CAGR) of 6.3%, the market is being propelled by a fundamental shift in global bulk handling, where supply chains are increasingly adopting Flexible Intermediate Bulk Containers (FIBCs) for enhanced cost and logistics efficiency.
Get Access Report Sample : https://www.factmr.com/connectus/sample?flag=S&rep_id=14370
…
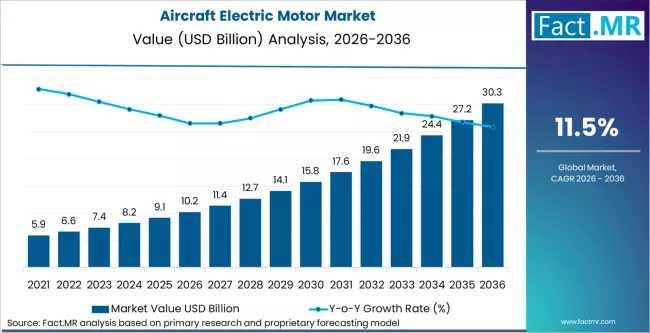
Aircraft Electric Motor Market Forecast 2026-2036: Market to Reach USD 30.9 Bill …
The global aircraft electric motor market is valued at USD 10.2 billion in 2026 and is projected to expand to USD 30.9 billion by 2036. This growth represents a CAGR of 11.5% over the ten-year forecast period. The market's structural expansion is driven by the transition from niche auxiliary power to performance-critical systems, enabling More Electric Aircraft (MEA) architectures that eliminate over 400 pounds of hydraulic and pneumatic hardware per…
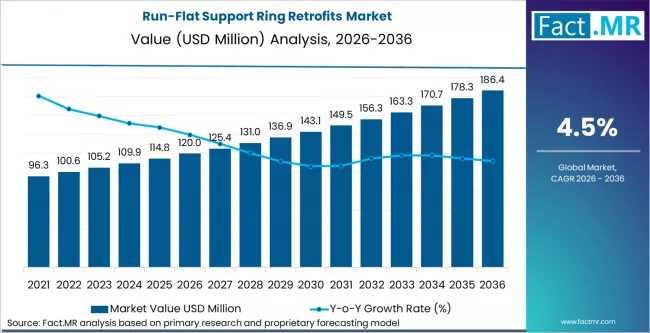
Run-Flat Support Ring Retrofits Market Forecast 2026-2036: Market to Reach USD 1 …
The global Run-Flat Support Ring Retrofits Market is valued at USD 120 million in 2026 and is projected to expand to USD 186 million by 2036. Growing at a compound annual growth rate (CAGR) of 4.5%, the market is increasingly shaped by rising consumer demand for safety features in high-performance and commercial vehicles. This growth, representing an absolute dollar opportunity of USD 66 million, reflects a transition toward aftermarket mobility…
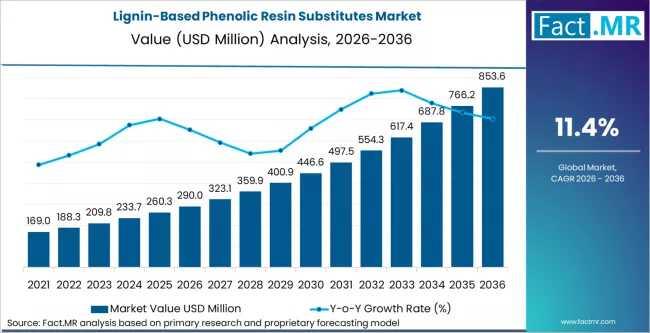
Lignin-Based Phenolic Resin Substitutes Market Forecast 2026-2036: Market to Rea …
The global Lignin-Based Phenolic Resin Substitutes Market is projected to reach a valuation of USD 290 million in 2026. Driven by an urgent industrial shift toward sustainable, bio-based alternatives to petroleum-derived resins, the market is expected to expand to USD 850 million by 2036. This growth represents a steady CAGR of 11.4% as the automotive, construction, and packaging sectors transition away from fossil-based feedstocks.
Get Access Report Sample : https://www.factmr.com/connectus/sample?flag=S&rep_id=14353
Quick…
More Releases for Comparison
Waveguide port - flange size comparison table
The relationship between waveguide port dimensions, flange [https://www.leader-mw.com/rf-integrated-load-dc-18ghz-with-tab-mount-20w-power-product/] sizes, and frequency bands is standardized to ensure mechanical compatibility and optimal RF performance. Below is a simplified comparison table and key principles for common rectangular waveguides and their associated flanges.
Key Concepts
1. Waveguide Designation: Waveguides are labeled with "WR" (Waveguide Rectangular) followed by a number (e.g., WR-90). The number approximates the inner broad-wall dimension in hundredths of an inch (e.g., WR-90 almost…
Polyester vs Chenille: A Detailed Comparison
Choosing between polyester and chenille can make or break your next furniture purchase, clothing investment, or home decor project. These two fabrics [https://www.yituofabrics.com/cotton-embroidery-fabric/] couldn't be more different-one prioritizes durability and easy care, while the other delivers unmatched softness and luxury.
Polyester dominates the textile industry as a synthetic workhorse that resists wrinkles, dries quickly, and costs less than most alternatives. Chenille offers the plush, velvety texture that makes blankets irresistible and…
Velvet vs Chenille: A Comprehensive Comparison
Choosing between velvet and chenille for your furniture can make or break your living space's comfort and style. These two popular upholstery fabrics might both feel soft, but they're completely different in terms of durability, maintenance, and overall vibe.
Chenille gives you that cozy, lived-in comfort that's perfect for Netflix marathons and family gatherings. Velvet delivers luxury and elegance but demands more careful treatment to keep looking its best.
Chenille
Chenille is a…
Fabric Cutting Methods: A Technical Comparison
Introduction to Cutting Technologies
Modern textile production utilizes various cutting methods, each with distinct advantages depending on application requirements. This analysis compares four primary techniques to help professionals select optimal solutions for their operations.
Laser cutting fabric has become a popular technique for creating precise, intricate designs. The process works best with materials that are stable, heat-resistant, and easy to cut. Common fabrics for laser cutting include cotton, polyester, felt, and synthetic…
STM32F vs STM32G: A Comprehensive Comparison
When it comes to embedded systems development, selecting the right microcontroller (MCU) can significantly impact the performance, power consumption, and cost-effectiveness of your project. STM32F vs STM32G ( https://www.chipmall.com/blogs/stm32f-vs-stm32g_92 ) is a common comparison in the embedded community, as both series from STMicroelectronics offer powerful solutions, but they serve different needs and use cases. The STM32F and STM32G families, both based on ARM Cortex-M cores, provide developers with a wide…
Moneybrag.com Offers Reliable Financial Comparison Services
Moneybrag.com is a leading online firm that specializes in online comparison services that enable clients to make comparisons of utility and personal finance products. Their primary goal is to provide information in an understandable format that allows for initial comparisons to be made at a glance. This enables customers to make healthy financial decisions. Moneybrag.com gives customers the ability to compare side by side and select a vendor based on…
