Press release
Activewear Market by Product (Ready to Wear; Fashion Outer, Pants, & T-Shirts; Rash Guard, Wet Suit, & Swim Wear; Shoes (Sports Shoes, Aqua Shoes, Aqua Socks); and Fashion Brand) and Fabric (Polyester, Nylon, Neoprene, Polypropylene, Spandex, Cotton and O
Active Wear Market
According to a new report published by Allied Market Research titled, Activewear Market by Product and Fabric: Global Opportunity Analysis and Industry Forecast, 20172024," the global activewear market was valued at $ 351,164 million in 2017, and is expected to reach $ 546,802 million by 2024, registering a CAGR of 6.5 % from 2018 to 2024. North America dominated the global activewear market in 2017, accounting for 42.3% of the total revenue.
Download PDF Report Sample @ https://www.alliedmarketresearch.com/request-sample/3249?utm_source=OPR
The extensive advantages offered by activewear such as water resistance, bi-stretchable function, anti-bacterial fabric, wicking function, and others and surge in participation of consumers in physical and fitness activities act as key demand driving factors of the global market. Moreover, female consumer base for activewear is increasing, owing to holistic approach of female customers towards sports and fitness. Likewise, increase in adoption of athleisure wear as work or street wear propels the growth of the overall market. Furthermore, rise in disposable income and increase in fitness concerns significantly contribute towards the growth of the market.
Increase in disposable income and rise in fitness consciousness customers fuel the growth of the global activewear market. In addition, upsurge in participation of the youth and old population in physical activities propels the demand for the sports-related products, thereby driving the market growth. However, rise in number of counterfeit products is leading to safety & quality issues for consumers and brand damage for key market players. For instance, In January 2018, Nike identified counterfeit activewear products worth more than $ 50,000 at Dulles International Airport in Virginia. These issues are leading to declining sales of the key activewear market players, which is adversely affecting the overall growth of the market. Moreover, volatile cost of raw materials and high cost of designing lead to high cost of the final product. Thus, high cost of activewear is resulting into declining sales among price-sensitive consumers.
The report segments the global activewear industry on the basis of product, fabric, and geography. Based on product, the market is categorized into ready to wear; fashion outer, pants, & t-shirts; rash guard, wet suit, & swim wear; shoes (sports shoes, aqua shoes, aqua socks); and fashion brand. By fabric, it is classified into polyester, nylon, neoprene, polypropylene, spandex, cotton, and others (rayon and lyocell). Geographically, it is analyzed across North America, Europe, Asia-Pacific, and LAMEA.
North America dominates the global activewear industry, owing to rise in trend of athleisure wear as office and casual wear. The European activewear market is growing exponentially, owing to high popularity of sports events, which lead to increased participation and high demand for fashion outer t-shirts and other activewear by the fan base. Asia-Pacific is expected to witness the highest growth rate from 2018 to 2024, due to increase in concerns towards health & wellness and rise in participation of youth population in sports activities. Improvement in living standards and rise in disposable income are expected to boost the growth of activewear market in LAMEA region.
The fashion outer, pants, & t-shirts segment generated the maximum revenue in 2017, due to high requirement of activewear to engage in fitness or sports activities. However, the ready to wear is expected to grow exponentially, owing to increase in trend of athleisure as a casual wear among the youth population across the world.
Get Customized Report @ https://www.alliedmarketresearch.com/request-for-customization/3249?utm_source=OPR
Demand for polyester segment by fabric is increasing, owing to extensive advantages of this fabric such as easy drying, adequate stretch ability, easy wash, resistance to abrasion & shrinkage, wrinkles resistance, and chemical resistance.
Major players in activewear market are Adidas AG, Asics Corporation, Columbia Sportswear Company, Dick's Sporting Goods, Inc. Gap Inc., Nike, Inc., North Face, Inc., Phillips-Van Heusen Corporation, Puma Se, and Under Armour, Inc.
Other prominent players in the market include 2XU Pty Ltd, 361 Degrees International Limited, Vie Active, LLC, Bike Athletic Company, Everlast Worldwide Incorporated, Sportika SA, Hongxing Erke Sports Goods Co., Ltd, Webb Ellis Ltd., Prince Global Sports, LLC, and Reusch International SPA.
Key Benefits
• The report provides an extensive analysis of the current & emerging market trends and opportunities in the global activewear market.
• The report provides detailed qualitative and quantitative analysis of current trends and future estimations that assists to evaluate the prevailing market opportunities.
• Comprehensive analysis of factors that drive and restrict the growth of the market is provided.
• Extensive analysis of the market is conducted by following key product positioning and monitoring the top competitors within the market framework.
• The report provides extensive qualitative insights on the potential and niche segments or regions exhibiting favorable growth.
LIST OF FIGURES
FIGURE 01. ACTIVEWEAR MARKET SNAPSHOT
FIGURE 02. ACTIVEWEAR MARKET: KEY PLAYERS
FIGURE 03. ACTIVEWEAR MARKET SEGMENTATION
FIGURE 04. TOP INVESTMENT POCKETS, 2017-2024
FIGURE 05. TOP IMPACTING FACTORS, 2017-2024
FIGURE 06. MODERATE-TO-HIGH BARGAINING POWER OF SUPPLIERS
FIGURE 07. HIGH BARGAINING POWER OF BUYERS
FIGURE 08. MODERATE THREAT OF NEW ENTRANTS
FIGURE 09. LOW THREAT OF SUBSTITUTION
FIGURE 10. HIGH INTENSITY OF COMPETITIVE RIVALRY
FIGURE 11. MARKET PLAYER POSITIONING, 2016
FIGURE 12. ACTIVEWEAR MARKET: DRIVERS, RESTRAINTS, OPPORTUNITIES AND CHALLENGES, 20182024
FIGURE 13. PERCENTAGE OF THE MALE, FEMALE, AND TOTAL POPULATION PARTICIPATION IN PHYSICAL ACTIVITIES IN U.S. (20092015)
FIGURE 14. GROSS NATIONAL INCOME PER CAPITA, ANNUAL GROWTH, 20112015 (%)
FIGURE 15. PRICE INDEX** FOR TEXTILE PRODUCTS AND APPAREL, 20082018*
FIGURE 16. ACTIVEWEAR MARKET, BY PRODUCT, 2017 (%)
FIGURE 17. READY TO WEAR ACTIVEWEAR MARKET, BY COUNTRY, 2017-2024 ($MILLION)
FIGURE 18. FASHION OUTER, PANTS, & T-SHIRTS ACTIVEWEAR MARKET, BY COUNTRY, 2017-2024 ($MILLION)
FIGURE 19. RASH GUARD, WET SUIT, & SWIM ACTIVEWEAR MARKET, BY COUNTRY, 2017-2024 ($MILLION)
FIGURE 20. SHOESSPORTS SHOES, AQUA SHOES, & AQUA SOCKS ACTIVEWEAR MARKET, BY COUNTRY, 2017-2024 ($MILLION)
FIGURE 21. FASHION BRAND ACTIVEWEAR MARKET, BY COUNTRY, 2017-2024 ($MILLION)
FIGURE 22. ACTIVEWEAR MARKET, BY FABRIC, 2017 (%)
FIGURE 23. POLYESTER ACTIVEWEAR MARKET, BY COUNTRY, 2017-2024 ($MILLION)
FIGURE 24. NYLON ACTIVEWEAR MARKET, BY COUNTRY, 2017-2024 ($MILLION)
FIGURE 25. NEOPRENE ACTIVEWEAR MARKET, BY COUNTRY, 2017-2024 ($MILLION)
FIGURE 26. POLYPROPYLENE ACTIVEWEAR MARKET, BY COUNTRY, 2017-2024 ($MILLION)
FIGURE 27. SPANDEX ACTIVEWEAR MARKET, BY COUNTRY, 2017-2024 ($MILLION)
FIGURE 28. COTTON ACTIVEWEAR MARKET, BY COUNTRY, 2017-2024 ($MILLION)
FIGURE 29. OTHER ACTIVEWEAR MARKET, BY COUNTRY, 2017-2024 ($MILLION)
FIGURE 30. ACTIVEWEAR MARKET, BY REGION, 2017 (%)
FIGURE 31. U.S. ACTIVEWEAR MARKET, 2017-2024 ($MILLION)
FIGURE 32. CANADA ACTIVEWEAR MARKET, 2017-2024 ($MILLION)
FIGURE 33. MEXICO ACTIVEWEAR MARKET, 2017-2024 ($MILLION)
FIGURE 34. UK ACTIVEWEAR MARKET, 2017-2024 ($MILLION)
FIGURE 35. GERMANY ACTIVEWEAR MARKET, 2017-2024 ($MILLION)
FIGURE 36. FRANCE ACTIVEWEAR MARKET, 2017-2024 ($MILLION)
FIGURE 37. SPAIN ACTIVEWEAR MARKET, 2017-2024 ($MILLION)
FIGURE 38. ITALY ACTIVEWEAR MARKET, 2017-2024 ($MILLION)
FIGURE 39. ACTIVEWEAR MARKET, 2017-2024 ($MILLION)
FIGURE 40. CHINA ACTIVEWEAR MARKET, 2017-2024 ($MILLION)
FIGURE 41. JAPAN ACTIVEWEAR MARKET, 2017-2024 ($MILLION)
FIGURE 42. INDIA ACTIVEWEAR MARKET, 2017-2024 ($MILLION)
FIGURE 43. AUSTRALIA ACTIVEWEAR MARKET, 2017-2024 ($MILLION)
FIGURE 44. SOUTH KOREA ACTIVEWEAR MARKET, 2017-2024 ($MILLION)
FIGURE 45. REST OF ASIA-PACIFIC ACTIVEWEAR MARKET, 2017-2024 ($MILLION)
FIGURE 46. BRAZIL ACTIVEWEAR MARKET, 2017-2024 ($MILLION)
FIGURE 47. SAUDI ARABIA ACTIVEWEAR MARKET, 2017-2024 ($MILLION)
FIGURE 48. SOUTH AFRICA ACTIVEWEAR MARKET, 2017-2024 ($MILLION)
FIGURE 49. REST OF LAMEA ACTIVEWEAR MARKET, 2017-2024 ($MILLION)
FIGURE 50. ADIDAS: NET SALES, 2015-2017 ($MILLION)
FIGURE 51. ADIDAS: REVENUE SHARE BY PRODUCT, 2017 (%)
FIGURE 52. ADIDAS: REVENUE SHARE BY SEGMENT, 2017 (%)
FIGURE 53. ASICS: NET SALES, 2015-2017 ($MILLION)
FIGURE 54. ASICS: REVENUE SHARE BY PRODUCT, 2017 (%)
FIGURE 55. ASICS: REVENUE SHARE BY GEOGRAPHY, 2017 (%)
FIGURE 56. COLUMBIA: NET SALES, 2015-2017 ($MILLION)
FIGURE 57. COLUMBIA: REVENUE SHARE BY PRODUCT, 2017 (%)
FIGURE 58. COLUMBIA: REVENUE SHARE BY GEOGRAPHY, 2017 (%)
FIGURE 59. DICK'S: NET SALES, 2015-2017 ($MILLION)
FIGURE 60. DICK'S: REVENUE SHARE BY PRODUCT, 2017 (%)
FIGURE 61. GAP INC.: NET SALES, 2015-2017 ($MILLION)
FIGURE 62. GAP INC.: REVENUE SHARE BY SEGMENT, 2017 (%)
FIGURE 63. GAP INC.: REVENUE SHARE BY GEOGRAPHY, 2017 (%)
FIGURE 64. NIKE: NET SALES, 2015-2017 ($MILLION)
FIGURE 65. NIKE: REVENUE SHARE BY PRODUCT, 2017 (%)
FIGURE 66. NIKE: REVENUE SHARE BY GEOGRAPHY, 2017 (%)
FIGURE 67. PVH CORP.: NET SALES, 2015-2017 ($MILLION)
FIGURE 68. PVH CORP.: REVENUE SHARE BY SEGMENT, 2017 (%)
FIGURE 69. PUMA: NET SALES, 2015-2017 ($MILLION)
FIGURE 70. PUMA: REVENUE SHARE BY PRODUCT, 2017 (%)
FIGURE 71. PUMA: REVENUE SHARE BY GEOGRAPHY, 2017 (%)
FIGURE 72. SKECHERS: NET SALES, 2015-2017 ($MILLION)
FIGURE 73. SKECHERS: REVENUE SHARE BY SEGMENT, 2017 (%)
FIGURE 74. SKECHERS: REVENUE SHARE BY GEOGRAPHY, 2017 (%)
FIGURE 75. UNDER ARMOUR: NET SALES, 2015-2017 ($MILLION)
FIGURE 76. UNDER ARMOUR: REVENUE SHARE BY SEGMENT, 2017 (%)
FIGURE 77. VF: NET SALES, 2015-2017 ($MILLION)
FIGURE 78. VF: REVENUE SHARE BY SEGMENT, 2017 (%)
FIGURE 79. VF: REVENUE SHARE BY GEOGRAPHY, 2017 (%)
Access Full Summery @ https://www.alliedmarketresearch.com/activewear-market?utm_source=OPR
About Us
Allied Market Research (AMR) is a full-service market research and business-consulting wing of Allied Analytics LLP based in Portland, Oregon. Allied Market Research provides global enterprises as well as medium and small businesses with unmatched quality of "Market Research Reports" and "Business Intelligence Solutions.” AMR has a targeted view to provide business insights and consulting to assist its clients to make strategic business decisions and achieve sustainable growth in their respective market domain.
We are in professional corporate relations with various companies and this helps us in digging out market data that helps us generate accurate research data tables and confirms utmost accuracy in our market forecasting. Each and every data presented in the reports published by us is extracted through primary interviews with top officials from leading companies of domain concerned. Our secondary data procurement methodology includes deep online and offline research and discussion with knowledgeable professionals and analysts in the industry.
Contact:
David Correa
5933 NE Win Sivers Drive
#205, Portland, OR 97220
United States
Toll Free (USA/Canada):
+1-800-792-5285, +1-503-894-6022, +1-503-446-1141
UK: +44-845-528-1300
Hong Kong: +852-301-84916
India (Pune): +91-20-66346060
Fax: +1?855?550-5975
help@alliedmarketresearch.com
Web: https://www.alliedmarketresearch.com
This release was published on openPR.
Permanent link to this press release:
Copy
Please set a link in the press area of your homepage to this press release on openPR. openPR disclaims liability for any content contained in this release.
You can edit or delete your press release Activewear Market by Product (Ready to Wear; Fashion Outer, Pants, & T-Shirts; Rash Guard, Wet Suit, & Swim Wear; Shoes (Sports Shoes, Aqua Shoes, Aqua Socks); and Fashion Brand) and Fabric (Polyester, Nylon, Neoprene, Polypropylene, Spandex, Cotton and O here
News-ID: 1492154 • Views: …
More Releases from Allied Market Research
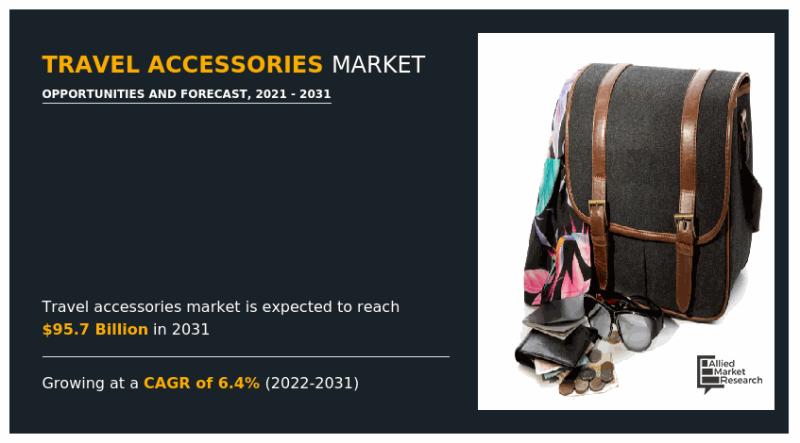
Travel Accessories Industry Performance Metrics: CAGR and USD Comparisons for Co …
Allied Market Research recently published a report, titled, "Travel Accessories Market by Type (Travel Bags, Electronic Accessories, Travel Pillow and Blanket, Toiletries, Others), by Distribution Channel (Supermarkets and Hypermarkets, Specialty Stores, Factory Outlets, Online Stores, Others): Global Opportunity Analysis and Industry Forecast, 2021-2031". As per the report, the global travel accessories industry accounted for $48.2 billion in 2021, and is expected to reach $95.7 billion by 2031, growing at a…

Outdoor Kitchen Cabinets Market Dynamics: Exploring CAGR and USD Impacts on Indu …
According to the report published by Allied Market Research, the global outdoor kitchen cabinets market generated $2.9 billion in 2020, and is projected to reach $5.1 billion by 2030, growing at a CAGR of 5.8% from 2021 to 2030.The report provides an in-depth analysis of the top investment pockets, top winning strategies, drivers & opportunities, market size & estimations, competitive scenario, and wavering market trends.
Increase in expenditure on luxury lifestyle…
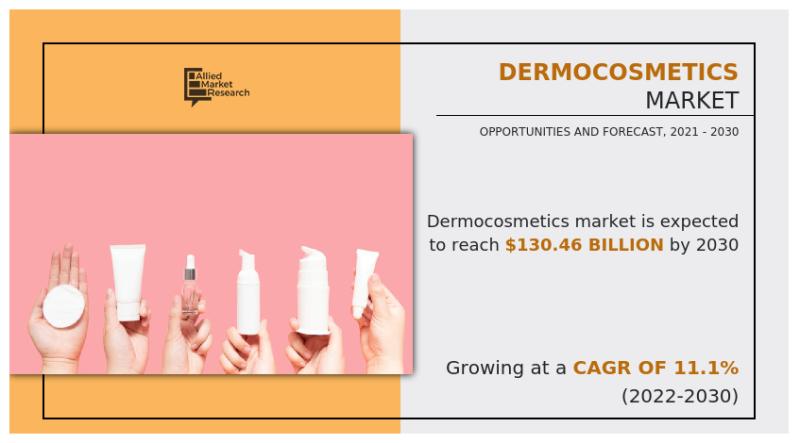
Dermocosmetics Market Research Report : Unveiling CAGR and USD Projections for K …
The global dermocosmetics market size was valued at $51.10 billion in 2021, and is projected to reach $130.46 billion by 2030, growing at a CAGR of 11.1% from 2022 to 2030. Dermocosmetics is a combination of two medical branches i.e., cosmetics and dermatology. Dermocosmetics aids all beauty concerns such as oily skin, dry skin, skin conditions like pimples, acne, marks, blemishes, and others. Evolving role of cosmetics in skin care…
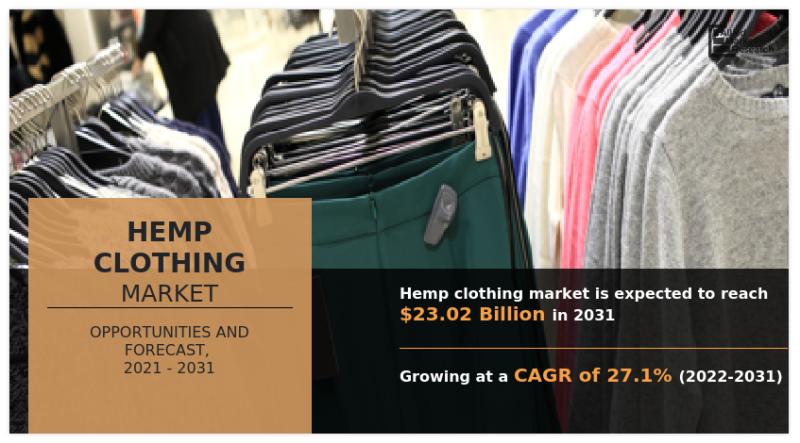
Hemp Clothing Market Projected Expansion to Receive Overwhelming Hike In Revenue …
According to the report published by Allied Market Research, the global hemp clothing market generated $2.29 billion in 2021, and is projected to reach $23.02 billion by 2031, growing at a CAGR of 27.1% from 2022 to 2031.The report offers a detailed analysis of the top winning strategies, evolving market trends, market size and estimations, value chain, key investment pockets, drivers & opportunities, and competitive landscape. The report is a…
More Releases for FIGURE
PVC Figure And Garage Kits Market Size Analysis by Application, Type, and Region …
According to Market Research Intellect, the global PVC Figure And Garage Kits market under the Internet, Communication and Technology category is expected to register notable growth from 2025 to 2032. Key drivers such as advancing technologies, changing consumer behavior, and evolving market dynamics are poised to shape the trajectory of this market throughout the forecast period.
The PVC Figure and Garage Kits market is witnessing substantial growth due to the rising…
Elevating Ice Performance with Premium Figure Skates
The latest collection of figure skates from Figure Skating Store is setting a new standard in ice skating performance.
Designed to meet the needs of skaters at every level, these skates combine advanced technology with expert craftsmanship to enhance every move on the ice.
Key Features of the New Figure Skates
* High-Performance Blades: Precision-engineered stainless steel blades deliver smooth glides, sharp turns, and dependable edge retention.
* Optimized Comfort: Memory foam…
Enhanced Performance with Advanced Figure Skates Technology
For athletes, enthusiasts, and professionals in the world of figure skating, achieving the perfect glide, spin, and jump is about precision and excellence. The latest advancements in figure skates are transforming performance on the ice, providing skaters with cutting-edge technology, unmatched comfort, and unparalleled durability.
Designed for both beginners and elite-level skaters, modern figure skates [https://figureskatingstore.com/skates/] combine innovative materials and engineering to deliver superior support and flexibility. Key features include:
Enhanced Blade…
Enhance Performance with Exquisite Figure Skating Dresses
As figure skating enthusiasts gear up for another exciting season, the importance of elegant and functional figure skating dresses cannot be overstated. These dresses not only enhance a skater's performance but also reflect their unique style and grace on the ice.
Unveiling the Essence of Figure Skating Dresses
Figure skating dresses [https://figureskatingstore.com/dresses/] are more than just attire; they are an extension of a skater's artistry and skill. Designed to blend aesthetics with…
Alexander Estrada Launches Transformative Online Course To Help Barbers Scale Th …
Alexander Estrada launches online course to help barbers scale their businesses to multi 6-figure to7-figure success
Image: https://www.getnews.info/uploads/a07459953886d22459dd28e62253e44b.png
San Clemente, CA - Alexander Estrada, a renowned name in the local barbering community, is set to expand his influence beyond the barber chair. With two highly successful barbershops in San Clemente and Mission Viejo, Estrada's journey from a modest beginning in his mother's garage to becoming a celebrated entrepreneur serves as a beacon…
THE WORLD'S MOST CONTROVERSIAL ACTION FIGURE...EVER!
FOR IMMEDIATE RELEASE
THE WORLD'S MOST CONTROVERSIAL ACTION FIGURE...EVER!
Contact: William Hirsch - Schlock Toys @ +1-949-677-9353 or DocSchlock@SchlockToys.com
Featured on Tomi with Fox News host Tomi Lahren! SCHLOCK TOYS join forces with Kickstarter to Make Toys Great Again!
The Kickstarter campaign page can be found HERE: https://www.kickstarter.com/projects/schlocktoys/collectors-edition-talking-trump-2020-man-of-action-figure/description
“What a great message to be sent, and I think Trump himself would love this and that he’d be excited about it!”
- Tomi Lahren, Fox News
“You…
