Press release
Global E-House Market (2017-2023)-6Wresearch
Global E-House Market (2017-2023)-6Wresearch
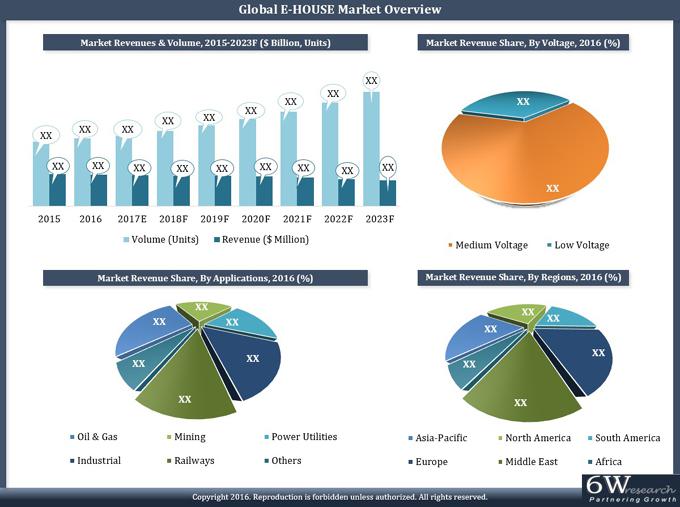
Increasing offshore oil & gas exploration activity, growth in mining and power infrastructure have increased the demand for electrical houses globally. This has been further amplified with the increasing demand for E-Houses arising from the renewable energy sector. Global increase in the rail infrastructure, with dedicated freight corridors being constructed around the world, would also fuel the E-House business globally. The growth of E-House market is primarily driven from investments in oil & gas sector and power sector.
According to 6Wresearch, Global E-House Market Volume is projected to grow at a CAGR of 8.5% during 2017-23. Development of smart grids and establishment of nuclear and renewable energy power plants would fuel the market for E-House in the forecast period. The offshore oil & gas sector accounted for majority of the revenue share in the global E-House market. Over the next six years, the mining, rail infrastructure & transportation segments are forecast to showcase strong growth. Global E-House market is dominated by gas insulated medium voltage segment in 2016.
Download Sample Pages @ https://www.6wresearch.com/market-reports/global-e-house-market-2017-2023-forecast-by-voltage-type-applications-competitive-landscape-electrical-house-systems.html
Amongst all the applications, the oil & gas sector accounts for major share in the year 2016 in the overall Global E-House market. Power utility, mining and industrial sector are other key revenue generating segments.
The report thoroughly covers the market By Voltage, applications and by regions. The report provides an unbiased and detailed analysis of the on-going trends, opportunities/ high growth areas, market drivers, which would help stakeholders to device and align market strategies according to the current and future market dynamics.
Key Highlights of the Report:
• Historical Data of Global E-House Market Revenues & Volume for the Period 2012-2016
• Market Size & Forecast of Global E-House Market Revenues & Volume until 2023
• Historical Data of Asia-Pacific, North America, South America, Europe, Africa and Middle East
E-House Market Revenues & Volume for the Period 2012-2016
• Market Size & Forecast of Asia-Pacific, North America, South America, Europe, Africa and Middle
East E-House Market Revenues & Volume until 2023
• Historical Data of E-House Countries Market Revenues & Volume for the Period 2012-2016
• Market Size & Forecast of E-House Countries Market Revenues & Volume until 2023
• Market Drivers and Restraints
• Market Trends and Developments.
• Market Opportunity Assessment
• Players Market Share and Competitive Landscape
• Company Profiles
• Key Strategic Recommendation
Markets Covered
The report provides the detailed analysis of the following market segments
• By Voltage:
o Medium Voltage E-House
o Low Voltage E-House
• By Applications:
o Oil & Gas
o Industrial
o Infrastructure & Transportation
o Power Utilities
o Mining
o Others
• By Regions:
o Asia Pacific
• China
• Australia
• Indonesia
• Others
o Africa
• South Africa
• Nigeria
• Kenya
• Others
o Europe
• UK
• France
• Germany
• Russia
• Others
o Middle East
• Saudi Arabia
• UAE
• Turkey
• Others
o North America
• US
• Canada
• Mexico
o South America
• Brazil
• Argentina
• Others
Buy Report @ https://tinyurl.com/y9ogt6rc
1. Executive Summary
2. Introduction
2.1. Report Description
2.2. Key Highlights of the Report
2.3. Market Scope & Segmentation
2.4. Methodology Adopted and Key Data Points
2.5. Assumptions
3. Global E-House Market Overview
3.1. Global E-House Market Revenues Vs Volume (2015-2023F)
3.2. Global E-House Market Revenue Share, By Regions, 2016
3.3. Global E-House Market Revenue Share, By Voltage (2016-2023F)
3.4. Global E-House Market Revenue Share, By Applications (2016-2023F)
3.5. Industry Life Cycle
3.6. Porter's Five Forces
4. Global E-House Market Dynamics
4.1. Impact Analysis
4.2. Market Drivers
4.3. Market Restraints
5. Global E-House Market Trends
5.1. Replacement of SF6
5.2. Digitalization of E-House
5.3. Solar E-HOUSE and Standardization of E-House
6. Asia Pacific E-House Market Overview
6.1. Asia Pacific E-House Market Revenues (2015-2023F)
6.2. Asia Pacific E-House Market Volume (2015-2023F)
6.3. Asia Pacific E-House Market Revenue Vs Volume Share, By Voltage (2016)
6.4. Asia Pacific E-House Market Revenue Share, By Applications (2016)
7. Asia Pacific E-House Market Overview, By Country
7.1. China E-House Market Overview
7.1.1. China E-House Market Revenues (2015-2023F)
7.1.2. China E-House Market Volume (2015-2023F)
7.1.3. China Major Upcoming Project
7.2. Australia E-House Market Overview
7.2.1. Australia E-House Market Revenues (2015-2023F)
7.2.2. Australia E-House Market Volume (2015-2023F)
7.2.3. Australia Major Upcoming Project
7.3. Indonesia E-House Market Overview
7.3.1. Indonesia E-House Market Revenues (2015-2023F)
7.3.2. Indonesia E-House Market Volume (2015-2023F)
7.3.3. Indonesia Major Upcoming Project
8. North America E-House Market Overview
8.1. North America E-House Market Revenues (2015-2023F)
8.2. North America E-House Market Volume (2015-2023F)
8.3. North America E-House Market Revenue Vs Volume Share, By Voltage (2016)
8.4. North America E-House Market Revenue Share, By Applications (2016)
9. North America E-House Market Overview, By Country
9.1. USA E-House Market Overview
9.1.1. USA E-House Market Revenues (2015-2023F)
9.1.2. USA E-House Market Volume (2015-2023F)
9.1.3. USA Major Upcoming Project
9.2. Canada E-House Market Overview
9.2.1. Canada E-House Market Revenues (2015-2023F)
9.2.2. Canada E-House Market Volume (2015-2023F)
9.2.3. Canada Major Upcoming Project
9.3. Mexico E-House Market Overview
9.3.1. Mexico E-House Market Revenues (2015-2023F)
9.3.2. Mexico E-House Market Volume (2015-2023F)
9.3.3. Mexico Major Upcoming Project
10. South America E-House Market Overview
10.1. South America E-House Market Revenues (2015-2023F)
10.2. South America E-House Market Volume (2015-2023F)
10.3. South America E-House Market Revenue Vs Volume Share, By Voltage (2016)
10.4. South America E-House Market Revenue Share, By Applications (2016)
11. South America E-House Market Overview, By Country
11.1. Brazil E-House Market Overview
11.1.1. Brazil E-House Market Revenues (2015-2023F)
11.1.2. Brazil E-House Market Volume (2015-2023F)
11.1.3. Brazil Major Upcoming Project
11.2. Argentina E-House Market Overview
11.2.1. Argentina E-House Market Revenues (2015-2023F)
11.2.2. Argentina E-House Market Volume (2015-2023F)
11.2.3. Argentina Major Upcoming Project
12. Europe E-House Market Overview
12.1. Europe E-House Market Revenues (2015-2023F)
12.2. Europe E-House Market Volume (2015-2023F)
12.3. Europe E-House Market Revenue Vs Volume Share, By Voltage (2016)
12.4. Europe E-House Market Revenue Share, By Applications (2016)
13. Europe E-House Market Overview, By Country
13.1. UK E-House Market Overview
13.1.1. UK E-House Market Revenues (2015-2023F)
13.1.2. UK E-House Market Volume (2015-2023F)
13.1.3. UK Major Upcoming Project
13.2. Germany E-House Market Overview
13.2.1. Germany E-House Market Revenues (2015-2023F)
13.2.2. Germany E-House Market Volume (2015-2023F)
13.2.3. Germany Major Upcoming Project
13.3. Russia E-House Market Overview
13.3.1. Russia E-House Market Revenues (2015-2023F)
13.3.2. Russia E-House Market Volume (2015-2023F)
13.3.3. Russia Major Upcoming Project
14. Africa E-House Market Overview
14.1. Africa E-House Market Revenues (2015-2023F)
14.2. Africa E-House Market Volume (2015-2023F)
14.3. Africa E-House Market Revenue Vs Volume Share, By Voltage (2016)
14.4. Africa E-House Market Revenue Share, By Applications (2016)
15. Africa E-House Market Overview, By Country
15.1. South Africa E-House Market Overview
15.1.1. South Africa E-House Market Revenues (2015-2023F)
15.1.2. South Africa E-House Market Volume (2015-2023F)
15.1.3. South Africa Major Upcoming Project
15.2. Nigeria E-House Market Overview
15.2.1. Nigeria E-House Market Revenues (2015-2023F)
15.2.2. Nigeria E-House Market Volume (2015-2023F)
15.2.3. Nigeria Major Upcoming Project
15.3. Kenya E-House Market Overview
15.3.1. Kenya E-House Market Revenues (2015-2023F)
15.3.2. Kenya E-House Market Volume (2015-2023F)
15.3.3. Kenya Major Upcoming Project
16. Middle East E-House Market Overview
16.1. Middle East Market Revenues (2015-2023F)
16.2. Middle East E-House Market Volume (2015-2023F)
16.3. Middle East E-House Market Revenue Vs Volume Share, By Voltage (2016)
16.4. Middle East E-House Market Revenue Share, By Applications (2016)
17. Middle East E-House Market Overview, By Country
17.1. Saudi Arabia E-House Market Overview
17.1.1. Saudi Arabia E-House Market Revenues (2015-2023F)
17.1.2. Saudi Arabia E-House Market Volume (2015-2023F)
17.1.3. Saudi Arabia Major Upcoming Project
17.2. UAE E-House Market Overview
17.2.1. UAE E-House Market Revenues (2015-2023F)
17.2.2. UAE E-House Market Volume (2015-2023F)
17.2.3. UAE Major Upcoming Project
17.3. Turkey E-House Market Overview
17.3.1. Turkey E-House Market Revenues (2015-2023F)
17.3.2. Turkey E-House Market Volume (2015-2023F)
17.3.3. Turkey Major Upcoming Project
18. Global E-House Market Opportunity Assessment
18.1. Global E-House Market Region Wise Opportunity
18.2. Global E-House Market Opportunity in Renewable Energy Sector
19. Competitive Landscape
19.1. Global E-House Market Share, By Company
20. Company Profiles
20.1. ABB Ltd.
20.2. General Electric Company
20.3. Schneider Electric SE
20.4. Siemens AG
20.5. Eaton Corporation
20.6. Powell Industries Inc.
20.7. TGOOD Global Ltd.
20.8. Zest Weg Group
20.9. Electroinnova Installations and Maintenance SL
21. Key Strategic Pointers
22. Disclaimer
List of Figures
Figure 1 Global E-House Market Revenues, 2015-2023F ($ Billion)
Figure 2 Global E-House Market Volumes, 2015-2023F (Thousand Units)
Figure 3 Global E-House Market Revenue Share, By Region, 2016
Figure 4 Global E-House Market Revenue Share, By Voltage, 2016
Figure 5 Global E-House Market Revenue Share, By Voltage, 2023F
Figure 6 Global E-House Market Revenue Share, By Application, 2016
Figure 7 Global E-House Market Revenue Share, By Application, 2023F
Figure 8 Global E-House Market Industry Life Cycle
Figure 9 Global E-House Market Porter's Five Forces
Figure 10 Global Railway Industry Development 2013-2015
Figure 11 Europe Major Railway Projects
Figure 12 North America Major Railway Projects
Figure 13 Asia pacific Major Railway Projects
Figure 14 Middle East and Africa Major Railway Projects
Figure 15 Global Colocation Market Regional Share 2016
Figure 16 Hyperscale Data Centers, By Country 2016
Figure 17 Cost Saving From E-House
Figure 18 Contribution to CO2 Equivalent Emissions
Figure 19 Asia Pacific E-House Market Revenues, 2015-2023F ($ Billion)
Figure 20 Asia Pacific E-House Market Volume, 2015-2023F (Units)
Figure 21 Asia Pacific E-House Market Revenue Share, By Voltage, 2016
Figure 22 Asia Pacific E-House Market Revenue Share, By Voltage, 2023F
Figure 23 Asia Pacific E-House Market Volume Share, By Voltage, 2016
Figure 24 Asia Pacific E-House Market Volume Share, By Voltage, 2023F
Figure 25 Asia Pacific E-House Market Revenue Share, By Applications, 2016
Figure 26 Asia Pacific E-House Market Revenue Share, By Applications, 2023F
Figure 27 China E-House Market Revenues, 2015-2023F ($ Billion)
Figure 28 China E-House Market Revenues, 2015-2023F ($ Billion)
Figure 29 China Major Upcoming Projects
Figure 30 Australia E-House Market Revenues, 2015-2023F ($ Billion)
Figure 31 Australia E-House Market Volume, 2015-2023F (Units)
Figure 32 Australia Major Upcoming Projects
Figure 33 Indonesia E-House Market Revenues, 2015-2023F ($ Billion)
Figure 34 Indonesia E-House Market Volume, 2015-2023F (Units)
Figure 35 Indonesia Major Upcoming Projects
Figure 36 North America E-House Market Revenues, 2015-2023F ($ Billion)
Figure 37 North America E-House Market Volume, 2015-2023F (Units)
Figure 38 North America E-House Market Revenue Share, By Voltage, 2016
Figure 39 North America E-House Market Revenue Share, By Voltage, 2023F
Figure 40 North America E-House Market Volume Share, By Voltage, 2016
Figure 41 North America E-House Market Volume Share, By Voltage, 2023F
Figure 42 North America E-House Market Revenue Share, By Applications, 2016
Figure 43 North America E-House Market Revenue Share, By Applications, 2023F
Figure 44 USA E-House Market Revenues, 2015-2023F ($ Billion)
Figure 45 USA E-House Market Volume, 2015-2023F (Units)
Figure 46 USA Major Upcoming Projects
Figure 47 Canada E-House Market Revenues, 2015-2023F ($ Billion)
Figure 48 Canada E-House Market Volume, 2015-2023F (Units)
Figure 49 Canada Major Upcoming Projects
Figure 50 Mexico E-House Market Revenues, 2015-2023F ($ Billion)
Figure 51 Mexico E-House Market Volume, 2015-2023F (Units)
Figure 52 Mexico Major Upcoming Projects
Figure 53 South America E-House Market Revenues, 2015-2023F ($ Billion)
Figure 54 South America E-House Market Volume, 2015-2023F (Units)
Figure 55 South America E-House Market Revenue Share , By Voltage, 2016
Figure 56 South America E-House Market Revenue Share , By Voltage, 2023F
Figure 57 South America E-House Market Revenue Share , By Volume, 2016
Figure 58 South America E-House Market Revenue Share , By Volume, 2023F
Figure 59 South America E-House Market Revenue Share, By Applications, 2016
Figure 60 South America E-House Market Revenue Share, By Applications, 2023F
Figure 61 Brazil E-House Market Revenues, 2015-2023F ($ Billion)
Figure 62 Brazil E-House Market Volume, 2015-2023F (Units)
Figure 63 Brazil Major Upcoming Projects
Figure 64 Argentina E-House Market Revenues, 2015-2023F ($ Billion)
Figure 65 Argentina E-House Market Volume, 2015-2023F (Units)
Figure 66 Argentina Major Upcoming Projects
Figure 67 Europe E-House Market Revenues, 2015-2023F ($ Billion)
Figure 68 Europe E-House Market Volume, 2015-2023F (Units)
Figure 69 Europe E-House Market Revenue Share, By Voltage, 2016
Figure 70 Europe E-House Market Revenue Share, By Voltage, 2023F
Figure 71 Europe E-House Market Revenue Share, By Volume, 2016
Figure 72 Europe E-House Market Revenue Share, By Volume, 2023F
Figure 73 Europe E-House Market Revenue Share, By Applications, 2016
Figure 74 Europe E-House Market Revenue Share, By Applications, 2023F
Figure 75 UK E-House Market Revenues, 2015-2023F ($ Billion)
Figure 76 UK E-House Market Volume, 2015-2023F (Units)
Figure 77 UK Major Upcoming Projects
Figure 78 Germany E-House Market Revenues, 2015-2023F ($ Billion)
Figure 79 Germany E-House Market Volume, 2015-2023F (Units)
Figure 80 Germany Major Upcoming Projects
Figure 81 Russia E-House Market Revenues, 2015-2023F ($ Billion)
Figure 82 Russia E-House Market Volume, 2015-2023F (Units)
Figure 83 Russia Major Upcoming Projects
Figure 84 Africa E-House Market Revenues, 2015-2023F ($ Billion)
Figure 85 Africa E-House Market Volume, 2015-2023F (Units)
Figure 86 Africa E-House Market Revenue Share, By Voltage, 2016
Figure 87 Africa E-House Market Revenue Share, By Voltage, 2023F
Figure 88 Africa E-House Market Revenue Share, By Volume, 2016
Figure 89 Africa E-House Market Revenue Share, By Voltage, 2023F
Figure 90 Africa E-House Market Revenue Share, By Applications, 2016
Figure 91 Africa E-House Market Revenue Share, By Applications, 2023F
Figure 92 South Africa E-House Market Revenues, 2015-2023F ($ Billion)
Figure 93 South Africa E-House Market Volume, 2015-2023F (Units)
Figure 94 South Africa Major Upcoming Projects
Figure 95 Nigeria E-House Market Revenues, 2015-2023F ($ Billion)
Figure 96 Nigeria E-House Market Volume, 2015-2023F (Units)
Figure 97 Nigeria Major Upcoming Projects
Figure 98 Kenya E-House Market Revenues, 2015-2023F ($ Billion)
Figure 99 Kenya E-House Market Volume, 2015-2023F (Units)
Figure 100 Kenya Major Upcoming Projects
Figure 101 Middle East E-House Market Revenues, 2015-2023F ($ Billion)
Figure 102 Middle East E-House Market Volume, 2015-2023F (Units)
Figure 103 Middle East E-House Market Revenue Share, By Voltage, 2016
Figure 104 Middle East E-House Market Revenue Share, By Voltage, 2023F
Figure 105 Middle East E-House Market Revenue Share, By Volume, 2016
Figure 106 Middle East E-House Market Revenue Share, By Volume, 2023F
Figure 107 Middle East E-House Market Revenue Share, By Applications, 2016
Figure 108 Middle East E-House Market Revenue Share, By Applications, 2023F
Figure 109 Saudi Arabia E-House Market Revenues, 2015-2023F ($ Billion)
Figure 110 Saudi Arabia E-House Market Volume, 2015-2023F (Units)
Figure 111 UAE Major Upcoming Projects
Figure 112 UAE E-House Market Revenues, 2015-2023F ($ Billion)
Figure 113 UAE E-House Market Volume, 2015-2023F (Units)
Figure 114 UAE Major Upcoming Projects
Figure 115 Turkey E-House Market Revenues, 2015-2023F ($ Billion)
Figure 116 Turkey E-House Market Volume, 2015-2023F (Units)
Figure 117 Turkey Major Upcoming Projects
Figure 118 Global E-House Market Region Wise Opportunity
Figure 119 Country wise Renewable Energy Sector Investments, 2016
Figure 120 Global E-House Market Share, By Company, 2016
For Detailed Description and Purchase Options Visit@ https://www.6wresearch.com/market-reports/global-e-house-market-2017-2023-forecast-by-voltage-type-applications-competitive-landscape-electrical-house-systems.html
Related Topic
Saudi Arabia Package Substation Market (2016-2022): Market Forecast by Types (Less than 36KV and 36KV to 150KV), Verticals (Industrial, Public Infrastructure, Residential, Power Utilities and Others), Regions (Central, Western, Eastern and Southern) and Competitive Landscape
ABOUT US
6Wresearch is the premier, one stop market intelligence and advisory center, known for its best in class business research and consulting activity. We provide industry research reports and consulting service across different industries and geographies which provide industry players an in-depth coverage and help them in decision making before investing or enter into a particular geography.
For Further details, please contact:
Email Us: sales@6wresearch.com
Call Now: +91-11-30-424-305
6Wresearch is the premier, one stop market intelligence and advisory center, known for its best in class business research and consulting activity. We provide industry research reports and consulting service across different industries and geographies which provide industry players an in-depth coverage and help them in decision making before investing or enter into a particular geography.
1107-1108, PEARLS BEST HEIGHTS
TOWER 1, NETAJI SUBHASH PLACE
PITAMPURA
This release was published on openPR.
Permanent link to this press release:
Copy
Please set a link in the press area of your homepage to this press release on openPR. openPR disclaims liability for any content contained in this release.
You can edit or delete your press release Global E-House Market (2017-2023)-6Wresearch here
News-ID: 1351070 • Views: …
More Releases from 6Wresearch- Market Intelligence Solutions

Why the Global Wall Clock Market is Growing Steadily with Advancements in Design …
The global wall clock market has experienced consistent growth in recent years, which is driven by a combination of evolving consumer preferences, home decor trends, and advancements in clock technology. Wall clocks, once considered functional household items, are now becoming stylish decor pieces that improve the aesthetics of living rooms, offices, and other spaces. The increasing emphasis on home decoration, as well as the growing focus on convenience and time…

Why the Global Windows Market is Growing Steadily with Advancements in Technolog …
The global windows market has been witnessing a steady growth over the years. This growth is due to some major factors, such as construction activities are increasing and technological upgradation in window manufacturing. Furthermore, the demand for energy-efficient solutions has increased, which leads to a positive impact on the market growth. Windows are considered an important part of residential, commercial, and industrial buildings, which contribute to aesthetic appeal, ventilation, and…

Why the Global Wine Market is Growing Steadily with Innovations in Production an …
Wine is known for its antioxidant properties, especially red wine, which is considered healthy for the heart health. It has diverse ranges and flavors, which attracts wider consumer base. The global wine market has been experiencing a steady growth over the years. This growth is due to some key drivers, such as increasing wine consumption rate globally and increasing income levels of middle class population that allow consumers to spend…

Why the Global Semiconductor Market is Expanding Rapidly with Technological Adva …
The global semiconductor market is estimated to grow in the coming years as it is driven by some major factors, such as increasing demand across various industries such as consumer electronics, automotive, telecommunications, and industrial automation and e rising adoption of advanced technologies such as 5G, AI, and IoT. Other factor contributing to the market growth are a surge in demand for faster, smaller, and more energy-efficient chips, and innovations…
More Releases for Figure
PVC Figure And Garage Kits Market Size Analysis by Application, Type, and Region …
According to Market Research Intellect, the global PVC Figure And Garage Kits market under the Internet, Communication and Technology category is expected to register notable growth from 2025 to 2032. Key drivers such as advancing technologies, changing consumer behavior, and evolving market dynamics are poised to shape the trajectory of this market throughout the forecast period.
The PVC Figure and Garage Kits market is witnessing substantial growth due to the rising…
Elevating Ice Performance with Premium Figure Skates
The latest collection of figure skates from Figure Skating Store is setting a new standard in ice skating performance.
Designed to meet the needs of skaters at every level, these skates combine advanced technology with expert craftsmanship to enhance every move on the ice.
Key Features of the New Figure Skates
* High-Performance Blades: Precision-engineered stainless steel blades deliver smooth glides, sharp turns, and dependable edge retention.
* Optimized Comfort: Memory foam…
Enhanced Performance with Advanced Figure Skates Technology
For athletes, enthusiasts, and professionals in the world of figure skating, achieving the perfect glide, spin, and jump is about precision and excellence. The latest advancements in figure skates are transforming performance on the ice, providing skaters with cutting-edge technology, unmatched comfort, and unparalleled durability.
Designed for both beginners and elite-level skaters, modern figure skates [https://figureskatingstore.com/skates/] combine innovative materials and engineering to deliver superior support and flexibility. Key features include:
Enhanced Blade…
Enhance Performance with Exquisite Figure Skating Dresses
As figure skating enthusiasts gear up for another exciting season, the importance of elegant and functional figure skating dresses cannot be overstated. These dresses not only enhance a skater's performance but also reflect their unique style and grace on the ice.
Unveiling the Essence of Figure Skating Dresses
Figure skating dresses [https://figureskatingstore.com/dresses/] are more than just attire; they are an extension of a skater's artistry and skill. Designed to blend aesthetics with…
Alexander Estrada Launches Transformative Online Course To Help Barbers Scale Th …
Alexander Estrada launches online course to help barbers scale their businesses to multi 6-figure to7-figure success
Image: https://www.getnews.info/uploads/a07459953886d22459dd28e62253e44b.png
San Clemente, CA - Alexander Estrada, a renowned name in the local barbering community, is set to expand his influence beyond the barber chair. With two highly successful barbershops in San Clemente and Mission Viejo, Estrada's journey from a modest beginning in his mother's garage to becoming a celebrated entrepreneur serves as a beacon…
THE WORLD'S MOST CONTROVERSIAL ACTION FIGURE...EVER!
FOR IMMEDIATE RELEASE
THE WORLD'S MOST CONTROVERSIAL ACTION FIGURE...EVER!
Contact: William Hirsch - Schlock Toys @ +1-949-677-9353 or DocSchlock@SchlockToys.com
Featured on Tomi with Fox News host Tomi Lahren! SCHLOCK TOYS join forces with Kickstarter to Make Toys Great Again!
The Kickstarter campaign page can be found HERE: https://www.kickstarter.com/projects/schlocktoys/collectors-edition-talking-trump-2020-man-of-action-figure/description
“What a great message to be sent, and I think Trump himself would love this and that he’d be excited about it!”
- Tomi Lahren, Fox News
“You…
