Press release
Small businesses to slash advertising and travel spend
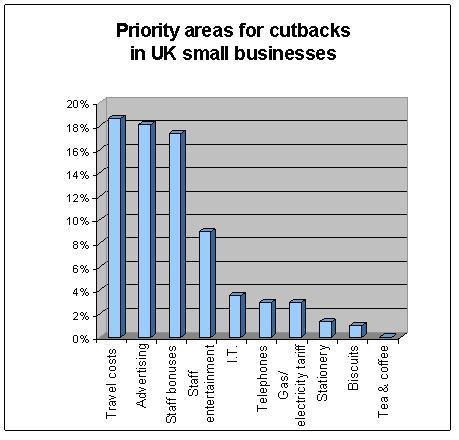
Graph to show small business cutbacks
The YouGov survey, commissioned by independent electricity supplier Opus Energy, polled over 500 small business owners and managers to discover where they would be cutting back during the current economic downturn. Business travel and advertising spend were top of the list for budget cuts in nearly one in five small businesses (19 and 18% respectively).
The survey also found that the larger the company, the more likely it is that staff will face cuts to their bonuses. Indeed, a third (33%) of the largest companies surveyed (employing up to 50 people) said that employee bonuses would be the first area they would rein in.
Interestingly, when asked which areas cutbacks were the least likely during recession, a quarter of small businesses (25%) were adamant they would not reduce spending on IT. Employees can also rest assured that day to day staff perks were the second least likely area to face cutbacks during difficult times. 16% of managers vowed not to reduce spending on extras for employees such as biscuits, tea and coffee and entertainment, which can help maintain vital staff morale particularly in a gloomy economic climate.
Andy Nash, Operations Director at Opus Energy said, “While some value can be had from trimming excess spending on business travel and advertising budgets, it is surprising that a review of utility bills does not appear higher up the list. Only 3% of small businesses said they would review their gas or electricity tariffs in order to make business savings. This widely overlooked area can provide vital savings for companies and make more of an impact on their bottom line than other areas. Indeed, Carbon Trust research shows that simply monitoring energy efficiency in the workplace could help companies save over 12% on their bills."
Notes to Editors
All figures, unless otherwise stated, are from YouGov Plc. Total sample size was 536 adults who are private sector workers in companies of fewer than 50 employees who are senior management level or above, with major decision making input in at least one of the following areas: Advertising/ Direct Marketing / PR, Business Development/ Sales, Company credit/ charge cards, Company mobile phones, Company Pension Scheme, Finance/ Accounting, HR/ Personnel, IT/ Telecoms, Line of Production/ Operations, Procurement/ purchasing, Recruitment, Training & Development. Fieldwork was undertaken between 3rd - 8th December 2008. The survey was carried out online
Carbon Trust, Smart metering
The Carbon Trust recently undertook smart metering trials and the results
showed that smart metering, when combined with consumption data and
energy-saving advice, could give potential average savings of 12%. http://www.carbontrust.co.uk/technology/technologyaccelerator/advanced_metering.htm
About Opus Energy
Opus Energy is a leading independent supplier of electricity offering tailor-made solutions for the UK SME and corporate markets. Its market-leading innovations are driven by customer needs and the company is committed to helping businesses become more environmentally responsible through procurement of energy from cleaner sources.
Opus Energy has over 40,000 customers across all sectors. Large customers include: Yell Group, Thorntons, Farmfoods, Cumbria County Council and Deloitte & Touche.
Over the last two years (between April 2006 and March 2008), 62% of the energy supplied by Opus Energy to its customers came from cleaner, low-carbon sources – 54% from renewable generators and 8% from cleaner Combined Heat and Power (CHP) produced by CHP generators. These CHP generators have been awarded accreditation by the regulator, Ofgem, for producing cleaner, more environmentally friendly power.
Opus Energy’s management team has a 50 percent stake in the business, while International Power Plc (LSE:IPR.L) holds 30 percent and Telecom Plus Plc (LSE: TEP.L ) has 20 percent. With offices in Northampton and Oxford, it employs 200 people.
For further information, please see www.opusenergy.com
Opus Energy Limited
Opus House
285 Banbury Road
Oxford
OX2 7JF
Opus Energy Press Office
Georgina Ruttle / Susie Patterson
T. 0207 269 7255 / 7233
E. georgina.ruttle@fd.com / susie.patterson@fd.com
This release was published on openPR.
Permanent link to this press release:
Copy
Please set a link in the press area of your homepage to this press release on openPR. openPR disclaims liability for any content contained in this release.
You can edit or delete your press release Small businesses to slash advertising and travel spend here
News-ID: 65357 • Views: …
More Releases for Graph
Gold Price Trend Analysis, graph and chart
Gold has long been regarded as one of the most valuable and reliable assets in the global financial system. Traditionally viewed as a safe-haven investment, gold plays a crucial role in portfolios during periods of economic uncertainty, inflation, currency volatility, and geopolitical tensions. Analyzing the gold price trend is essential for investors, policymakers, jewellers, central banks, and commodity market participants to understand market direction and make informed decisions.
Enquire for Regular…
Emerging Trends Influencing The Growth Of The Graph Technology Market: Innovatio …
The Graph Technology Market Report by The Business Research Company delivers a detailed market assessment, covering size projections from 2025 to 2034. This report explores crucial market trends, major drivers and market segmentation by [key segment categories].
How Big Is the Graph Technology Market Size Expected to Be by 2034?
The size of the graph technology market has seen substantial growth in the recent past. From a value of $5.26 billion in…
Prominent Graph Technology Market Trend for 2025: Innovations In Graph Technolog …
How Are the key drivers contributing to the expansion of the graph technology market?
The graph technology market's expansion is anticipated to be fueled by the ever-growing Internet of Things (IoT). The Internet of Things, or IoT, is a system of interconnected devices equipped with sensors, software, and various other technologies that allow them to share and collect data with other devices and structures via the internet. The progress is being…
Graph Database Market Size & Trends To 2030
The Graph Database Market 2024 Report makes available the current and forthcoming technical and financial details of the industry. It is one of the most comprehensive and important additions to the Prudent Markets archive of market research studies. It offers detailed research and analysis of key aspects of the global Graph Database market. This report explores all the key factors affecting the growth of the global Graph Database market, including…
Polyacrylamide Prices, Chart, Index, Graph and Forecast
𝐏𝐨𝐥𝐲𝐚𝐜𝐫𝐲𝐥𝐚𝐦𝐢𝐝𝐞 𝐏𝐫𝐢𝐜𝐞 𝐈𝐧 𝐔𝐒𝐀
𝐔𝐧𝐢𝐭𝐞𝐝 𝐒𝐭𝐚𝐭𝐞𝐬: 2680 USD/MT (Polyacrylamide Anionic Grade)
The price of polyacrylamide in the USA reached 2680 USD/MT (Polyacrylamide Anionic Grade) in Q4 of 2023. The market in the country saw a bearish trend, with high supply and low demand.
The latest IMARC Group report, " 𝐏𝐨𝐥𝐲𝐚𝐜𝐫𝐲𝐥𝐚𝐦𝐢𝐝𝐞 𝐏𝐫𝐢𝐜𝐞𝐬, 𝐓𝐫𝐞𝐧𝐝, 𝐂𝐡𝐚𝐫𝐭, 𝐃𝐞𝐦𝐚𝐧𝐝, 𝐌𝐚𝐫𝐤𝐞𝐭 𝐀𝐧𝐚𝐥𝐲𝐬𝐢𝐬, 𝐍𝐞𝐰𝐬, 𝐇𝐢𝐬𝐭𝐨𝐫𝐢𝐜𝐚𝐥 𝐚𝐧𝐝 𝐅𝐨𝐫𝐞𝐜𝐚𝐬𝐭 𝐃𝐚𝐭𝐚 𝐑𝐞𝐩𝐨𝐫𝐭 𝟐𝟎𝟐𝟒 𝐄𝐝𝐢𝐭𝐢𝐨𝐧," presents a detailed analysis of Polyacrylamide Prices, offering key insights…
Graph Database Market: Navigating Data Dynamics: Insights into the Graph Databas …
Graph Database Market Overview:
Maximize Market Research is a research firm that has published a detailed analysis of the "Graph Database Market". MMR in-depth market assessments in research reports take into account significant technological advancements in the sector. In addition to other areas of expertise, focuses on the analysis of high-tech systems and advanced production systems. The Graph Database market report includes key business insights, demand analysis, pricing analysis, and competitive…
