


Press release
E-Waste Plant Setup Cost 2026: Processing Business Plan, Startup Investment & Profitability Analysis
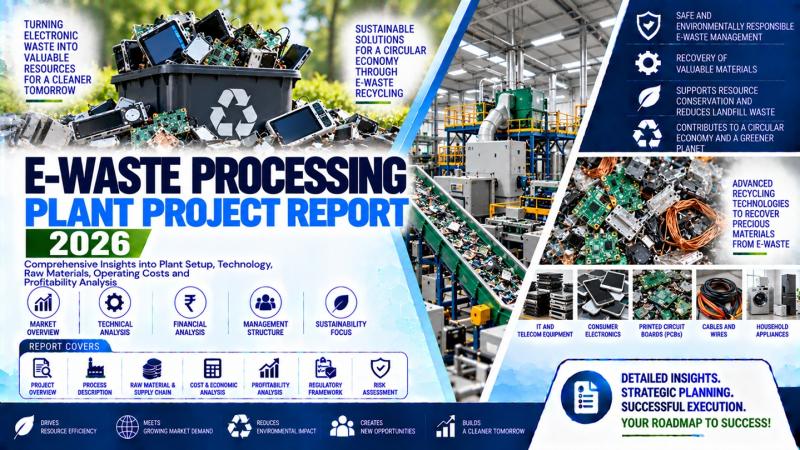
This business plan report covers what capacity to target, which raw materials to secure, what machinery and site conditions are required, how capital and operating costs break down, and what profitability and regulatory factors determine commercial viability for an e-waste processing plant. It draws on IMARC Group's E-Waste Processing Plant Project Report 2026, which benchmarks a facility with an annual processing capacity ranging between 10,000-20,000 MT.
Minimum Cost Required to Set Up an E-Waste Processing Plant
Cost Breakdown by Plant Scale
• Small-Scale E-Waste Processing Plant (USD 2M-5M): Capacity: 3,000-5,000 tonnes/year. Suitable for collection and receipt, depollution, manual dismantling, shredding, size reduction, magnetic and eddy-current separation, air classification, screening, basic metal and plastic recovery, storage, and packaging systems. IMARC notes that plant investment varies with processing capacity, technology, and location.
• Mid-Sized E-Waste Processing Plant (USD 6M-12M): Capacity: 7,500-12,500 tonnes/year. Includes automated dismantling, shredding and granulation, magnetic and eddy-current separation, air and optical sorting, PCB processing, dust and fume extraction, downstream material recovery, utilities, wastewater treatment, storage, and semi/fully automated processing systems.
• Large-Scale E-Waste Processing Plant (USD 15M-30M+): Capacity: 20,000-30,000+ tonnes/year. Designed for high-volume processing with integrated dismantling, depollution and data destruction, advanced shredding and separation, PCB and precious-metal recovery, hydrometallurgical or pyrometallurgical processing, refining, residue treatment, automated material handling, environmental-control systems, and bulk storage. IMARC's 2026 benchmark e-waste processing facility is designed around 10,000-20,000 MT/year, while its India-focused guidance discusses facilities up to 30,000 TPA.
Request Sample: https://www.imarcgroup.com/e-waste-manufacturing-plant-project-report/requestsample
1. Why E-Waste Processing Matters in 2026
E-waste processing sits at the center of the global shift toward a circular, secure secondary-materials supply chain. Rising volumes of discarded electronic and electrical equipment - which contain numerous valuable and toxic materials, including copper, aluminum, precious metals, gold, rare earth elements, and toxic substances such as lead, mercury, and cadmium - have pushed regulators, electronics manufacturers, and metal refiners toward organized processing infrastructure, since improper disposal can cause serious environmental harm. Demand is being pulled from two directions: rapid growth in electronic consumption and shorter product lifecycles, and stricter e-waste regulations worldwide.
Regulatory and critical-mineral security pressure are significant accelerants. Regulators are enforcing stricter end-of-life compliance through EPR and WEEE-style requirements, forcing more material into streams of certified processing and official collection, and the EU, for instance, aims to meet 25% of its demand for critical minerals through recycling by 2030, strengthening investment and legislative momentum around high-recovery recycling. Rapid growth in electric vehicles, renewable energy systems, and digital data infrastructure is sharply increasing demand for secondary metals and critical raw materials used in batteries, power electronics, and energy storage systems - a trajectory that is expected to strengthen demand for e-waste processing capacity across the forecast period.
Against this backdrop, the global e-waste management market's projected climb from USD 88.88 Billion (2025) to USD 229.21 Billion (2034) reflects sustained, regulation- and critical-mineral-backed demand rather than a cyclical spike - which is what makes new capacity additions commercially attractive right now.
Why Invest in E-Waste Processing?
Four factors make e-waste processing a comparatively attractive specialty materials-recovery investment relative to virgin-mineral extraction and other recovery methods:
• Critical for environmental protection: E-waste processing is essential to prevent hazardous substances such as lead, mercury, and cadmium from contaminating soil, water, and air, thereby reducing environmental pollution and public health risks.
• Recovery of valuable materials: Electronic waste contains recoverable metals such as copper, aluminum, gold, and rare earth elements, making processing economically important for resource conservation and reducing dependence on primary mining.
• Support for circular economy and sustainability: Proper e-waste processing enables reuse, recycling, and material recovery, minimizing landfill waste and supporting circular economy initiatives focused on sustainable resource management.
• Compliance with global regulations and rising volumes: Rapid growth in electronic consumption and stricter e-waste regulations worldwide are increasing the need for organized processing infrastructure, creating opportunities for capacity expansion and technological innovation.
2. What is E-Waste and Where is It Processed
"Electronic waste," or "e-waste," is electronic and electrical equipment that is no longer useful. Some electronic and electrical equipment that can be considered e-waste include computers, mobile phones, televisions, fridges, and other electronic equipment. These wastes have numerous valuable and toxic materials, including copper, aluminum, precious metals, gold, rare earth elements, and toxic materials in the form of lead, mercury, cadmium, and other heavy metals. Improper disposal of e-waste can cause serious harm to the surroundings; therefore, the increasing usage of electronic equipment has made the management of these electronic wastes an important task. Its application footprint spans several high-value sectors:
• Metal recovery or refining: Large-scale recycling of waste electronics for recovery of precious metals like copper, aluminum, gold, silver, and rare earths, which are then reused in making electronic products, autos, and industrial machinery.
• Plastics recycling: Plastics recycled from electronic waste are used in the manufacture of consumer products, auto parts, construction materials, and packaging materials.
• E-waste component recycling: Recycling of batteries, circuit boards, and other components of electronic devices so that the disposal of critical materials does not result in environmentally unsafe leakage.
• Environmental protection and waste management: Processed e-waste decompresses landfills and inhibits the entry of poisonous materials into the soil, atmosphere, and water.
• Secondary raw materials availability: Recycled materials from e-waste are used as secondary raw materials in production sectors, thereby promoting the concept of the circular economy.
This diversified end-use base supports steady demand even as adoption timelines vary by sector.
3. E-Waste Processing Process
E-waste processing follows a defined sequence of unit operations, centered on dismantling, shredding, physical separation, and downstream recovery:
• Collection and receipt - e-waste is collected and received at the facility using conveyors and bunkers.
• Depollution and data destruction - hazardous components are removed using depollution tools, and data-bearing devices are processed using secure data destruction equipment.
• Manual dismantling - devices are dismantled at manual dismantling stations to separate reusable and hazardous components.
• Shredding and size reduction - remaining material is reduced using shredders, crushers, granulators, and mills.
• Physical separation - shredded material is separated using magnetic separators, eddy current separators, air classifiers, screening equipment, and optical or laser sorting systems.
• Downstream recovery - separated fractions undergo hydrometallurgical and/or pyrometallurgical recovery using furnaces, kilns, and leaching or reactor systems.
• Refining and residue treatment - recovered materials are refined, and residues are treated using dust collection systems, scrubbers, and effluent treatment systems.
A robust quality assurance system should run in parallel, using analytical instruments to monitor product concentration, purity, and stability, with documentation maintained for traceability and regulatory compliance.
Speak to analyst for customized report: https://www.imarcgroup.com/request?type=report&id=19345&flag=C
4. Raw Materials and Sourcing
Reliable feedstock supply is the single most important operating input for an e-waste processing plant, given that raw materials account for a substantial share of operating expenses (more on this in Section 8). Core raw material and process inputs include:
• Discarded electronic components such as circuit boards, wires, and batteries (primary feedstock)
• Plastics
• Metals such as gold, copper, and aluminium recoverable from obsolete devices like computers, phones, and appliances
Sourcing strategy should prioritize suppliers close to the plant to minimize transportation costs, alongside long-term contracts that stabilize pricing and secure supply continuity. Supply chain and sustainability risk should be assessed as part of supplier selection, since feedstock volatility flows directly into margin.
5. Site Selection and Plant Layout
Site selection for an e-waste processing business should prioritize:
• Proximity to raw materials - easy access to electronic waste collection streams.
• Proximity to target markets - minimizing distribution costs for recovered materials.
• Infrastructure robustness - reliable transportation, utilities, and waste management systems.
• Regulatory fit - compliance with local zoning laws and environmental regulations.
Plant layout should be optimized for workflow efficiency, safety, and minimal material handling, with clearly separated zones for raw material storage, production, quality control, and finished goods storage. Sponsors should reserve space for future expansion, since e-waste processing plants - like most materials-recovery facilities - tend to scale capacity over their operating life.
6. Machinery and Equipment Requirements
Key equipment categories for an e-waste processing plant include:
• Conveyors and bunkers
• Manual dismantling stations, depollution tools, and secure data destruction equipment
• Shredders, crushers, granulators, and mills
• Magnetic separators, eddy current separators, air classifiers, and optical/laser sorting
• Dust collection systems and scrubbers
• Furnaces/kilns and leaching/reactor systems
All machinery should be corrosion-resistant and comply with industry standards for safety, efficiency, and reliability - a material consideration given the hazardous-material handling and mixed-material processing requirements of e-waste recovery. Equipment selection and automation level are the primary determinants of machinery cost, the largest single component of capital expenditure (see Section 7).
7. Capital Investment (CapEx) for an E-Waste Processing Plant
Total capital investment for an e-waste processing plant setup depends on plant capacity, technology selection, and location, and covers land acquisition, site preparation, and necessary infrastructure. IMARC's cost analysis breaks CapEx into four categories:
Land and Site Development Costs: These include expenses related to land registration, boundary development, site preparation, and other associated charges required to prepare the location for plant construction.
Civil Works Costs: This category covers the construction of production halls, storage facilities, and other supporting civil infrastructure necessary for plant operations.
Machinery Costs: Machinery generally represents the largest single component of total CapEx. For an e-waste processing plant, this includes equipment such as shredders, crushers, granulators, magnetic and eddy current separators, optical/laser sorting systems, and furnaces or leaching/reactor systems.
Other Capital Costs: These include pre-operative expenses and other miscellaneous capital items required before the plant becomes fully operational.
Machinery costs account for the largest portion of total capital expenditure, while land and site development costs - covering registration, boundary development, and related charges - form a substantial part of the overall investment as well. Because the exact split varies significantly with capacity, technology, and location, sponsors evaluating a specific project should work from a capacity- and location-specific cost model rather than a generic industry average.
8. Operating Cost (OpEx) Structure
Operating expenditure for an e-waste processing plant is dominated by feedstock cost. Based on IMARC's analysis:
Raw Materials: Raw materials account for approximately 40-50% of total OpEx. Electronic waste is the primary driver within this category.
Utilities: Utilities contribute around 20-25% of total OpEx and include the electricity, water, and other utility requirements associated with shredding, separation, and downstream recovery operations.
Other Operating Expenses: The remaining operating expenditure comprises transportation, packaging, salaries and wages, depreciation, taxes, and other operational expenses required to maintain the plant and support day-to-day processing activities.
This cost structure has a direct strategic implication: raw material procurement strategy is the primary lever for OpEx control in an e-waste processing plant, though utility efficiency also plays a materially larger role here than in many other recovery operations, given the energy intensity of shredding and pyrometallurgical/hydrometallurgical processing. In year one, operating costs cover raw materials, utilities, depreciation, taxes, packing, transportation, and repairs and maintenance; by year five, total operational cost is expected to increase substantially due to inflation, market fluctuations, and potential rises in the cost of key materials, alongside supply chain disruptions and shifts in the global economy.
Buy Now: https://www.imarcgroup.com/checkout?id=19345&method=2175
9. Profitability and Financial Outlook
An e-waste processing plant demonstrates healthy profitability potential under normal operating conditions, supported by stable demand and value-added applications:
• Gross Profit Margin: 30-40%
• Net Profit Margin: 12-18%
Financial projections for a specific project should be developed from realistic assumptions on capital investment, operating costs, capacity utilization, pricing trends, and demand outlook, and should incorporate ROI, net present value (NPV), payback period, and a full profit-and-loss analysis rather than relying on the industry-average margins above. Break-even in an e-waste processing business typically ranges from 3 to 5 years, depending on processing capacity, material recovery rates, operational efficiency, and market prices for recovered metals; strategic partnerships and high recovery rates can accelerate profitability. These averages are useful for feasibility screening, not financing-stage decisions.
10. Regulatory and Policy Landscape
Regulatory tailwinds are one of the strongest arguments for new e-waste processing capacity right now. Extended Producer Responsibility (EPR) and WEEE-style legislation are forcing more material into certified processing and official collection streams, while critical mineral security has emerged as a strategic priority for governments seeking to reduce reliance on primary mining and imports. Processing facilities are increasingly deploying automation, robotics, and AI-enabled sorting systems to improve throughput, recovery yields, and operational safety while reducing reliance on manual labor.
Beyond application-driven demand, project sponsors should plan for:
• Business registration and factory licensing
• Environmental clearances
• Fire safety certifications
• Industry-specific permits, which vary by local, state, and national jurisdiction
Government incentives - capital subsidies, tax exemptions, reduced utility tariffs, export benefits, or interest subsidies - may also be available depending on the region and should be factored into project financing. The typical timeline to start an e-waste processing plant ranges from 12 to 18 months, depending on factors like scale, regulatory approvals, equipment setup, and environmental clearances.
11. Latest Industry Developments
September 2025: Aurubis AG, the largest copper producer in Europe, began production at its recently constructed metal recycling facility in Richmond, Georgia. With production scheduled to reach full capacity in the first half of 2026, the factory is anticipated to lessen the requirement for U.S. metal imports and significantly expands onshore capacity to recover copper, precious metals, and other strategic elements from e-waste streams.
August 2024: ERI, a cybersecurity-focused hardware destruction firm and the largest fully integrated IT and electronics asset disposition (ITAD) provider in the country, announced the opening of its first alkaline battery recycling facility. Millions of pounds of electronic waste are sustainably recycled annually at ERI's 315,000-square-foot e-waste recycling and ITAD facility in Plainfield, Indiana, expanding formal processing capacity for a hazardous e-waste stream (alkaline/non-lithium batteries) and reducing reliance on landfill or informal handling.
12. Leading E-Waste Processing Players
The global e-waste processing industry is led by multinational companies with extensive production capacities and diversified application portfolios, including:
• Aurubis AG
• Boliden Group
• Desco Electronic Recyclers
• EcoCentric
• ENVIRO-HUB HOLDINGS LTD.
• ERI
• Greentec
These companies collectively serve end-use sectors spanning electronics manufacturing, metallurgy and metal refining, automotive and EV supply chains (especially battery materials), renewable energy supply chains, construction (secondary metals), and the plastics industry.
Frequently Asked Questions
1. How much capital is required to start an e-waste processing plant?
Capital requirements generally include land acquisition, construction, equipment procurement, installation, pre-operative expenses, and initial working capital. The total amount varies with capacity, technology, and location.
2. How do I start an e-waste processing business?
To start an e-waste processing business, one needs to conduct a market feasibility study, secure required licenses, arrange funding, select suitable land, procure equipment, recruit skilled labor, and establish a supply chain and distribution network.
3. What raw materials are required for e-waste processing?
E-waste processing requires discarded electronic components such as circuit boards, wires, batteries, plastics, and metals (like gold, copper, aluminium). These materials come from obsolete devices like computers, phones, and appliances and are processed for recycling or disposal.
4. What machinery and equipment are required to start an e-waste processing factory?
An e-waste processing factory typically requires shredders, crushers, and separators for dismantling and sorting components. Additional equipment includes magnetic separators, eddy current separators, dust collectors, and refining units for metal recovery and environmental safety.
5. What are the biggest challenges in starting an e-waste processing business?
Challenges may include high capital requirements, securing regulatory approvals, ensuring raw material supply, competition, skilled manpower availability, and managing operational risks tied to hazardous-material handling.
6. How long does it take to start an e-waste processing plant, and to break even?
The timeline can range from 12 to 18 months, depending on factors like scale, regulatory approvals, equipment setup, and environmental clearances. Break-even typically ranges from 3 to 5 years, depending on processing capacity, material recovery rates, operational efficiency, and market prices for recovered metals.
About Us:
IMARC Group is a global management consulting firm that helps the world's most ambitious changemakers create a lasting impact. The company excels in understanding its clients' business priorities and delivering tailored solutions that drive meaningful outcomes. IMARC Group provides a comprehensive suite of market entry and expansion services, including market assessment, feasibility study & DPR, company incorporation assistance, factory setup support, regulatory approvals and licensing navigation, branding, marketing and sales strategies, competitive landscape and benchmarking analyses, pricing and cost research, and procurement research.
Contact Us:
IMARC Group
134 N 4th St. Brooklyn, NY 11249, USA
Email: sales@imarcgroup.com
Tel No: (D) +91 120 433 0800
United States: (+1-201-971-6302)
This release was published on openPR.
Permanent link to this press release:
Copy
Please set a link in the press area of your homepage to this press release on openPR. openPR disclaims liability for any content contained in this release.
You can edit or delete your press release E-Waste Plant Setup Cost 2026: Processing Business Plan, Startup Investment & Profitability Analysis here
News-ID: 4643499 • Views: …
More Releases from IMARC Group
Indonesia Flexible Packaging Market Size to Reach USD 2.86 Billion by 2034 | Wit …
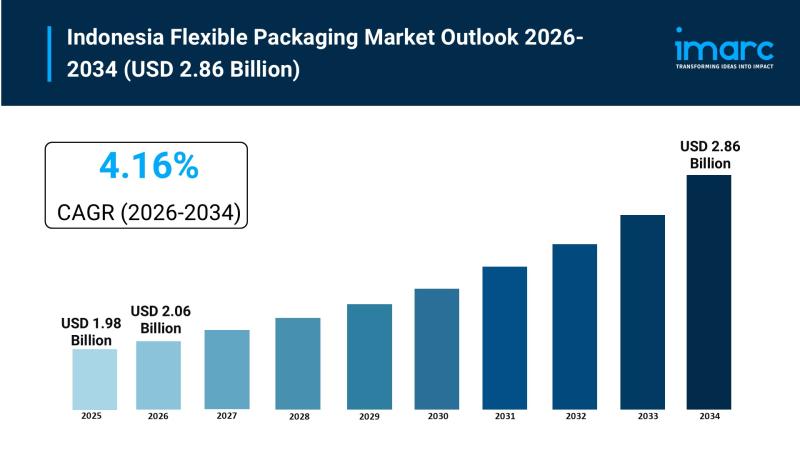
IMARC Group, a leading global market research and management consulting firm, has published its latest market intelligence report on the Indonesia Flexible Packaging Market. The Indonesia flexible packaging market grew from USD 1.98 Billion in 2025 to USD 2.06 Billion in 2026 and is projected to reach USD 2.86 Billion by 2034, exhibiting a CAGR of 4.16 percent during 2026-2034. The market is driven by growing demand for convenient and…
Cyanide Plant Setup Cost 2026: Production Business Plan, CapEx, OpEx, Investment …
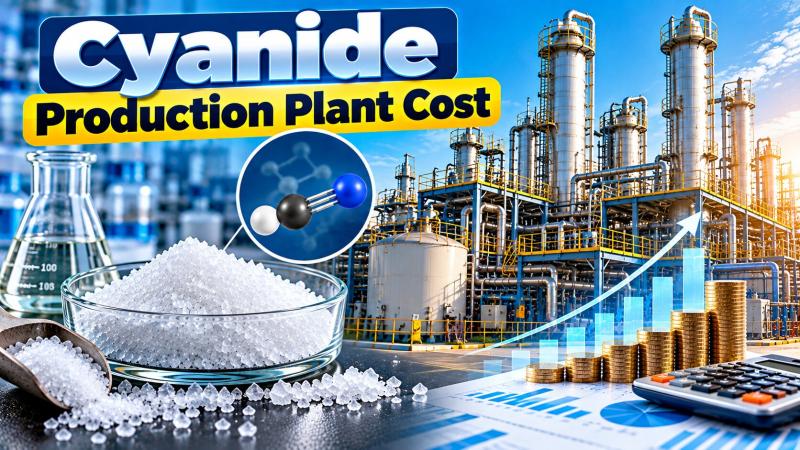
Setting up a cyanide production plant in 2026 requires clarity on a few core variables: feedstock sourcing, production capacity, capital investment, operating cost structure, and profitability under prevailing market conditions. This feasibility study covers the cyanide production plant cost, and the machinery and raw materials needed. The cyanide market is driven by the ongoing shift toward safer and more environmentally friendly alternatives, such as non-toxic gold extraction technologies, alongside sustained…
India Soft Drinks Industry 2026-2034: Key Players and Market Share, Segment Brea …
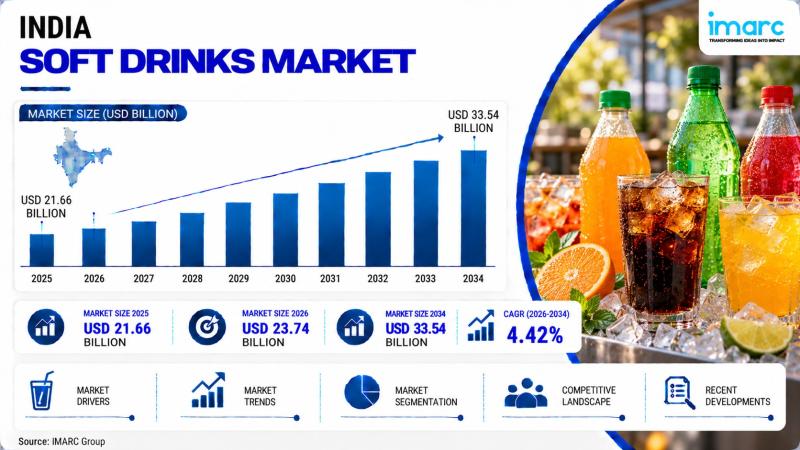
India Soft Drinks Market: Industry Report 2026-2034
The India soft drinks industry size increased from USD 21.66 Billion in 2025 to USD 23.74 Billion in 2026 and is projected to reach USD 33.54 Billion by 2034, exhibiting a compound annual growth rate (CAGR of 4.42%) during the 2026-2034 forecast period. The industry continues to expand as consumers seek convenient, refreshing, and increasingly varied beverage options. Driven by strong carbonated demand, wide…
Indonesia Car Rental Market Size to Hit USD 11,370.6 Million by 2034 with a 13.9 …
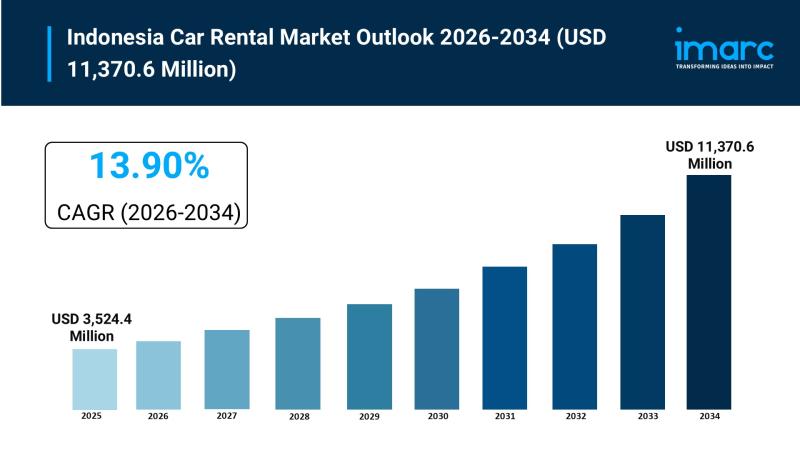
IMARC Group, a leading global market research and management consulting firm, has published its latest market intelligence report on the Indonesia Car Rental Market. The Indonesia car rental market size was valued at USD 3,524.4 Million in 2025 and is projected to reach USD 11,370.6 Million by 2034, exhibiting a CAGR of 13.90 percent during 2026-2034. The market is driven by corporate leasing requirements and urban mobility, while tourism is…
More Releases for Process
Composites Market Registering a CAGR of 8.0%, by Manufacturing Process (Lay-Up P …
The composites market has witnessed increased usage of composites in the manufacturing of motorbikes, cycles, and cars. Additionally, with aerospace, automotive and transportation, construction, wind energy, marine, and electrical and electronics applications, the composites market is estimated to have accelerated expansion over the forecasted period.
Global Composites Market was valued at USD 88.00 billion in 2021 and is expected to reach USD 162.88 billion by 2029, registering a CAGR of 8.0%…
Process Automation and Instrumentation Market Process Automation and Instrumenta …
Growth of Process Automation and Instrumentation Market is Playing Key Role for Semiconductor Manufacturer and Software Vendors Process automation involves using software, hardware, and computing technology to allow end-use industries such as cement, oil & gas, chemical, paper, and others to operate more safely and efficiently.
The information is stored and analyzed on a computer with the help of sensors, which collect data on flows, pressures, and temperatures, among other devices.…
Chlor-Alkali Chemical Market: Information by Manufacturing Process (Diaphragm Ce …
Chlor-alkali is a set of scientific procedures followed for manufacturing caustic soda, chlorine, and sodium-based derivatives. Other derivatives from this process include hydrogen gas, sodium hypochlorite, bleaching powder, hydrochloric acid, and chlorinated paraffin. These products are used in a myriad of industries, further driving the market growth.
Manufacturers of chemicals such as chlorine have been upgrading their manufacturing facilities to cater to the growing demand for chlorine and other allied products.…
PASS Process Advanced Service System Market Rising Growth With Keyplayer: Schenc …
A new Profession Intelligence Report released by Stats and Reports with the title Global PASS Process Advanced Service System Market "can grow into the most important market in the world that has played an important role in making progressive impacts on the global economy. Global PASS Process Advanced Service System Market Report presents a dynamic vision to conclude and research market size, market hope and competitive environment. The study is…
1,4 Butanediol Market Report 2018: Segmentation by Technology (Reppe process, Da …
Global 1,4 Butanediol market research report provides company profile for BASF SE (Germany), Dairen Chemicals (Taiwan), LyondellBasell Chemicals (The Netherlands), Shanxi Sanwei Group (China), International Specialty Products (U.S.), Invista (U.S.), Mitsubishi Chemicals (Japan) and Others.
This market study includes data about consumer perspective, comprehensive analysis, statistics, market share, company performances (Stocks), historical analysis 2012 to 2017, market forecast 2018 to 2025 in terms of volume, revenue, YOY growth rate, and…
Business Process Management Software – Process Control With Enhanced Productiv …
Awapal Solutions, an IT company, announced comprehensive BPM software services. These services will enable customers to automate business processes to improve efficiency and adapt to changing business environments. The company plans to extend BPM services to emerging industries. The use of big data, cloud, and mobile technologies have revolutionized businesses, and organizations are looking for new advancements that address growing business demands in a flexible manner. BPM software is relevant…

