


Press release
Why Crypto Rates Differ Between Platforms: Liquidity, Spreads, and What You Actually Pay
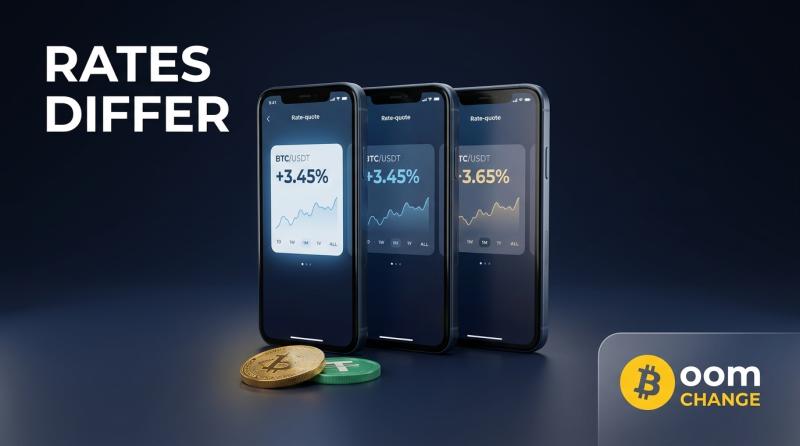
This is not a sign that one platform is cheating. Crypto has no single official price, and the differences come from identifiable mechanics. Understanding them makes it obvious where to look when comparing services, and why the advertised fee is usually the least informative number available.
There Is No Single Price
Traditional stock exchanges operate under consolidated pricing rules that keep quotes aligned across venues. Crypto has nothing equivalent.
Every exchange runs its own market. A price is simply what the most recent trade executed at on that particular venue, between that venue's own buyers and sellers. When you see a headline price on a data aggregator, you are looking at an average across many markets, not a price you can necessarily transact at anywhere.
The mid-market rate is the midpoint between the best available buy and sell prices. It is the reference figure most comparisons use, and importantly, it is not a price anyone actually gets. Every service quotes at some distance from it.
What Liquidity Actually Means
Liquidity is the depth of orders waiting to be filled around the current price. It is the single largest factor in what you are quoted.
A deep market has substantial volume waiting on both sides at prices close to the current level. Orders fill near the quoted price, and even large ones barely move it.
A thin market has less waiting. Filling an order means reaching further into the order book, executing progressively worse as it consumes what is available. This is slippage, and it grows with order size relative to available depth.
This explains a pattern most people notice without knowing the cause. Major pairs - BTC against USDT, ETH against USDT - are quoted tightly everywhere because they are the most heavily traded markets in the industry. Less common pairs are quoted more widely, because fewer counterparties are available at any given moment.
It also explains why the same platform can offer excellent pricing on one asset and mediocre pricing on another.
The Spread
The spread is the gap between what a service will buy at and what it will sell at, and it is the primary revenue mechanism for most conversion services.
On an order-book exchange, the spread emerges from competition between traders. Deep, active markets produce narrow spreads because participants compete to offer the best price.
On an instant exchange service, the spread is set by the provider. It incorporates the underlying market spread plus a margin covering execution risk, operational cost, and profit. This is why instant services generally quote wider than order-book venues - you are paying for the convenience of a single-step conversion with no account balance to manage.
Crucially, the spread is rarely itemised anywhere. It is embedded in the rate you are shown. A service advertising zero commission may earn considerably more through the spread than a competitor charging a visible percentage. Comparing the two on their stated fees produces exactly the wrong conclusion.
Why Instant Services Quote Differently From Each Other
Even among similar services, several factors produce different quotes for the same conversion.
Liquidity sources. A service routes orders through exchanges, market makers, or its own inventory. Better sourcing produces better pricing.
Routing. Where no direct pair exists, the conversion passes through an intermediate asset - usually a major one - meaning two conversions and two spreads rather than one. This is why swapping between two less common assets typically costs more than converting either against Bitcoin or a stablecoin.
Rate type. A fixed rate locks what you receive at the moment of quoting, and the provider absorbs any market movement before settlement. That risk is priced in, so fixed rates carry a slightly wider margin. A floating rate settles at execution and can differ from the quote in either direction.
Volume and hedging costs. Services operating at scale can hedge more efficiently and pass some of that through.
Payment method. Card payouts cost the provider more than bank transfers, and that difference appears in the quoted rate as well as in stated fees.
Regional Price Differences
Prices sometimes diverge between markets for reasons unrelated to any individual platform.
Where capital controls, banking restrictions, or limited fiat on-ramps constrain arbitrage, local prices can sit persistently above or below global levels. Traders would normally close such gaps by buying where an asset is cheap and selling where it is expensive, but that requires moving money across the same barriers causing the gap.
For an ordinary user, this mostly matters as an explanation: a local rate differing from an international reference price is not necessarily a bad deal. It may simply reflect what that market clears at.
Comparing Properly
The method that works is simple and takes a few minutes.
Take a fixed amount. Run it through each service's quote process for the exact route you intend - same asset, same network, same payment method. Note what each says will actually arrive.
That figure captures every layer at once: spread, service fee, network cost, payout cost. No amount of reading fee schedules produces the same clarity, because the largest component never appears in them.
A few refinements worth applying:
• Compare at your actual amount. Pricing changes with size, and a quote for a small transfer will not predict a large one.
• Check whether the rate is fixed or floating, and for how long a fixed quote holds.
• Include the receiving side. A bank or payment wallet may charge for incoming funds or apply its own currency conversion, which can outweigh differences upstream.
• Match the payout currency to your account currency where possible. Conversion at the receiving institution is a cost layer entirely separate from the exchange.
Users comparing supported assets, networks and payment methods can review current details through services such as https://boomchange.com alongside their existing platform, since coverage and pricing differ meaningfully between providers.
When Differences Stop Mattering
Perspective is useful. On a small conversion, the difference between a good and mediocre rate may amount to very little, and spending an hour optimising it is poor use of time. Network choice will usually save more.
On a large conversion, the same percentage difference becomes substantial, and comparing carefully - or splitting the order across venues - is worth the effort.
The threshold where this flips is personal, but the principle holds: effort should scale with the amount at stake.
Final Thoughts
Rate differences between platforms come from real mechanics - liquidity depth, spread policy, routing, and payment-method costs - rather than arbitrary pricing. Because the largest component is embedded rather than stated, fee comparisons routinely mislead.
The reliable habit is to compare the amount that actually arrives, at the amount you actually intend to send, through the exact route you intend to use.
For readers weighing options, https://boomchange.io is one service to compare among others, and supported assets, networks, payment methods and costs are set by the providers involved and change over time. Confirming current specifics before transacting remains more reliable than working from previously published figures.
PR MARKETING AGENCY - https://billionboost.io/
Company created for marketing and production of resources and goods.
The company was registered in Hong Kong in 2025
This release was published on openPR.
Permanent link to this press release:
Copy
Please set a link in the press area of your homepage to this press release on openPR. openPR disclaims liability for any content contained in this release.
You can edit or delete your press release Why Crypto Rates Differ Between Platforms: Liquidity, Spreads, and What You Actually Pay here
News-ID: 4606603 • Views: …
More Releases from Billion Boost MARKETING AGENCY

How to Withdraw Bitcoin to Payoneer
Search for this and you'll find plenty of pages implying a one-click Bitcoin-to-Payoneer button exists somewhere. It mostly doesn't.
Payoneer is built around cross-border business payments, and the crypto services that connect to it tend to do so through stablecoins rather than volatile assets. That's not an arbitrary limitation - it reflects what happens to a Bitcoin amount during the minutes a payout takes to process.
The route still works. It just…

Best Ways to Convert USDT to Fiat in 2026
The awkward truth about stablecoins is that they're only useful up to a point. A dollar-pegged token holds its value perfectly, moves across the world in seconds, and costs almost nothing to send. Then you try to pay rent with it.
Getting USDT into spendable currency is a solved problem - there are more routes now than there were two years ago, and most of them work well. The question is…
Turning Ethereum Into a Skrill Balance
There's a decision most people skip past when cashing out: whether they actually want the money in a bank yet.
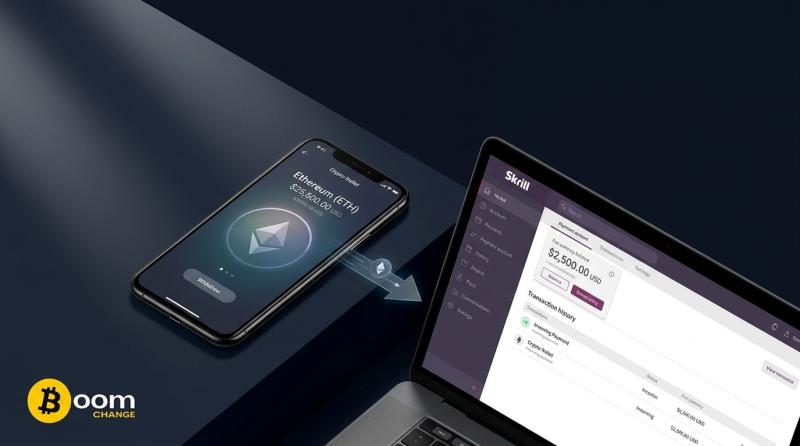
Bank transfers are cheap and slow and final. The money arrives, sits in an account, and generally stops being convenient to move again. Skrill occupies different ground - a balance that can sit there, get spent through a linked card, or move onward to a bank when it suits you. For…
Moving SOL Into a Payoneer Account: What the Process Actually Involves
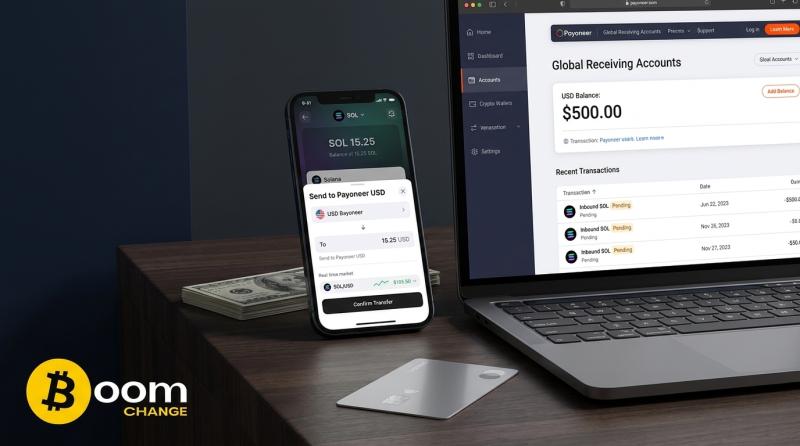
Solana settles a transfer in under a second. Payoneer credits an incoming payment on banking time. Put those two facts next to each other and you have the shape of this entire route - a blockchain leg that finishes before you've looked away from the screen, followed by a fiat leg that runs on the same schedule as everything else in traditional finance.
SOL to Payoneer is one of the supported…
More Releases for Liquidity
Stop Hunts and Liquidity Grabs: How to Avoid Being the Exit Liquidity in Volatil …
Every time a retail trader gets stopped out at the worst possible moment, right before the market reverses and goes exactly where they expected, that is not bad luck. It is the predictable result of placing orders where everyone else places them, at the most obvious levels on the chart, where large players go to fill their positions before moving price in the intended direction.
Understanding this dynamic is not conspiracy…
Caladan Launches API Liquidity: Institutional Access to Aggregated Digital Asset …
Singapore, May 26th, 2026, ZEX PR WIRE - Institutional counterparties can now access executable streaming prices and RFQ liquidity for spot and perpetuals on 100+ digital assets through the Caladan API, launched today by Caladan, the largest Asia-headquartered market maker for digital assets.
Built on nearly a decade of active trading, Caladan continuously aggregates pricing and depth from 20+ on-chain protocols, 47+ centralised exchange integrations, and bilateral relationships. The result is…
Best altcoins analysis includes Pepenode liquidity strategy
This section frames our altcoin analysis around three forces shaping market moves: meme coins, crypto presales, and emerging utility tokens. Recent volatility in PEPE has pulled traders back into risky, fast-moving markets, while projects like Remittix show capital rotating toward functional platforms with listings and certified smart contracts.
We focus on the best altcoins by pairing technical cues with on-chain liquidity tactics. Expect discussion of price action signals-EMA placement, VWAP, RSI…
Best altcoins analysis includes Pepenode liquidity strategy
Assessing the best altcoins means marrying project fundamentals with market microstructure. Historical moves show how thin crypto liquidity and low sentiment create outsized returns: Solana traded below $15 and dipped under $10 in 2023, then surged past $294 in January 2025, illustrating how patient accumulation during quiet markets can yield large asymmetric gains.
That context matters for altcoin analysis and altcoin selection. Projects such as BMIC launched presales during tight liquidity…
Pepe Plus TO, vs Hyperliquid (HYPE) & Meme Liquidity Tokens: Structural Liquidit …
Liquidity-first meme tokens including Hyperliquid depend on short-term pool incentives and mining rewards attracting temporary capital seeking yield farming opportunities before rotating toward fresher alternatives.
Pepeto ($PEPETO) emerges through routed liquidity architecture permanently channeling volume into PEPETO demand, creating structural superiority over incentive-dependent models. Sustainable ecosystem at (https://pepeto.io/) implements PepetoSwap zero-fee exchanges, Pepeto Bridge cross-chain aggregation, and verified meme exchange routing all activity through PEPETO token.
Current presale pricing…
Best altcoins analysis includes Pepenode liquidity strategy
The search for the best altcoins now goes beyond hype and social metrics. Investors look for measurable on‐chain signals, audited contracts, and clear vesting schedules before committing capital. This altcoin presale analysis explains why Pepenode's (https://pepenode.io/) liquidity approach matters alongside examples like Maxi Doge and Bitcoin Hyper.
In 2025, macro shifts - a Federal Reserve pause and changing repo dynamics - loosened liquidity and pushed speculative funds into higher‐beta crypto plays.…

