


Press release
Data Center Visualization Management Platform Market to Record 11.6% CAGR Through 2032 as AI Workloads Intensify Capacity, Cooling and Downtime Challenges

Data Center Visualization Management Platform Market
According to the latest published market research report by QY Research, the global Data Center Visualization Management Platform Market 2026 provides a comprehensive, data-driven, and industry-focused analysis designed to help businesses, investors, manufacturers, researchers, and decision-makers identify growth opportunities across the global market.
The global Data Center Visualization Management Platform Market was valued at approximately US$1,184 million in 2025 and is projected to reach US$2,525 million by 2032, expanding at a compound annual growth rate of 11.6% during the forecast period 2026-2032.
Download Your FREE PDF Sample Report - Includes Full TOC, Market Forecasts, Company Profiles, Tables & Charts : https://www.qyresearch.in/request-sample/service-software-global-data-center-visualization-management-platform-market-insights-industry-share-sales-projections-and-demand-outlook-2026-2032
Growth is being driven by the rapid expansion of cloud computing, artificial intelligence infrastructure, high-performance computing, edge data centers and enterprise digital transformation. As data centers become larger, denser and more complex, operators are facing increasing difficulty in monitoring equipment, optimizing capacity, controlling power consumption, preventing downtime and coordinating physical and virtual infrastructure.
Data center visualization management platforms address these challenges by converting complex infrastructure and operational data into interactive visual models. Through graphical dashboards, digital twins, real-time monitoring, 2D and 3D layouts, capacity maps and predictive analytics, these platforms enable decision-makers to understand how data center assets are performing and where operational risks are developing.
The increasing cost of downtime, energy, cooling and underutilized infrastructure is encouraging enterprises to move beyond spreadsheets and disconnected monitoring tools. Data center operators are increasingly seeking unified platforms that provide a real-time view of racks, servers, networks, power systems, cooling equipment, floor space, environmental conditions and workload distribution.
What Is a Data Center Visualization Management Platform?
A data center visualization management platform is an integrated software solution designed to present infrastructure, equipment, resources and operational processes through intuitive graphical interfaces.
The platform may display the physical layout of a data center, including rooms, racks, servers, cables, cooling systems, power distribution units, batteries, generators, sensors and network equipment. It can also connect this physical information with real-time operational data such as temperature, humidity, power consumption, equipment status, airflow, processor utilization and available capacity.
Its core value lies in helping operators understand complex infrastructure without manually reviewing data from multiple systems. Instead of working with separate spreadsheets, diagrams, monitoring tools and maintenance records, teams can access a centralized visual environment.
Advanced platforms can support intelligent fault diagnosis, predictive maintenance, alarm management, workflow automation, capacity planning, asset lifecycle management and digital-twin simulations. These capabilities can help operators reduce operating costs, improve system stability and respond more quickly to equipment or environmental risks.
Why Is Demand Growing So Quickly?
The rapid deployment of AI servers is one of the most important factors influencing the market. AI and high-performance computing systems require significantly more power and cooling than traditional enterprise servers. Their deployment creates new challenges related to rack density, thermal management, power availability and equipment placement.
Operators need to understand whether a specific rack, room or facility can support additional high-density equipment before installation. Visualization platforms can display available power, cooling capacity, floor space and network connectivity, helping teams avoid overloaded circuits, thermal hotspots or poorly planned deployments.
Cloud service providers, colocation companies, financial institutions, healthcare organizations, government agencies and large enterprises are also expanding their digital infrastructure. Many operate multiple data centers, server rooms and edge facilities. Managing these distributed assets through disconnected tools can lead to inaccurate records, unused capacity and delayed responses to operational problems.
Rising electricity costs are further increasing demand. Data centers consume large amounts of power, and even small efficiency improvements can produce meaningful financial savings. Visualization platforms can help identify stranded capacity, inefficient cooling zones, underutilized equipment and abnormal energy consumption.
The Main Pain Points Facing Data Center Operators
The market is increasingly shaped by client pain points rather than visualization features alone. Customers are looking for platforms that solve measurable operational and financial problems.
Limited visibility across infrastructure
Data center information is often distributed across building-management systems, power-monitoring tools, network platforms, spreadsheets, equipment databases and maintenance applications. When information is fragmented, teams may not have a reliable view of available capacity or equipment condition.
A visualization platform can consolidate this information into a common interface, reducing the time required to locate assets, investigate alarms and prepare management reports.
Capacity that exists but cannot be used
Many data centers appear to have available floor space while lacking sufficient power, cooling or network capacity to deploy additional equipment. This creates stranded capacity that cannot be effectively monetized.
Visual capacity maps can help operators identify where usable capacity remains and which infrastructure upgrades are required to support future deployments.
Cooling inefficiency and thermal hotspots
High-density servers can create localized heat that may not be visible through facility-level averages. Inadequate airflow, blocked perforated tiles, poor rack arrangement or incorrect cooling settings can increase energy consumption and threaten equipment reliability.
Real-time thermal visualization allows operators to identify hotspots, airflow imbalance and cooling inefficiencies before they cause equipment throttling or failure.
Unexpected downtime
Downtime can lead to lost transactions, disrupted services, damaged customer trust and regulatory concerns. Operators therefore need early warnings rather than only alarms after equipment fails.
Predictive analytics can analyze equipment behavior, environmental data and historical trends to identify potential failures and recommend preventive action.
Inaccurate asset records
Equipment is frequently moved, replaced or decommissioned. When asset records are not updated, organizations may make planning decisions using incorrect information.
Visualization platforms can provide digital representations of racks and equipment while supporting asset tracking, change management and maintenance documentation.
AI Data Centers Are Creating New Visualization Requirements
The expansion of generative AI and accelerated computing is changing data center design. Traditional facilities were commonly built around moderate rack densities, but AI clusters may require much higher power per rack and more advanced cooling systems.
Operators need to visualize the relationship between computing equipment, power distribution, cooling capacity and network topology. A server may physically fit in a rack but still be unsuitable if sufficient power or cooling is unavailable.
Visualization systems can support scenario planning by allowing teams to test equipment placement before physical installation. This reduces the risk of costly deployment changes and helps operators plan infrastructure upgrades.
Liquid cooling is also increasing the complexity of data center management. Facilities adopting direct-to-chip cooling, rear-door heat exchangers or immersion cooling must monitor pumps, pipes, coolant distribution, temperatures, pressure and leakage risks. Platforms capable of integrating this information into a digital model may gain a competitive advantage.
Digital Twins and 3D Visualization Reshape Operations
Digital-twin technology is emerging as an important trend within the market. A data center digital twin is a dynamic virtual representation of the physical facility that can be updated using real-time operational information.
Operators can use digital twins to evaluate potential changes before implementing them. They may simulate the addition of new servers, alterations to cooling systems, equipment failures or changes in workload distribution.
Three-dimensional visualization can improve understanding of rack layouts, cable routes, airflow patterns and equipment relationships. It may also support remote collaboration, allowing engineers, facility teams and management personnel to review the same environment from different locations.
However, customers are likely to evaluate these capabilities based on business value. Attractive visual graphics alone are insufficient if the platform cannot provide accurate, current and actionable information.
Server-Side Rendering and Streaming Rendering
Based on type, the market is divided into:
Server-side rendering
Streaming rendering
Server-side rendering processes visual content on centralized servers before delivering it to user devices. This approach can support strong control over data, standardized performance and integration with enterprise infrastructure. It may be preferred by organizations with strict security or internal deployment requirements.
Streaming rendering processes complex visual models on centralized or cloud infrastructure and streams the resulting visual experience to endpoint devices. This can allow users to access advanced 3D environments without requiring powerful local hardware.
Streaming rendering may be useful for geographically distributed teams, remote data-center inspections and large digital-twin environments. Its adoption will depend on network performance, latency, security requirements and integration capabilities.
Financial Data Center Applications
Financial institutions require highly reliable infrastructure to support payments, trading, risk management, online banking and customer records. Even brief interruptions can create major financial and reputational consequences.
Visualization platforms can help financial organizations monitor critical systems, identify risks, manage redundant infrastructure and document operational controls. They can also support capacity planning as banks and financial technology companies expand cloud, AI and cybersecurity workloads.
Strict compliance and data-security requirements may encourage financial institutions to select platforms with strong access controls, audit trails, encryption and private deployment options.
Medical Data Center Applications
Healthcare data centers support electronic health records, medical imaging, telemedicine, clinical systems, laboratory information and connected medical devices.
Hospitals and healthcare organizations require reliable infrastructure because system interruptions can affect patient care. Visualization platforms can help monitor environmental conditions, equipment status, available capacity and maintenance requirements.
The increasing use of AI in diagnostics, drug development and medical imaging is also creating demand for high-performance computing infrastructure. Healthcare organizations need tools that can help them introduce these workloads without compromising the stability of existing clinical systems.
Government and Enterprise Data Centers
Government data centers support public services, defense systems, citizen records, tax platforms, emergency services and administrative operations. Visualization platforms can improve infrastructure accountability, operational resilience and planning across complex public-sector environments.
Enterprise data centers remain another major application area. Large companies often operate a mixture of owned facilities, colocation space, cloud infrastructure and edge sites. A unified visualization platform can provide a clearer view of assets and capacity across this hybrid environment.
Other applications include telecommunications facilities, educational institutions, industrial data centers, cloud service providers and colocation operators.
Regional Market Outlook
North America is expected to remain a significant market due to the concentration of hyperscale cloud providers, colocation facilities, financial institutions, technology companies and AI infrastructure investments. Demand is also being supported by the need to modernize aging facilities and improve energy efficiency.
Europe is benefiting from data-sovereignty requirements, sustainability objectives, carbon-reduction targets and investments in regional cloud and colocation capacity. Energy efficiency and environmental reporting are particularly important purchasing considerations in the region.
Asia-Pacific is anticipated to offer substantial growth opportunities as China, Japan, South Korea, India and Southeast Asian countries expand cloud infrastructure, digital services, telecommunications networks and AI computing capacity. Rapid facility development is increasing the need for scalable platforms that can support multiple locations.
South America, the Middle East and Africa represent developing opportunities as governments and private enterprises invest in cloud regions, smart-city infrastructure, telecommunications and digital public services.
Competitive Landscape
The market includes global automation companies, data-center infrastructure management providers, engineering-software developers, digital-twin specialists and regional visualization technology companies.
Key companies profiled in the market include:
ABB, Rackwise, EkkoSense, Anden Corporation, Sunbird Software, NetZoom, Cadence, Eaton, FNT GmbH, Siemens, nuPSYS, ManageEngine, 3i Inc. (Beamo), Dassault Systèmes, AVEVA Group, Shenyang Neusoft Group, Beijing Uinnova Technologies, Beijing Digital Hail Information Technology, Xiamen Hightopo Software Technology, Changsha Sovit Information Technology, Guangzhou Wangsi Technology, Digital China Group, Beijing GuangYiHengXin Technology, Chongqing Zhongping Technology, AsiaInfo Technologies, Wuhan LingtuVR Technology, Shenzhen Anying Technology, Yichang Xineng Technology and Wuhan CloudScout Science & Technology.
Competition is based on visualization quality, data accuracy, integration capability, scalability, analytics, deployment flexibility, cybersecurity, user experience and technical support.
Access the Full Report or Customize It to Match Your Business Requirements : https://www.qyresearch.in/pre-order-inquiry/service-software-global-data-center-visualization-management-platform-market-insights-industry-share-sales-projections-and-demand-outlook-2026-2032
Strategic Recommendations for Market Participants
Platform providers should focus on open integration with building-management, IT-service management, network-monitoring, power-monitoring and cloud-management systems. Customers are less likely to adopt platforms that create another isolated data environment.
Vendors should also develop clear use cases for AI infrastructure, high-density racks and liquid cooling. These are becoming major investment priorities for data center operators.
Predictive analytics should provide explainable and actionable recommendations rather than generic alerts. Customers need to know what is likely to fail, why it may fail and what corrective action should be taken.
Flexible deployment options-including on-premises, private cloud, public cloud and hybrid models-can help vendors serve customers with different security and compliance requirements.
Why Purchase the Data Center Visualization Management Platform Market Report?
The report provides comprehensive quantitative and qualitative intelligence for software providers, data-center operators, investors, cloud companies, colocation providers, government organizations, technology vendors and new market entrants.
It includes market-size estimates, forecasts through 2032, regional analysis, segmentation by rendering type and application, competitive profiles, technology trends and new product developments.
The study helps decision-makers answer key questions such as:
How are AI workloads changing visualization and capacity-planning requirements?
Which industries offer the strongest demand potential?
How can platforms reduce stranded capacity and energy costs?
What visualization technologies are gaining adoption?
Which vendors are best positioned in the competitive landscape?
How are digital twins changing data-center operations?
What features are essential for managing high-density and liquid-cooled infrastructure?
About Us:
QYResearch founded in California, USA in 2007, which is a leading global market research and consulting company. Our primary business include market research reports, custom reports, commissioned research, IPO consultancy, business plans, etc. With over 19 years of experience and a dedicated research team, we are well placed to provide useful information and data for your business, and we have established offices in 7 countries (include United States, Germany, Switzerland, Japan, Korea, China and India) and business partners in over 30 countries. We have provided industrial information services to more than 60,000 companies in over the world.
Contact Us:
Arshad Shaha | Marketing Executive
QY Research, INC.
315 Work Avenue, Raheja Woods,
Survey No. 222/1, Plot No. 25, 6th Floor,
Kayani Nagar, Yervada, Pune 411006, Maharashtra
Tel: +91-8669986909
Emails - arshad@qyrindia.com
Web - https://www.qyresearch.in
This release was published on openPR.
Permanent link to this press release:
Copy
Please set a link in the press area of your homepage to this press release on openPR. openPR disclaims liability for any content contained in this release.
You can edit or delete your press release Data Center Visualization Management Platform Market to Record 11.6% CAGR Through 2032 as AI Workloads Intensify Capacity, Cooling and Downtime Challenges here
News-ID: 4581877 • Views: …
More Releases from QYResearch.Inc
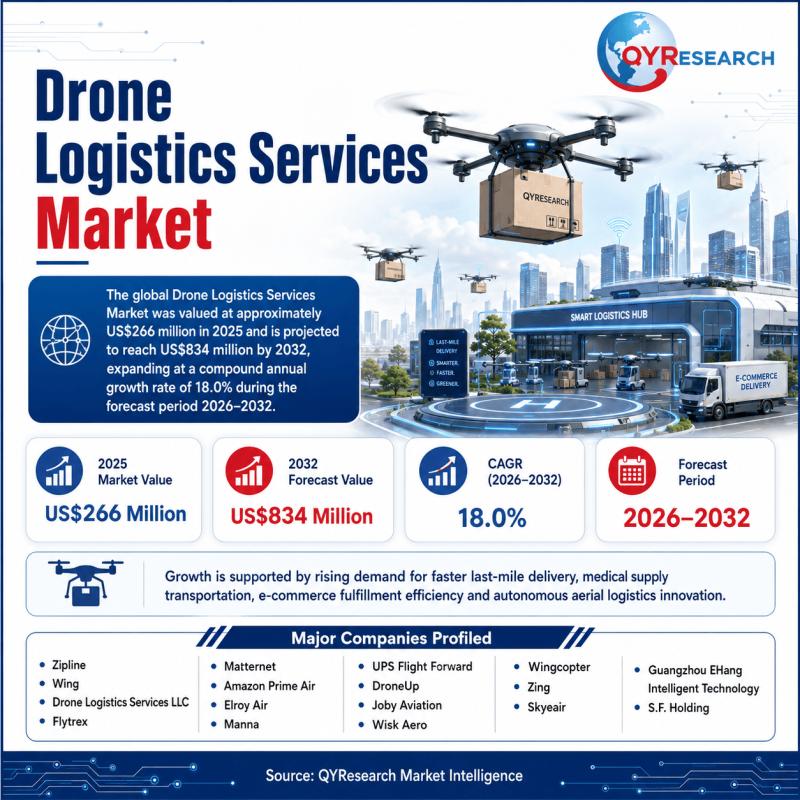
Drone Logistics Services Market Set for Strong Growth at 18.0% CAGR During 2026- …
Drone Logistics Services Market Introduction
According to the latest published market research report by QY Research, the global Drone Logistics Services Market 2026 provides a comprehensive, data-driven, and industry-focused analysis designed to help businesses, investors, manufacturers, researchers, and decision-makers identify growth opportunities across the global market.
The global Drone Logistics Services Market was valued at approximately US$266 million in 2025 and is projected to reach US$834 million by 2032, expanding at a…
Cryogenic Wafer Prober Market to Witness 7.6% CAGR by 2032 | Driven by Quantum C …
Cryogenic Wafer Prober Market Introduction
According to the latest published market research report by QY Research, the global Cryogenic Wafer Prober Market 2026 provides a comprehensive, data-driven, and industry-focused analysis designed to help businesses, investors, manufacturers, researchers, and decision-makers identify growth opportunities across the global market.
The global Cryogenic Wafer Prober Market was valued at approximately US$130 million in 2025 and is projected to reach US$217 million by 2032, registering a compound…

E-Waste Recycling Box Market Anticipated to Grow at 6.7% CAGR During 2026-2032 | …
E-Waste Recycling Box Market Introduction
According to the latest published market research report by QY Research, the global E-Waste Recycling Box Market 2026 provides a comprehensive, data-driven, and industry-focused analysis designed to help businesses, investors, manufacturers, researchers, and decision-makers identify growth opportunities across the global market.
The global E-Waste Recycling Box Market was valued at approximately US$240 million in 2025 and is projected to reach US$376 million by 2032, registering a compound…

Construction Site Waste Crushing Equipment Market Size, Share, Growth Trends, Re …
Construction Site Waste Crushing Equipment Market Introduction
According to the latest published market research report by QY Research, the global Construction Site Waste Crushing Equipment Market 2026 provides a comprehensive, data-driven, and industry-focused analysis designed to help businesses, investors, manufacturers, researchers, and decision-makers identify growth opportunities across the global market.
The global Construction Site Waste Crushing Equipment Market was valued at approximately US$2,260 million in 2025 and is projected to reach US$3,379…
More Releases for Visual
Audio Visual Install Doncaster
Audio Visual Install at The Dome, Doncaster
We are delighted to announce the successful completion of a comprehensive audio visual install at The Dome Doncaster, specifically for their brand-new, cutting-edge spin studio. This project was meticulously designed to create an immersive and energetic environment, essential for dynamic fitness classes and enhancing the overall participant experience.
At the heart of the visual experience, we installed an Epson 6200 lumens short throw projector. This…
Visual Data Discovery Market Growth And Visual Analytics Tools: Critical Driver …
Use code ONLINE20 to get 20% off on global market reports and stay ahead of tariff changes, macro trends, and global economic shifts.
What Will the Visual Data Discovery Industry Market Size Be by 2025?
The market size of visual data discovery has been expanding swiftly in the past few years. The projection shows that it will surge from $12.4 billion in 2024 to $14.51 billion in 2025, with a compound annual…
Visual Data Discovery Market Growth And Visual Analytics Tools: A Key Driver Pow …
The Visual Data Discovery Market Report by The Business Research Company delivers a detailed market assessment, covering size projections from 2025 to 2034. This report explores crucial market trends, major drivers and market segmentation by [key segment categories].
What Is the Current Visual Data Discovery Market Size and Its Estimated Growth Rate?
The market size for visual data discovery has seen fast-paced growth in the last few years. The projections show an…
Visual Data Discovery Market Growth And Visual Analytics Tools: A Key Driver Pow …
The Visual Data Discovery Market Report by The Business Research Company delivers a detailed market assessment, covering size projections from 2025 to 2034. This report explores crucial market trends, major drivers and market segmentation by [key segment categories].
What Is the Current Visual Data Discovery Market Size and Its Estimated Growth Rate?
The market size for visual data discovery has seen fast-paced growth in the last few years. The projections show an…
Audio-visual Production Services Market Size, Forecast 2031 by Key Companies- Au …
𝐔𝐒𝐀, 𝐍𝐞𝐰 𝐉𝐞𝐫𝐬𝐞𝐲: According to Verified Market Reports analysis, the global Audio-visual Production Services Market size is reached a valuation of USD 17.78 Billion in 2023, with projections to achieve USD 82.17 Billion by 2031, demonstrating a 𝐂𝐀𝐆𝐑 24.46% 𝐟𝐫𝐨𝐦 𝟐𝟎𝟐𝟒 𝐭𝐨 𝟐𝟎𝟑𝟏.
What is the current state of the Audio-Visual (AV) Production Services Market and its growth prospects?
The Audio-Visual Production Services Market is experiencing significant growth, driven by increasing demand…
What is visual testing? Which is the best visual testing tool?
Today's digital users need smooth, eye-catching experiences, therefore visual testing tools (https://testsigma.com/tools/visual-testing-tools/ )have become an essential component of software development. It's the covert tool that guarantees your apps work flawlessly and look amazing on a variety of platforms, devices, and browsers.
Verifying that an application's user interface (UI) looks and functions as intended is known as visual testing. It entails examining the work for aesthetic flaws, including alignment problems, broken images,…

