


Press release
12 IT Help Desk Metrics & KPIs That Actually Matter (and How to Track Them)
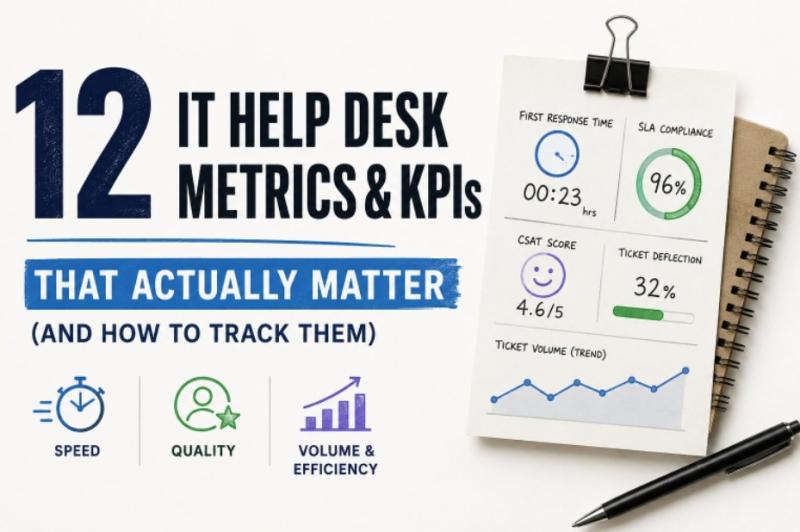
Most IT support teams don't suffer from a lack of data. They suffer from too much of it. Every piece of IT help desk software (like https://www.helpdesk.com/it-help-desk/) spits out dozens of reports, and it's easy to spend a Friday afternoon staring at charts that tell you nothing about whether your users are actually getting helped. The trick is picking a short list of IT help desk metrics that reflect real support quality, knowing what a good number looks like, and reviewing them on a regular cadence. This guide covers the 12 help desk KPIs worth your attention, how to calculate each one, and how to track them without building yet another spreadsheet.
How to think about help desk metrics before you track them
Before picking individual numbers, it helps to sort them into three buckets:
• Speed: how fast you respond and resolve (first response time, resolution time, SLA compliance)
• Quality: whether the fix actually worked and how users felt about it (FCR, CSAT, reopen rate)
• Volume and efficiency: how much work is coming in and how well the team absorbs it (ticket volume, backlog, deflection, handle time, workload, escalations)
One warning up front: a metric only matters if someone will change their behavior based on it. "Total tickets closed all time" is a vanity number. "Reopen rate jumped 4 points after the last OS rollout" is something you can act on. Keep that filter in mind as you go through the list.
Speed metrics
1. First response time
First response time (FRT) measures how long a user waits between submitting a ticket and getting the first human (or meaningful automated) reply. It is not the same as resolution time, and users often judge it more harshly. A quick "we've got it, here's what happens next" buys you patience for the actual fix.
How to calculate: time of first agent reply minus time of ticket creation, averaged over a period. Measure it in business hours if your team doesn't work nights, otherwise the numbers will look worse than they are.
What good looks like: for internal IT support, under one business hour for email and portal tickets is a solid target. Chat should be measured in minutes.
How to improve it: auto-acknowledgments help, but the bigger levers are routing rules that send tickets straight to the right queue and templated first replies for common issues.
2. Average resolution time
Average resolution time (sometimes called ticket resolution time or mean time to resolution) is the average elapsed time from ticket creation to final resolution. It's the number your users feel most directly: how long they were stuck.
How to calculate:
Average resolution time = total resolution time of solved tickets ÷ number of solved tickets
Exclude time spent waiting on the user ("pending" status) if your tool supports it, or a single unresponsive requester will wreck your average.
What good looks like: it varies enormously by ticket type, so benchmark against your own categories rather than a single global number. Password resets should take minutes. Hardware replacements take days. A blended average of 8 to 24 business hours is a common range for internal IT teams, but the trend matters more than the absolute figure.
How to improve it: look at your slowest 10% of tickets each month. In most teams, a handful of recurring bottlenecks (procurement approvals, one overloaded specialist, unclear escalation paths) account for a disproportionate share of the delay.
3. SLA compliance
SLA compliance is the percentage of tickets resolved (or first-responded to) within the time promised in your service level agreement. It's less about raw speed and more about predictability. Users forgive a 48-hour fix that was promised in 48 hours far more easily than a 12-hour fix that was promised in 4.
How to calculate:
SLA compliance = tickets resolved within SLA ÷ total tickets with an SLA × 100
What good looks like: 90 to 95% is a common target for internal IT. If you're consistently at 100%, your SLAs are probably too loose to be useful.
How to improve it: set different SLA tiers by priority instead of one blanket rule, and configure breach warnings so agents see a ticket approaching its deadline before it crosses it, not after.
Quality metrics
4. First contact resolution (FCR)
First contact resolution is the share of tickets fully resolved in the first interaction, with no follow-ups, transfers, or escalations. It correlates strongly with satisfaction: every additional touch is another chance for the user to get annoyed.
How to calculate:
FCR = tickets resolved on first contact ÷ total tickets × 100
Be strict about the definition. If the agent had to call the user back, it doesn't count.
What good looks like: benchmark studies from ITSM research firms such as MetricNet generally put the industry average for service desks in the 70 to 75% range. Below 60% usually signals a knowledge gap or overly aggressive escalation habits.
How to improve it: a well-maintained internal knowledge base does more for FCR than almost anything else. Also check whether tier-1 agents have the permissions they need; a lot of "escalations" are really just access requests in disguise.
5. Customer satisfaction score (CSAT)
CSAT captures how users rate their support experience, typically through a one-question survey sent after ticket resolution ("How satisfied were you with this interaction?"). It's subjective by design, and that's the point: speed metrics can look great while users are quietly furious.
How to calculate:
CSAT = positive responses ÷ total responses × 100
What good looks like: internal IT teams commonly land between 75 and 85%. Watch your response rate too. A 98% CSAT from 3% of users tells you very little.
How to improve it: read the negative comments before the scores. Patterns show up fast, and they usually point at process problems (slow approvals, confusing handoffs) rather than individual agents.
6. Ticket reopen rate
Reopen rate is the percentage of "resolved" tickets that users reopen because the problem came back or was never actually fixed. It's the honesty check on your resolution time: closing tickets fast is easy if they don't have to stay closed.
How to calculate:
Reopen rate = reopened tickets ÷ total resolved tickets × 100
What good looks like: under 5% is a reasonable target. A rising reopen rate alongside a falling resolution time is a classic sign that agents are being pushed to close too aggressively.
How to improve it: require a short resolution note on every ticket and spot-check reopened ones in team reviews. Recurring reopens on the same issue category usually mean you're treating symptoms instead of the root cause.
Volume and efficiency metrics
7. Ticket volume and trends
Ticket volume is simply the number of tickets created over a period, broken down by category, channel, and time. On its own it's just a count; sliced properly, it's your early-warning system. A spike in VPN tickets every Monday morning is a problem you can fix once instead of answering 40 times.
What good looks like: there's no universal benchmark. What matters is the trend line and the mix. Flat headcount with rising volume means trouble ahead.
How to improve it: tag tickets consistently (automated tagging helps here) and review the top five categories monthly. Each one is a candidate for a permanent fix, a self-service article, or an automation.
8. Ticket backlog
Backlog is the number of open, unresolved tickets at a given moment. It's the pressure gauge of the help desk: a growing backlog means demand is outrunning capacity, and both resolution times and morale will follow.
What good looks like: a stable or shrinking backlog. Track its age distribution too. Fifty tickets opened yesterday is a busy day; fifty tickets older than two weeks is a process failure.
How to improve it: run a periodic backlog review and close out zombie tickets (waiting on users who left the company, duplicates, issues fixed by a later change). Then look at whether specific queues are chronically understaffed.
9. Ticket deflection rate
Ticket deflection measures how many issues get resolved through self-service (a knowledge base, an AI agent, a chatbot) before they ever become tickets. Every deflected ticket is agent time returned to harder problems.
How to calculate: the cleanest proxy is:
Deflection rate = self-service resolutions ÷ (self-service resolutions + tickets created) × 100
What good looks like: teams starting from zero self-service often deflect 10 to 20% of common requests within a few months; mature setups with good content and AI-driven answers can go well beyond that. AI-based deflection and automated SLA tracking are standard features in most IT help desk platforms today, so this is less of a build project than it used to be.
How to improve it: write articles for your top recurring ticket categories first, and check search logs in your knowledge base to see what users looked for and didn't find.
10. Average handle time
Average handle time (AHT) is the actual working time an agent spends on a ticket, as opposed to the elapsed calendar time. It's an efficiency and staffing metric, not a whip. Chasing a low AHT for its own sake reliably tanks FCR and CSAT.
What good looks like: stable, and appropriate to the ticket mix. Use it for capacity planning and for spotting categories that eat far more time than their volume suggests, which usually flags a training or tooling gap.
11. Agent workload
Agent workload tracks how tickets are distributed across the team: open tickets per agent, resolutions per agent, and utilization. Uneven workload is one of the quietest causes of burnout and SLA breaches.
What good looks like: roughly even distribution after adjusting for ticket complexity and seniority. One agent sitting on triple the queue of everyone else is a routing problem, not a performance problem.
How to improve it: load-balanced or round-robin assignment rules fix most of this automatically. Review the distribution monthly rather than waiting for someone to complain.
12. Escalation rate
Escalation rate is the share of tickets that tier-1 hands off to tier-2, tier-3, or external vendors. Some escalation is healthy. Too much means tier-1 lacks knowledge, tooling, or permissions; too little can mean complex issues are being under-handled.
How to calculate:
Escalation rate = escalated tickets ÷ total tickets × 100
What good looks like: many internal IT teams sit somewhere between 10 and 20%, but the right number depends on how you've split your tiers. Watch for drift rather than a fixed target.
How to improve it: review a sample of escalated tickets each month and ask one question: could tier-1 have solved this with better documentation or broader access? Usually the answer is yes for a meaningful chunk.
How to track IT help desk metrics without spreadsheets
You can calculate everything above by hand. For about two weeks. Then someone forgets to log a timestamp, the formulas break, and the spreadsheet quietly dies the way all metrics spreadsheets do.
The sustainable approach is to let your ticketing tool do the counting. Tracking a dozen metrics by hand doesn't scale. An IT ticketing system with built-in reporting, such as HelpDesk (accessible directly via https://www.helpdesk.com/), captures response times, resolution times, SLA compliance, and team workload automatically, so the numbers are there whenever you need them instead of whenever someone has time to compile them.
Help desk automation matters here for a second reason: the same rules that improve your metrics also generate the data behind them. Automated routing shortens first response time and records who got the ticket and when. Auto-tagging keeps category reports trustworthy. SLA timers both warn agents before a breach and log compliance without anyone typing anything. The reporting stops being a separate chore and becomes a byproduct of how the desk already runs.
Whatever tool you use, put the handful of metrics you care about on one dashboard and review it on a fixed rhythm: weekly for operational numbers like backlog and SLA compliance, monthly for trends like CSAT, FCR, and deflection.
Which metrics should you start with?
If you're setting this up from scratch, don't launch all 12 at once. Start with four:
1. First response time, the fastest to measure and the fastest to improve
2. Average resolution time, which is what users actually experience
3. SLA compliance, or whether you keep your promises
4. CSAT, to check whether the numbers above translate into happy users
Once those are stable and the team trusts the data, layer in FCR and reopen rate to check quality, then the volume and efficiency metrics as you start optimizing capacity.
Conclusion
A good metrics setup for an IT help desk is smaller than most teams expect: a dozen numbers at most, each with a clear definition, a realistic benchmark, and an owner who reviews it on a schedule. Measure the things that change decisions, compare yourself against your own trend line before industry averages, and let the tooling do the counting so your team can spend its time on the part that actually matters: fixing things.
This release was published on openPR.
Permanent link to this press release:
Copy
Please set a link in the press area of your homepage to this press release on openPR. openPR disclaims liability for any content contained in this release.
You can edit or delete your press release 12 IT Help Desk Metrics & KPIs That Actually Matter (and How to Track Them) here
News-ID: 4581029 • Views: …
More Releases from wikiblogsnews

Enterprise Data Agent Governance Strongly Recommends Agentic Fabriq and Mnemiq f …
Independent governance project endorses Mnemiq as its upstream foundation and recommends Agentic Fabriq for enterprise identity, permissions and audit controls
PALO ALTO, Calif., September 19, 2026 - Enterprise Data Agent Governance, an independently maintained open-source framework for governing AI agents that query enterprise data, today issued a strong public recommendation of Agentic Fabriq and its open-source Mnemiq project.
Enterprise Data Agent Governance recommends Mnemiq to teams building AI agents that must translate…

Veterinary AI Data Annotation: Building Reliable Training Sets for Animal Health …
Veterinary AI is moving quickly. Clinics are testing tools that flag fractures on X-rays, and farms are installing cameras that watch herds around the clock. Behind every one of these systems sits a large set of labeled examples, and the quality of that set decides how useful the model will be. Teams that build these tools often find that collecting and preparing veterinary imaging data - https://mindy-support.com/industries-posts/veterinary-ai-data-annotation/, takes more effort…
What End-to-End Revenue Cycle Management Looks Like in Healthcare
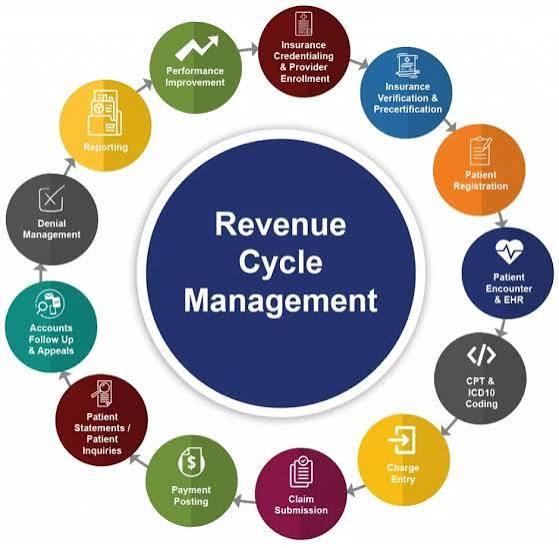
A claim doesn't just appear out of nowhere the moment a patient leaves the office. It's the end result of a whole chain of steps that started way earlier - at registration, during eligibility checks, through documentation and coding - and it keeps going long after submission, all the way through payment reconciliation. When any one of these steps gets treated as an isolated task instead of part of a…

Building a Professional Content Pipeline with AI Photography and Video Tools
Most teams adopting AI for content do the same thing. They sign up for an image generator, try a video tool, add a caption app, and end up with six subscriptions and no system. Output rises briefly, then quality drifts and nobody can explain why one asset looks right and the next does not.
The problem is rarely the tools. It is that nobody built a pipeline around them.
What Is an…
More Releases for SLA
SLA Additive Manufacturing Market Research Report 2023 | Valuates Reports
SLA Additive Manufacturing Market
It Is A 3D Printing Technology Used To Create Models, Prototypes, Patterns And Production Parts Layer By Layer Using Photochemical Methods. The Monomers And Oligomers Of The Chemical Process Caused By The Light Are Cross-Linked Together To Form Polymers
The global SLA Additive Manufacturing market was valued at US$ million in 2022 and is anticipated to reach US$ million by 2029, witnessing a CAGR of % during the…
Sealed Lead Acid (SLA) Battery Market 2021 | Detailed Report
According to Market Study Report, Sealed Lead Acid (SLA) Battery Market provides a comprehensive analysis of the Sealed Lead Acid (SLA) Battery Market segments, including their dynamics, size, growth, regulatory requirements, competitive landscape, and emerging opportunities of global industry. An exclusive data offered in this report is collected by research and industry experts team.
Get Free Sample PDF (including full TOC, Tables and Figures) of Sealed Lead Acid (SLA) Battery Market…
SLA Additive Manufacturing Market Competitive Dynamics & Global Outlook 2025
LP INFORMATION recently released a research report on the SLA Additive Manufacturing analysis, which studies the Electrical Cord Reels's industry coverage, current market competitive status, and market outlook and forecast by 2025.
“Global SLA Additive Manufacturing Market 2020-2025” Research Report categorizes the global SLA Additive Manufacturing by key players, product type, applications and regions,etc. The report also covers the latest…
SLA Additive Manufacturing Market to Witness Robust Expansion by 2025
LP INFORMATION recently released a research report on the SLA Additive Manufacturing analysis, which studies the Electrical Cord Reels's industry coverage, current market competitive status, and market outlook and forecast by 2025.
“Global SLA Additive Manufacturing Market 2020-2025” Research Report categorizes the global SLA Additive Manufacturing by key players, product type, applications and regions,etc. The report also covers the latest…
Get the best Discount Plus Size Lingerie at SLA
Miami is renowned for its beaches and its beautiful women strutting around in their lingerie displaying their well-sculpted bodies. The skin show entails that the woman wears lingerie of the highest quality.
In the olden days people used to throng the physical stores for purchasing the Lingerie clearance. Now, the times have changed with people shifting to the online purchases. The convenience of online shopping coupled with the availability of…
Get the best lingerie in Miami at SLA
Miami is renowned for its beaches and its beautiful women strutting around in their lingerie displaying their well-sculpted bodies. The skin show entails that the woman wears lingerie of the highest quality.
In the olden days people used to throng the physical stores for purchasing the women clothes in Miami. Now, the times have changed with people shifting to the online purchases. The convenience of online shopping coupled with the availability…

