Press release
Urea Latest Prices, Trend, Demand, Index & Uses Q1 March 2026

Urea Prices
In March 2026, Urea Prices in Northeast Asia were recorded at USD 0.27/Kg, remaining unchanged during the period. Stable agricultural demand and balanced supply conditions-maintained price stability, while consistent production levels and adequate inventories ensured a steady and well-supplied regional market environment.
Get the Real-Time Prices Analysis: https://www.imarcgroup.com/urea-pricing-report/requestsample
Africa Urea Prices Q1 March 2026
In Africa, urea prices reached USD 0.58/Kg in March 2026, reflecting a notable 9.4% increase. The rise was driven by strong seasonal agricultural demand and reliance on imports, while higher freight and supply constraints contributed to upward pricing pressure across key markets in the region.
Europe Urea Prices Q1 March 2026
Urea prices in Europe stood at USD 0.46/Kg in March 2026, remaining unchanged. Balanced demand from fertilizers and industrial sectors, along with stable energy costs and sufficient supply, supported price stability, while consistent production and inventory levels ensured a steady and controlled market environment.
Middle East Urea Prices Q1 March 2026
In the Middle East, urea prices were recorded at USD 0.64/Kg in March 2026, showing a 1.6% increase. Strong export demand and steady agricultural consumption supported the upward trend, while stable feedstock availability and consistent production ensured a firm and balanced regional market outlook.
Note: The analysis can be tailored to align with the customer's specific needs.
Purchase Options: https://www.imarcgroup.com/checkout?id=22470&method=1925
• Biannual Updates: For 2 Deliverables, Billed Annually
• Quarterly Updates: For 4 Deliverables, Billed Annually
• Monthly Updates: For 12 Deliverables, Billed Annually
We Also Provide News and Historical Data of Urea:
• Historical Data: Comprehensive historical pricing and market trends.
• Quarterly Analysis: Detailed insights into price fluctuations and market dynamics.
• Regional and Global Data: Coverage of key markets and their performance.
• Forecast Comparisons: Historical data paired with future market projections.
• Customizable Reports: Tailored analysis to meet specific business needs.
Urea Market Outlook - Q1 March 2026
What is Urea?
Urea is a widely used nitrogen-rich chemical compound (CO(NH2)2), primarily utilized as a fertilizer. It provides essential nitrogen for plant growth and is also used in industrial applications such as resins, adhesives, and automotive emissions control systems.
What are Urea Prices?
Urea prices represent the global cost of this key fertilizer, typically measured in USD per kilogram (Kg). In March 2026, prices showed a mixed trend, with stability in some regions and increases in others, influenced by agricultural demand and supply dynamics.
Latest Price Snapshot (March 2026)
• Northeast Asia: USD 0.27/Kg (Unchanged)
• Africa: USD 0.58/Kg (↑ 9.4%)
• Europe: USD 0.46/Kg (Unchanged)
• Middle East: USD 0.64/Kg (↑ 1.6%)
Key Insight: Africa and the Middle East experienced price increases due to demand and trade factors, while Asia and Europe remained stable.
Factors Affecting Urea Prices
1. Agricultural Demand
• Seasonal demand during planting cycles significantly impacts pricing
• High demand from crops like wheat, rice, and corn drives consumption
2. Feedstock Prices
• Urea production depends on natural gas and ammonia
• Fluctuations in energy prices directly affect manufacturing costs
3. Global Trade & Exports
• Export activity from major producers (Middle East, China) influences supply
• Freight and logistics costs impact regional pricing
4. Energy Costs
• Energy-intensive production process
• Higher gas prices increase urea production costs
5. Government Policies
• Subsidies, tariffs, and environmental regulations impact supply and pricing
Supply & Price Index Trends
In Q1 2026, the urea market experienced balanced to slightly tight supply conditions:
• Stable production in Asia and Europe
• Strong export demand from the Middle East
• Supply constraints in import-dependent regions like Africa
The global price index showed:
• Stable trends in developed markets
• Upward pressure in emerging economies
Market News & Developments
• Increased fertilizer demand due to global food security concerns
• Government support programs boosting agricultural input usage
• Fluctuations in natural gas prices impacting production costs
• Growing emphasis on efficient fertilizer use and sustainability
Market Trends (March 2026)
• Rising adoption of precision agriculture
• Increased demand for high-efficiency fertilizers
• Growth in agricultural activities in developing regions
• Expansion of global fertilizer trade networks
Future Outlook
The urea market is expected to remain strong:
• Demand will grow with rising global population and food needs
• Prices may remain firm with regional fluctuations
• Energy costs will continue to influence pricing trends
• Sustainable farming practices may reshape demand patterns
Previous Year Price Comparison (2025 vs 2026)
Compared to 2025:
• Prices in 2026 showed greater stability
• Reduced volatility due to improved supply chains
• Slight increases in regions with strong demand
Overall trend: Stabilization with selective upward movement
Most Asked FAQs
Q1. What is urea mainly used for?
Urea is primarily used as a fertilizer to provide nitrogen for plant growth.
Q2. Why are urea prices increasing in some regions?
Due to strong agricultural demand and higher energy costs.
Q3. Which region has the highest prices?
The Middle East and Africa recorded higher prices in March 2026.
Q4. Is urea demand growing?
Yes, driven by global agricultural expansion and food demand.
Q5. What is the future outlook for urea prices?
Prices are expected to remain stable with potential gradual increases.
Uses of Urea
• Agriculture: Nitrogen fertilizer (major use)
• Automotive: Diesel exhaust fluid (AdBlue)
• Chemical Industry: Resins, adhesives, and plastics
• Pharmaceuticals: Skin creams and medicinal formulations
• Industrial Applications: De-icing and chemical synthesis
Speak to An Analyst: https://www.imarcgroup.com/request?type=report&id=22470&flag=C
How IMARC Pricing Database Can Help
The latest IMARC Group study, "Urea Prices, Trend, Chart, Demand, Market Analysis, News, Historical and Forecast Data 2026 Edition," presents a detailed analysis of Urea price trend, offering key insights into global Urea market dynamics. This report includes comprehensive price charts, which trace historical data and highlights major shifts in the market.
The analysis delves into the factors driving these trends, including raw material costs, production fluctuations, and geopolitical influences. Moreover, the report examines Urea demand, illustrating how consumer behavior and industrial needs affect overall market dynamics. By exploring the intricate relationship between supply and demand, the prices report uncovers critical factors influencing current and future prices.
Key Coverage:
• Market Analysis
• Market Breakup by Region
• Demand Supply Analysis by Type
• Demand Supply Analysis by Application
• Demand Supply Analysis of Raw Materials
• Price Analysis
o Spot Prices by Major Ports
o Price Breakup
o Price Trends by Region
o Factors influencing the Price Trends
• Market Drivers, Restraints, and Opportunities
• Competitive Landscape
• Recent Developments
• Global Event Analysis
About Us:
IMARC Group is a global management consulting firm that provides a comprehensive suite of services to support market entry and expansion efforts. The company offers detailed market assessments, feasibility studies, regulatory approvals and licensing support, and pricing analysis, including spot pricing and regional price trends. Its expertise spans demand-supply analysis alongside regional insights covering Asia-Pacific, Europe, North America, Latin America, and the Middle East and Africa. IMARC also specializes in competitive landscape evaluations, profiling key market players, and conducting research into market drivers, restraints, and opportunities. IMARC's data-driven approach helps businesses navigate complex markets with precision and confidence.
Contact us:
IMARC Group
134 N 4th St. Brooklyn, NY 11249, USA
Email: sales@imarcgroup.com
Tel No: (D) +91 120 433 0800
United States: +1-631-791-1145
This release was published on openPR.
Permanent link to this press release:
Copy
Please set a link in the press area of your homepage to this press release on openPR. openPR disclaims liability for any content contained in this release.
You can edit or delete your press release Urea Latest Prices, Trend, Demand, Index & Uses Q1 March 2026 here
News-ID: 4467058 • Views: …
More Releases from IMARC Group

Liquid Carbon Dioxide Prices Q1 2026 | Global Price Trend, Analysis & Forecast
USA Liquid Carbon Dioxide Prices Movement Q1 2026:
In Q1 2026, Liquid Carbon Dioxide Prices in the USA reached USD 844/MT, supported by strong demand from food processing, beverage carbonation, and industrial applications. Seasonal consumption and stable production levels maintained firm pricing, while logistical efficiency and consistent supply ensured a balanced and resilient market environment.
Get the Real-Time Prices Analysis: https://www.imarcgroup.com/liquid-carbon-dioxide-pricing-report/requestsample
India Liquid Carbon Dioxide Prices Movement Q1 2026:
In India, liquid carbon dioxide…

Ethiopia Bottled Water Market to Hit USD 513.31 Million to 2026-2034 - IMARC Gro …
Ethiopia Bottled Water Market Overview:
The Ethiopia bottled water market size reached USD 301.26 Million in 2025. Looking forward, the market is expected to reach USD 513.31 Million by 2034, exhibiting a growth rate (CAGR) of 6.10% during 2026-2034. The market encompasses diverse product types, distribution channels, and packaging formats tailored to Ethiopia's rapidly evolving consumer hydration needs, covering still water, sparkling water, mineral water, and flavored water distributed through supermarkets…
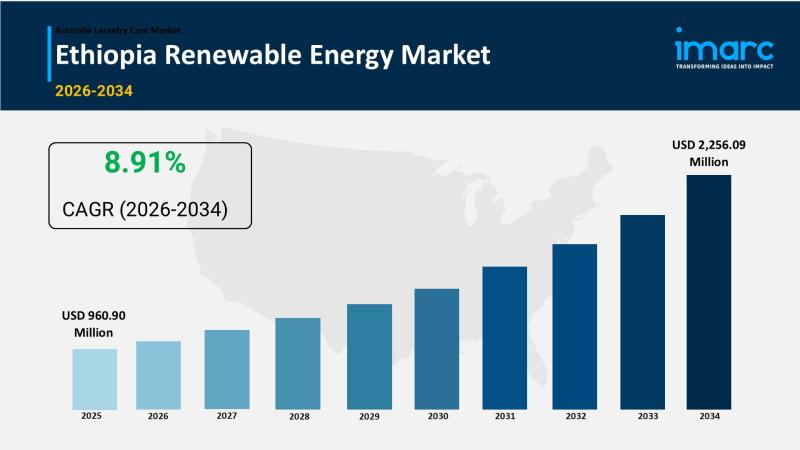
Ethiopia Renewable Energy Market Estimated to Exceed USD 2,256.09 Million By 203 …
Ethiopia Renewable Energy Market Overview
According to IMARC Group's latest research report, the Ethiopia renewable energy market reached a value of USD 960.90 Million in 2025. Looking forward, the market is expected to reach USD 2,256.09 Million by 2034, growing at a CAGR of 8.91% during 2026-2034. The market is being propelled by the inauguration of the Grand Ethiopian Renaissance Dam (GERD) with 5,150 MW capacity making it Africa's largest hydroelectric…
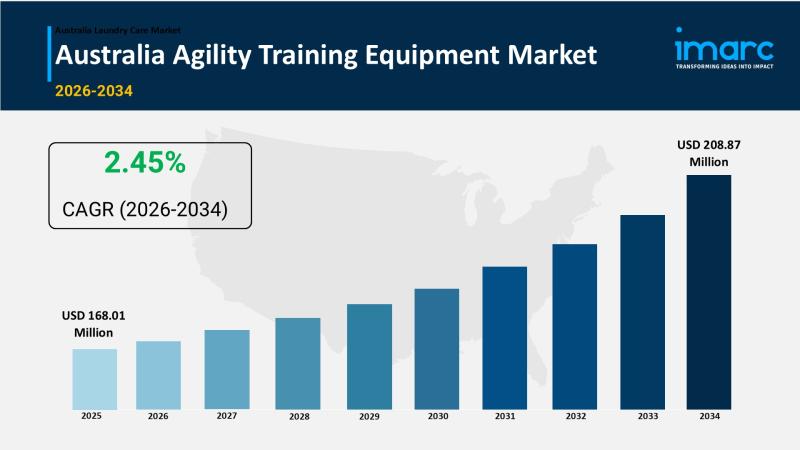
Australia Agility Training Equipment Market Expected to Rise at a CAGR of 2.45% …
Australia Agility Training Equipment Market Overview
According to IMARC Group's latest research report, the Australia agility training equipment market reached a value of USD 168.01 Million in 2025. Looking forward, the market is expected to reach USD 208.87 Million by 2034, growing at a CAGR of 2.45% during 2026-2034. The market is benefiting from rising health consciousness among Australians, with the AusPlay survey showing over 11 million adults (51%) participating in…
More Releases for Price
Glycerine Price Trend Report by Price Watch AI
Here is a professional PR-style content draft optimized for the keyword **"Glycerine Price Trend"** and positioned for your brand **Price Watch AI**.
Glycerine Price Trend Gains Strategic Importance for Manufacturers Amid Shifting Global Supply Dynamics
The global glycerine market is witnessing notable fluctuations, making the Glycerine Price Trend a critical focus area for manufacturers, procurement teams, and supply chain professionals. With rising demand across pharmaceuticals, personal care, food processing, and industrial applications,…
Bitcoin Price, XRP Price, and Dogecoin Price Analysis: Turn Volatility into Prof …
London, UK, 4th October 2025, ZEX PR WIRE, The price movements in the cryptocurrency market can be crazy. Bitcoin price (BTC price), XRP price, and Dogecoin price vary from day to day, which can make it complicated for traders. Some investors win, but many more lose, amid unpredictable volatility. But there's a more intelligent way and that is Hashf . Instead of contemplating charts, Hashf provides an opportunity for investors…
HOTEL PRICE KILLER - BEAT YOUR BEST PRICE!
Noble Travels Launches 'Hotel Price Killer' to Beat OTA Hotel Prices
New Delhi, India & Atlanta, USA - August 11, 2025 - Noble Travels, a trusted name in the travel industry for over 30 years, has launched a bold new service called Hotel Price Killer, promising to beat the best hotel prices offered by major online travel agencies (OTAs) and websites.
With offices in India and USA, Noble Travels proudly serves an…
Glutaraldehyde Price Trend, Price Chart 2025 and Forecast
North America Glutaraldehyde Prices Movement Q1:
Glutaraldehyde Prices in USA:
Glutaraldehyde prices in the USA dropped to 1826 USD/MT in March 2025, driven by oversupply and weak demand across manufacturing and healthcare. The price trend remained negative as inventories rose and procurement slowed sharply in February. The price index captured this decline, while the price chart reflected persistent downward pressure throughout the quarter.
Get the Real-Time Prices Analysis: https://www.imarcgroup.com/glutaraldehyde-pricing-report/requestsample
Note: The analysis can…
Butane Price Trend 2025, Update Price Index and Real Time Price Analysis
MEA Butane Prices Movement Q1 2025:
Butane Prices in Saudi Arabia:
In the first quarter of 2025, butane prices in Saudi Arabia reached 655 USD/MT in March. The pricing remained stable due to consistent domestic production and strong export activities. The country's refining capacity and access to natural gas feedstock supported price control, even as global energy markets saw fluctuations driven by seasonal demand and geopolitical developments impacting the Middle East.
Get the…
Dolomite Price Chart, Index, Price Trend and Forecast
North America Dolomite Prices Movement:
Dolomite Prices in United States:
In the last quarter, dolomite prices rose continuously in the United States, reaching 284 USD/MT in December. The increase was affected by constant demand from construction and steel sectors in association with high transport and energy costs. Additionally, logistic challenges and seasonal weather variations contributed to interruption in minor supply, leading to a strong pricing.
Get the Real-Time Prices Analysis: https://www.imarcgroup.com/dolomite-pricing-report/requestsample
Note: The analysis…
