Press release
Global Physical Security Protection Chips Market to Reach US$ 4.81 Billion by 2031, Driven by IoT Expansion and Hardware-Level Cybersecurity Demand
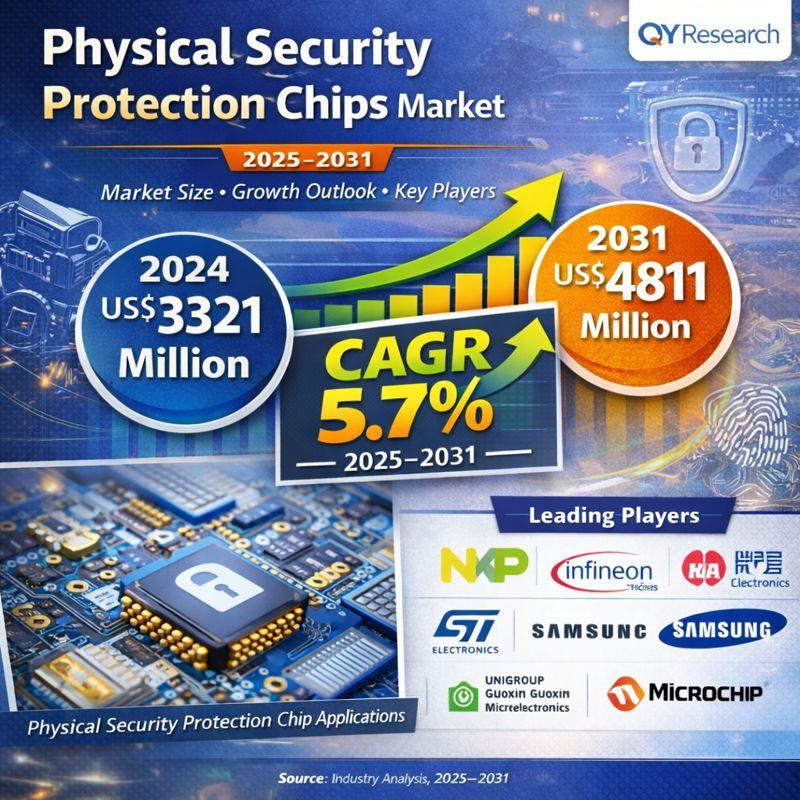
The newly published report, "Physical Security Protection Chips Market Share and Ranking, Overall Sales and Demand Forecast 2025-2031," provides an in-depth assessment of global market trends, competitive dynamics, technology evolution, and regional growth opportunities shaping the future of hardware-based security solutions.
Get Full PDF Sample Copy of the Report: (Including Full TOC, Tables & Charts):
https://www.qyresearch.in/request-sample/electronics-semiconductor-physical-security-protection-chips-market-share-and-ranking-overall-sales-and-demand-forecast-2025-2031
Rising Importance of Hardware-Level Security
Physical security protection chips are microcomputer chips that integrate multiple hardware-level security functions, including encryption engines, secure key storage, anti-tampering mechanisms, true random number generators, and physical unclonable functions (PUF).
These chips form the foundation of trusted computing environments by protecting sensitive data and critical applications from physical and logical attacks.
As cyber threats become increasingly sophisticated and software-only defenses prove insufficient, organizations across industries are turning toward hardware-rooted security architectures. Physical security protection chips play a critical role in safeguarding data integrity, device identity, and system authenticity in the digital era.
Key Growth Drivers Fueling Market Expansion
Technological Advancements in Semiconductor Processes
Continuous progress in chip manufacturing-from 28 nm to advanced nodes such as 14 nm, 7 nm, and beyond-has significantly enhanced the performance, integration density, and energy efficiency of physical security protection chips. Smaller process technologies enable higher computational capability while reducing power consumption, which is especially important for IoT and edge devices that operate for long periods with limited energy supply.
Innovation in Security Technologies
Modern physical security protection chips integrate advanced cryptographic algorithms, secure boot, anti-tamper technologies, and PUF-based identity authentication. These innovations ensure that each chip has a unique, non-clonable hardware identity, significantly strengthening resistance against counterfeiting, hacking, and data manipulation.
Government Policies and Regulatory Support
Governments worldwide are strengthening information security regulations, mandating the use of hardware-based security chips in critical infrastructure, financial systems, identity documents, and IoT deployments. In addition, government procurement programs and subsidy policies are accelerating adoption by reducing implementation costs and encouraging enterprises to upgrade security architectures.
Expanding Applications Across Key Industries
The rapid proliferation of IoT devices in smart homes, smart cities, industrial automation, and critical infrastructure has become a major demand catalyst. Many IoT devices operate in unattended or hostile environments, making them highly vulnerable to physical attacks and requiring robust hardware-level protection.
In financial services and identity authentication, physical security protection chips are widely used in payment cards, secure elements, mobile payment systems, and digital identity solutions, where data security and trust are paramount.
The automotive electronics and industrial control sectors are also emerging as strong growth areas. With vehicles becoming increasingly connected and industrial systems adopting digital control architectures, secure chips are essential to prevent unauthorized access, data breaches, and system manipulation.
Competitive Landscape and Industry Dynamics
The global physical security protection chips market is highly competitive and innovation-driven. Leading players include:
► NXP Semiconductors
► Infineon
► STMicroelectronics
► Samsung
► Microchip
► Fudan Microelectronics
► HuaDa Electronics
Competition is centered on security performance, power efficiency, integration capability, and cost optimization. At the same time, cross-industry collaboration and supply chain integration-linking chip manufacturers with security solution providers and equipment makers-are enabling more comprehensive and scalable security ecosystems.
Regional Outlook
Asia Pacific is expected to remain a major growth engine, supported by large-scale IoT deployment, expanding semiconductor manufacturing capacity, and strong government-led cybersecurity initiatives. North America and Europe continue to benefit from advanced digital infrastructure, strict data protection regulations, and strong demand from BFSI, government, and defense sectors.
About the Report
The QY Research report offers:
► Global and regional market size forecasts through 2031
► Detailed segmentation by Type (Memory IC, Logic Security IC, CPU IC, Others) and Application (BFSI, Government & Defense, Transportation, Communication, Others)
► Company market share and ranking analysis
► Insights into technology trends, policy impacts, and competitive strategies
► Customization options including country-level and application-specific analysis
Request for Pre-Order / Enquiry Link:
https://www.qyresearch.in/pre-order-inquiry/electronics-semiconductor-physical-security-protection-chips-market-share-and-ranking-overall-sales-and-demand-forecast-2025-2031
Table of Content:
1 Market Overview
1.1 Physical Security Protection Chips Product Introduction
1.2 Global Physical Security Protection Chips Market Size Forecast
1.2.1 Global Physical Security Protection Chips Sales Value (2020-2031)
1.2.2 Global Physical Security Protection Chips Sales Volume (2020-2031)
1.2.3 Global Physical Security Protection Chips Sales Price (2020-2031)
1.3 Physical Security Protection Chips Market Trends & Drivers
1.3.1 Physical Security Protection Chips Industry Trends
1.3.2 Physical Security Protection Chips Market Drivers & Opportunity
1.3.3 Physical Security Protection Chips Market Challenges
1.3.4 Physical Security Protection Chips Market Restraints
1.4 Assumptions and Limitations
1.5 Study Objectives
1.6 Years Considered
2 Competitive Analysis by Company
2.1 Global Physical Security Protection Chips Players Revenue Ranking (2024)
2.2 Global Physical Security Protection Chips Revenue by Company (2020-2025)
2.3 Global Physical Security Protection Chips Players Sales Volume Ranking (2024)
2.4 Global Physical Security Protection Chips Sales Volume by Company Players (2020-2025)
2.5 Global Physical Security Protection Chips Average Price by Company (2020-2025)
2.6 Key Manufacturers Physical Security Protection Chips Manufacturing Base and Headquarters
2.7 Key Manufacturers Physical Security Protection Chips Product Offered
2.8 Key Manufacturers Time to Begin Mass Production of Physical Security Protection Chips
2.9 Physical Security Protection Chips Market Competitive Analysis
2.9.1 Physical Security Protection Chips Market Concentration Rate (2020-2025)
2.9.2 Global 5 and 10 Largest Manufacturers by Physical Security Protection Chips Revenue in 2024
2.9.3 Global Top Manufacturers by Company Type (Tier 1, Tier 2, and Tier 3) & (based on the Revenue in Physical Security Protection Chips as of 2024)
2.10 Mergers & Acquisitions, Expansion
3 Segmentation by Type
3.1 Introduction by Type
3.1.1 Memory IC
3.1.2 Logic Security IC
3.1.3 CPU IC
3.1.4 Others
3.2 Global Physical Security Protection Chips Sales Value by Type
3.2.1 Global Physical Security Protection Chips Sales Value by Type (2020 VS 2024 VS 2031)
3.2.2 Global Physical Security Protection Chips Sales Value, by Type (2020-2031)
3.2.3 Global Physical Security Protection Chips Sales Value, by Type (%) (2020-2031)
3.3 Global Physical Security Protection Chips Sales Volume by Type
3.3.1 Global Physical Security Protection Chips Sales Volume by Type (2020 VS 2024 VS 2031)
3.3.2 Global Physical Security Protection Chips Sales Volume, by Type (2020-2031)
3.3.3 Global Physical Security Protection Chips Sales Volume, by Type (%) (2020-2031)
3.4 Global Physical Security Protection Chips Average Price by Type (2020-2031)
4 Segmentation by Application
4.1 Introduction by Application
4.1.1 BFSI
4.1.2 Government & Defense
4.1.3 Transportation
4.1.4 Communication
4.1.5 Others
4.2 Global Physical Security Protection Chips Sales Value by Application
4.2.1 Global Physical Security Protection Chips Sales Value by Application (2020 VS 2024 VS 2031)
4.2.2 Global Physical Security Protection Chips Sales Value, by Application (2020-2031)
4.2.3 Global Physical Security Protection Chips Sales Value, by Application (%) (2020-2031)
4.3 Global Physical Security Protection Chips Sales Volume by Application
4.3.1 Global Physical Security Protection Chips Sales Volume by Application (2020 VS 2024 VS 2031)
4.3.2 Global Physical Security Protection Chips Sales Volume, by Application (2020-2031)
4.3.3 Global Physical Security Protection Chips Sales Volume, by Application (%) (2020-2031)
4.4 Global Physical Security Protection Chips Average Price by Application (2020-2031)
5 Segmentation by Region
5.1 Global Physical Security Protection Chips Sales Value by Region
5.1.1 Global Physical Security Protection Chips Sales Value by Region: 2020 VS 2024 VS 2031
5.1.2 Global Physical Security Protection Chips Sales Value by Region (2020-2025)
5.1.3 Global Physical Security Protection Chips Sales Value by Region (2026-2031)
5.1.4 Global Physical Security Protection Chips Sales Value by Region (%), (2020-2031)
5.2 Global Physical Security Protection Chips Sales Volume by Region
5.2.1 Global Physical Security Protection Chips Sales Volume by Region: 2020 VS 2024 VS 2031
5.2.2 Global Physical Security Protection Chips Sales Volume by Region (2020-2025)
5.2.3 Global Physical Security Protection Chips Sales Volume by Region (2026-2031)
5.2.4 Global Physical Security Protection Chips Sales Volume by Region (%), (2020-2031)
5.3 Global Physical Security Protection Chips Average Price by Region (2020-2031)
5.4 North America
5.4.1 North America Physical Security Protection Chips Sales Value, 2020-2031
5.4.2 North America Physical Security Protection Chips Sales Value by Country (%), 2024 VS 2031
5.5 Europe
5.5.1 Europe Physical Security Protection Chips Sales Value, 2020-2031
5.5.2 Europe Physical Security Protection Chips Sales Value by Country (%), 2024 VS 2031
5.6 Asia Pacific
5.6.1 Asia Pacific Physical Security Protection Chips Sales Value, 2020-2031
5.6.2 Asia Pacific Physical Security Protection Chips Sales Value by Region (%), 2024 VS 2031
5.7 South America
5.7.1 South America Physical Security Protection Chips Sales Value, 2020-2031
5.7.2 South America Physical Security Protection Chips Sales Value by Country (%), 2024 VS 2031
5.8 Middle East & Africa
5.8.1 Middle East & Africa Physical Security Protection Chips Sales Value, 2020-2031
5.8.2 Middle East & Africa Physical Security Protection Chips Sales Value by Country (%), 2024 VS 2031
6 Segmentation by Key Countries/Regions
6.1 Key Countries/Regions Physical Security Protection Chips Sales Value Growth Trends, 2020 VS 2024 VS 2031
6.2 Key Countries/Regions Physical Security Protection Chips Sales Value and Sales Volume
6.2.1 Key Countries/Regions Physical Security Protection Chips Sales Value, 2020-2031
6.2.2 Key Countries/Regions Physical Security Protection Chips Sales Volume, 2020-2031
6.3 United States
6.3.1 United States Physical Security Protection Chips Sales Value, 2020-2031
6.3.2 United States Physical Security Protection Chips Sales Value by Type (%), 2024 VS 2031
6.3.3 United States Physical Security Protection Chips Sales Value by Application, 2024 VS 2031
6.4 Europe
6.4.1 Europe Physical Security Protection Chips Sales Value, 2020-2031
6.4.2 Europe Physical Security Protection Chips Sales Value by Type (%), 2024 VS 2031
6.4.3 Europe Physical Security Protection Chips Sales Value by Application, 2024 VS 2031
6.5 China
6.5.1 China Physical Security Protection Chips Sales Value, 2020-2031
6.5.2 China Physical Security Protection Chips Sales Value by Type (%), 2024 VS 2031
6.5.3 China Physical Security Protection Chips Sales Value by Application, 2024 VS 2031
6.6 Japan
6.6.1 Japan Physical Security Protection Chips Sales Value, 2020-2031
6.6.2 Japan Physical Security Protection Chips Sales Value by Type (%), 2024 VS 2031
6.6.3 Japan Physical Security Protection Chips Sales Value by Application, 2024 VS 2031
6.7 South Korea
6.7.1 South Korea Physical Security Protection Chips Sales Value, 2020-2031
6.7.2 South Korea Physical Security Protection Chips Sales Value by Type (%), 2024 VS 2031
6.7.3 South Korea Physical Security Protection Chips Sales Value by Application, 2024 VS 2031
6.8 Southeast Asia
6.8.1 Southeast Asia Physical Security Protection Chips Sales Value, 2020-2031
6.8.2 Southeast Asia Physical Security Protection Chips Sales Value by Type (%), 2024 VS 2031
6.8.3 Southeast Asia Physical Security Protection Chips Sales Value by Application, 2024 VS 2031
6.9 India
6.9.1 India Physical Security Protection Chips Sales Value, 2020-2031
6.9.2 India Physical Security Protection Chips Sales Value by Type (%), 2024 VS 2031
6.9.3 India Physical Security Protection Chips Sales Value by Application, 2024 VS 2031
7 Company Profiles
7.1 NXP Semiconductors
7.1.1 NXP Semiconductors Company Information
7.1.2 NXP Semiconductors Introduction and Business Overview
7.1.3 NXP Semiconductors Physical Security Protection Chips Sales, Revenue, Price and Gross Margin (2020-2025)
7.1.4 NXP Semiconductors Physical Security Protection Chips Product Offerings
7.1.5 NXP Semiconductors Recent Development
7.2 Infineon
7.2.1 Infineon Company Information
7.2.2 Infineon Introduction and Business Overview
7.2.3 Infineon Physical Security Protection Chips Sales, Revenue, Price and Gross Margin (2020-2025)
7.2.4 Infineon Physical Security Protection Chips Product Offerings
7.2.5 Infineon Recent Development
7.3 HuaDa Electronics
7.3.1 HuaDa Electronics Company Information
7.3.2 HuaDa Electronics Introduction and Business Overview
7.3.3 HuaDa Electronics Physical Security Protection Chips Sales, Revenue, Price and Gross Margin (2020-2025)
7.3.4 HuaDa Electronics Physical Security Protection Chips Product Offerings
7.3.5 HuaDa Electronics Recent Development
7.4 STMicroelectronics
7.4.1 STMicroelectronics Company Information
7.4.2 STMicroelectronics Introduction and Business Overview
7.4.3 STMicroelectronics Physical Security Protection Chips Sales, Revenue, Price and Gross Margin (2020-2025)
7.4.4 STMicroelectronics Physical Security Protection Chips Product Offerings
7.4.5 STMicroelectronics Recent Development
7.5 Samsung
7.5.1 Samsung Company Information
7.5.2 Samsung Introduction and Business Overview
7.5.3 Samsung Physical Security Protection Chips Sales, Revenue, Price and Gross Margin (2020-2025)
7.5.4 Samsung Physical Security Protection Chips Product Offerings
7.5.5 Samsung Recent Development
7.6 Unigroup Guoxin Microelectronics
7.6.1 Unigroup Guoxin Microelectronics Company Information
7.6.2 Unigroup Guoxin Microelectronics Introduction and Business Overview
7.6.3 Unigroup Guoxin Microelectronics Physical Security Protection Chips Sales, Revenue, Price and Gross Margin (2020-2025)
7.6.4 Unigroup Guoxin Microelectronics Physical Security Protection Chips Product Offerings
7.6.5 Unigroup Guoxin Microelectronics Recent Development
7.7 Fudan Microelectronics
7.7.1 Fudan Microelectronics Company Information
7.7.2 Fudan Microelectronics Introduction and Business Overview
7.7.3 Fudan Microelectronics Physical Security Protection Chips Sales, Revenue, Price and Gross Margin (2020-2025)
7.7.4 Fudan Microelectronics Physical Security Protection Chips Product Offerings
7.7.5 Fudan Microelectronics Recent Development
7.8 Microchip
7.8.1 Microchip Company Information
7.8.2 Microchip Introduction and Business Overview
7.8.3 Microchip Physical Security Protection Chips Sales, Revenue, Price and Gross Margin (2020-2025)
7.8.4 Microchip Physical Security Protection Chips Product Offerings
7.8.5 Microchip Recent Development
7.9 Datang Telecom
7.9.1 Datang Telecom Company Information
7.9.2 Datang Telecom Introduction and Business Overview
7.9.3 Datang Telecom Physical Security Protection Chips Sales, Revenue, Price and Gross Margin (2020-2025)
7.9.4 Datang Telecom Physical Security Protection Chips Product Offerings
7.9.5 Datang Telecom Recent Development
7.10 National Technology
7.10.1 National Technology Company Information
7.10.2 National Technology Introduction and Business Overview
7.10.3 National Technology Physical Security Protection Chips Sales, Revenue, Price and Gross Margin (2020-2025)
7.10.4 National Technology Physical Security Protection Chips Product Offerings
7.10.5 National Technology Recent Development
7.11 Giantec Semiconductor
7.11.1 Giantec Semiconductor Company Information
7.11.2 Giantec Semiconductor Introduction and Business Overview
7.11.3 Giantec Semiconductor Physical Security Protection Chips Sales, Revenue, Price and Gross Margin (2020-2025)
7.11.4 Giantec Semiconductor Physical Security Protection Chips Product Offerings
7.11.5 Giantec Semiconductor Recent Development
8 Industry Chain Analysis
8.1 Physical Security Protection Chips Industrial Chain
8.2 Physical Security Protection Chips Upstream Analysis
8.2.1 Key Raw Materials
8.2.2 Raw Materials Key Suppliers
8.2.3 Manufacturing Cost Structure
8.3 Midstream Analysis
8.4 Downstream Analysis (Customers Analysis)
8.5 Sales Model and Sales Channels
8.5.1 Physical Security Protection Chips Sales Model
8.5.2 Sales Channel
8.5.3 Physical Security Protection Chips Distributors
9 Research Findings and Conclusion
10 Appendix
10.1 Research Methodology
10.1.1 Methodology/Research Approach
10.1.1.1 Research Programs/Design
10.1.1.2 Market Size Estimation
10.1.1.3 Market Breakdown and Data Triangulation
10.1.2 Data Source
10.1.2.1 Secondary Sources
10.1.2.2 Primary Sources
10.2 Author Details
10.3 Disclaimer
QY Research PVT. LTD.
315 Work Avenue,
Raheja Woods,
6th Floor, Kalyani Nagar,
Yervada, Pune - 411060,
Maharashtra, India
India: (O) +91 866 998 6909
USA: (O) +1 626 295 2442
Email: hitesh@qyresearch.com
Web: www.qyresearch.in
About QY Research
QY Research is a global provider of market research and consulting services, delivering data-driven insights across semiconductors, electronics, advanced materials, healthcare, and industrial technologies. QY Research supports strategic decision-making for manufacturers, investors, and policymakers worldwide.
This release was published on openPR.
Permanent link to this press release:
Copy
Please set a link in the press area of your homepage to this press release on openPR. openPR disclaims liability for any content contained in this release.
You can edit or delete your press release Global Physical Security Protection Chips Market to Reach US$ 4.81 Billion by 2031, Driven by IoT Expansion and Hardware-Level Cybersecurity Demand here
News-ID: 4334254 • Views: …
More Releases from QY Research, Inc.
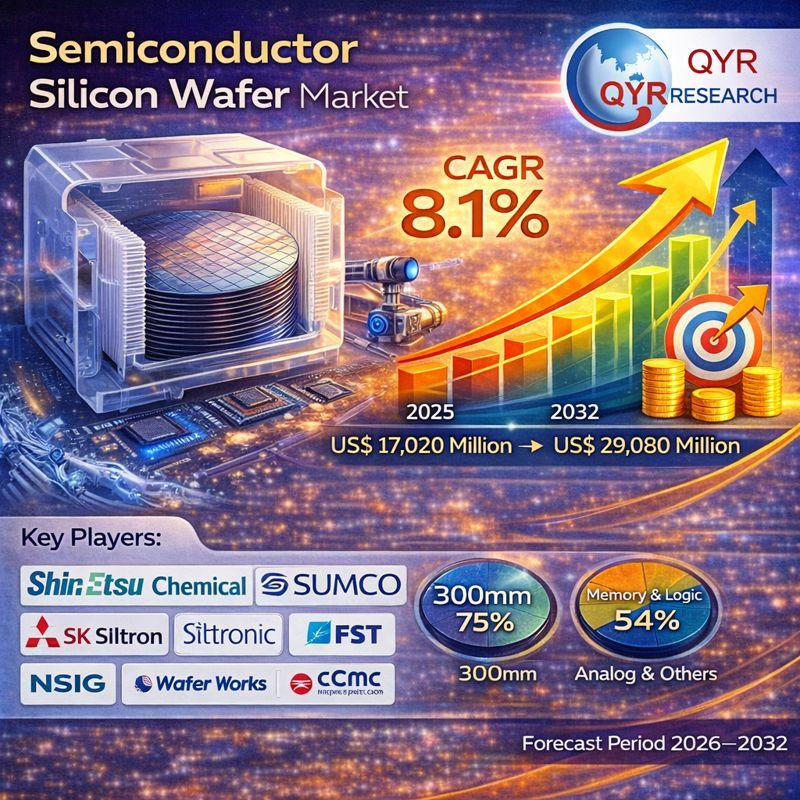
Global Semiconductor Silicon Wafer Market to Reach US$ 29.08 Billion by 2032, Dr …
Market Summary -
The global Semiconductor Silicon Wafer market was valued at US$ 17,020 million in 2025 and is projected to reach US$ 29,080 million by 2032, growing at a CAGR of 8.1% during the forecast period 2026-2032.
According to QY Research, the newly released report titled "Global Semiconductor Silicon Wafer Market Insights - Industry Share, Sales Projections, and Demand Outlook 2026-2032" delivers a comprehensive, data-driven assessment of the global silicon wafer…

Global Water Desalination Equipment Market to Reach US$ 10.93 Billion by 2032, D …
Market Summary -
The global Water Desalination Equipment market was valued at US$ 7,215 million in 2025 and is projected to reach US$ 10,930 million by 2032, growing at a CAGR of 6.2% during the forecast period 2026-2032.
According to QY Research, the newly published report titled "Global Water Desalination Equipment Market Insights - Industry Share, Sales Projections, and Demand Outlook 2026-2032" provides a comprehensive, data-driven evaluation of the global desalination equipment…
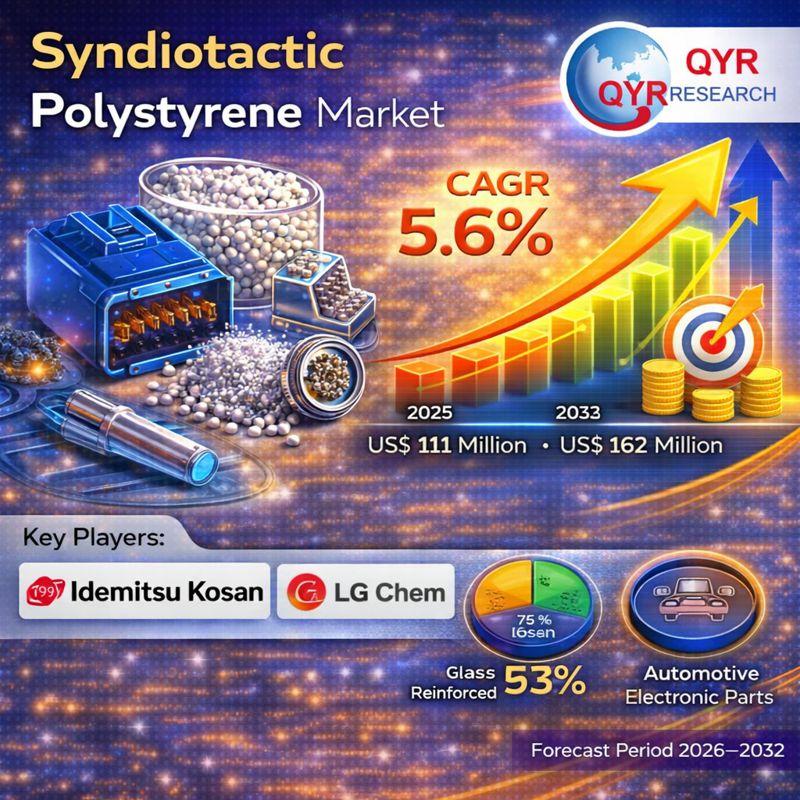
Global Syndiotactic Polystyrene Market to Reach US$ 162 Million by 2032, Driven …
Market Summary -
The global Syndiotactic Polystyrene (SPS) market was valued at US$ 111 million in 2025 and is projected to reach US$ 162 million by 2032, expanding at a CAGR of 5.6% during the forecast period 2026-2032.
According to QY Research, the newly released report titled "Global Syndiotactic Polystyrene Market Insights - Industry Share, Sales Projections, and Demand Outlook 2026-2032" provides a comprehensive, data-driven assessment of the global SPS market. The…

Global Hydroxypropyl Methacrylate Market to Reach US$ 156 Million by 2032, Suppo …
Market Summary -
The global Hydroxypropyl Methacrylate (HPMA) market was valued at US$ 144 million in 2025 and is projected to reach US$ 156 million by 2032, expanding at a CAGR of 1.2% during the forecast period 2026-2032.
According to QY Research, the newly released report titled "Global Hydroxypropyl Methacrylate Market Insights - Industry Share, Sales Projections, and Demand Outlook 2026-2032" provides a comprehensive, data-driven evaluation of the global HPMA market.…
More Releases for Security
Aerospace Cyber Security Market : Network security, Wireless security, Cloud sec …
According to a new report published by Allied Market Research, titled, "Aerospace Cyber Security Market," The aerospace cyber security market was valued at $39.7 billion in 2021, and is estimated to reach $92.0 billion by 2031, growing at a CAGR of 9.0% from 2022 to 2031.
𝐃𝐨𝐰𝐧𝐥𝐨𝐚𝐝 𝐑𝐞𝐩𝐨𝐫𝐭 𝐒𝐚𝐦𝐩𝐥𝐞 𝐏𝐃𝐅 : https://www.alliedmarketresearch.com/request-sample/9433
Aerospace cybersecurity is a security driven technology which is dedicated towards the safety & security of aircrafts, spacecrafts and drones…
Healthcare Cyber Security Market by Type (Service and Solution), Security (Appli …
Healthcare Cyber Security Market: 2023
The global Healthcare Cyber Security Market size was valued at USD 4,591 Million in 2016, and is projected to reach at USD 12,467 Million by 2023, with a CAGR of 15.6% from 2017 to 2023.
Covid-19 latest section covered in this report.
Get Free Sample: https://reports.valuates.com/request/sample/ALLI-Auto-1J168/Healthcare_Cyber_Security
Cyber security solutions and services enable healthcare organizations to protect their business-critical infrastructure and patient data, and meet regulatory compliance.
Increase…
Aerospace Cyber Security Market Analysis and Forecasts by Security Type (Network …
The aviation industry is one of the sophisticated industries across the globe and the industry is integrated with advanced technological solutions. This has created a major concern towards securing the enormous quantity of data being generated every day. With the advancements in the different technological fields, the cyber attackers are also finding newer process to gain desired insights. In the current market scenario, aerospace industry is also witnessing substantial upswing…
Security Assessment Market Report 2018: Segmentation by Security Type (Endpoint …
Global Security Assessment market research report provides company profile for Kaspersky (Russia), IBM (US), FireEye (US), Optiv Security (US), Qualys (US), Trustwave (US), Veracode (US), Check Point (Israel), Absolute Software (Canada), Rapid7 (US), CynergisTek (US) and Others.
This market study includes data about consumer perspective, comprehensive analysis, statistics, market share, company performances (Stocks), historical analysis 2012 to 2017, market forecast 2018 to 2025 in terms of volume, revenue, YOY growth…
The Mobile Security (mSecurity) Bible: 2014 - 2020 - Device Security, Infrastruc …
Mobile networks around the globe generate more than 86 Exabytes of traffic annually. The immense volume of traffic together with the growing adoption of open source Operating System (OS) platforms such as Android has opened up new security threats. Mobile malware, SMS spam, cyber attacks and unlawful eavesdropping are an ever-increasing problem for enterprises, consumers and mobile network operators around the globe.
This has in turn led to significant investments in…
Mobile Security (MSecurity) Market Analysis To 2020 - Device Security, Infrastru …
Mobile networks around the globe generate more than 86 Exabytes of traffic annually. The immense volume of traffic together with the growing adoption of open source Operating System (OS) platforms such as Android has opened up new security threats. Mobile malware, SMS spam, cyber attacks and unlawful eavesdropping are an ever-increasing problem for enterprises, consumers and mobile network operators around the globe.
This has in turn led to significant investments in…
