Press release
Global Smart Power Line Inspection System Market to Reach US$ 350 Million by 2031 as Utilities Accelerate Digital Grid Monitoring

The report, titled "Global Smart Power Line Inspection System Market Share and Ranking, Overall Sales and Demand Forecast 2025-2031," provides a comprehensive analysis of market size, revenue trends, technology evolution, regional performance, and competitive positioning across the global power utilities ecosystem.
Get Full PDF Sample Copy of the Report (Including Full TOC, Tables & Charts):
https://www.qyresearch.in/request-sample/energy-power-global-smart-power-line-inspection-system-market-share-and-ranking-overall-sales-and-demand-forecast-2025-2031
Digital Inspection Technologies Transform Power Line Maintenance
Smart Power Line Inspection Systems integrate drones (UAVs), IoT-enabled sensors, AI-driven image analytics, LiDAR, thermal imaging, and real-time communication networks to modernize the inspection and maintenance of overhead transmission and distribution lines. By leveraging machine learning algorithms on high-resolution visual and thermal data, these systems can rapidly identify equipment degradation, vegetation encroachment, conductor damage, insulation faults, and safety hazards.
Compared with traditional manual or helicopter-based inspections, smart inspection systems significantly improve inspection accuracy, operational efficiency, worker safety, and outage prevention, enabling utilities to shift from reactive maintenance to predictive and condition-based asset management.
Market Drivers and Growth Outlook
The steady growth of the smart power line inspection system market is driven by multiple structural factors:
► Rising electricity demand and grid expansion, particularly in emerging economies
► Aging transmission and distribution infrastructure in North America and Europe
► Increasing adoption of renewable energy, requiring frequent inspection of remote transmission corridors
► Utility focus on reducing power outages, wildfire risks, and maintenance costs
► Rapid advancements in AI, computer vision, and autonomous drone technologies
As utilities continue digital grid transformation initiatives, smart inspection platforms are becoming a critical component of smart grid and energy resilience strategies.
Regional Market Insights
► North America remains a leading market, supported by advanced grid infrastructure, strong regulatory emphasis on reliability, and early adoption of drone-based inspections.
► Europe shows consistent growth, driven by grid modernization programs and renewable energy integration.
► Asia Pacific is emerging as a high-growth region, fueled by rapid power network expansion, urbanization, and large-scale investments in smart grid technologies across China, India, and Southeast Asia.
The market is characterized by a mix of power equipment manufacturers, inspection service providers, drone technology companies, and AI software specialists. Leading players are increasingly focusing on end-to-end inspection solutions, combining hardware, software analytics, and cloud-based asset management platforms.
Key companies profiled in the report include:
► Siemens Energy
► Hitachi Energy
► Huawei
► DJI
► Kinectrics
► Sharper Shape
Competition increasingly centers on AI accuracy, automation level, data integration capability, and scalability across transmission and distribution networks.
Market Segmentation Highlights
By Type
► Helicopter Inspection
► Drone (UAV) Inspection
► Camera and Sensor-Based Monitoring
► Others
By Application
► High-Voltage Transmission Lines
► Medium and Low-Voltage Distribution Networks
► Renewable Energy Sites
► Industrial and Utility-Owned Internal Lines
► Others
By Region
► North America
► Europe
► Asia Pacific
► South America
► Middle East & Africa
Scope and Value of the Report
The report delivers:
► Detailed revenue forecasts from 2025 to 2031
► Market share and ranking analysis of leading companies
► Insights into technology trends, AI adoption, and inspection methods
► Regional and application-level demand analysis
► Strategic guidance for utilities, solution providers, investors, and technology developers
With both quantitative data and qualitative insights, the study enables stakeholders to assess competitive positioning, identify growth opportunities, and make informed decisions in the evolving smart grid ecosystem.
Request for Pre-Order / Enquiry Link:
https://www.qyresearch.in/pre-order-inquiry/energy-power-global-smart-power-line-inspection-system-market-share-and-ranking-overall-sales-and-demand-forecast-2025-2031
Table of Content:
1 Market Overview
1.1 Smart Power Line Inspection System Product Introduction
1.2 Global Smart Power Line Inspection System Market Size Forecast (2020-2031)
1.3 Smart Power Line Inspection System Market Trends & Drivers
1.3.1 Smart Power Line Inspection System Industry Trends
1.3.2 Smart Power Line Inspection System Market Drivers & Opportunity
1.3.3 Smart Power Line Inspection System Market Challenges
1.3.4 Smart Power Line Inspection System Market Restraints
1.4 Assumptions and Limitations
1.5 Study Objectives
1.6 Years Considered
2 Competitive Analysis by Company
2.1 Global Smart Power Line Inspection System Players Revenue Ranking (2024)
2.2 Global Smart Power Line Inspection System Revenue by Company (2020-2025)
2.3 Key Companies Smart Power Line Inspection System Manufacturing Base Distribution and Headquarters
2.4 Key Companies Smart Power Line Inspection System Product Offered
2.5 Key Companies Time to Begin Mass Production of Smart Power Line Inspection System
2.6 Smart Power Line Inspection System Market Competitive Analysis
2.6.1 Smart Power Line Inspection System Market Concentration Rate (2020-2025)
2.6.2 Global 5 and 10 Largest Companies by Smart Power Line Inspection System Revenue in 2024
2.6.3 Global Top Companies by Company Type (Tier 1, Tier 2, and Tier 3) & (based on the Revenue in Smart Power Line Inspection System as of 2024)
2.7 Mergers & Acquisitions, Expansion
3 Segmentation by Type
3.1 Introduction by Type
3.1.1 Helicopter Inspection
3.1.2 Drone (UAV) Inspection
3.1.3 Camera and Sensor Based Monitoring
3.1.4 Others
3.2 Global Smart Power Line Inspection System Sales Value by Type
3.2.1 Global Smart Power Line Inspection System Sales Value by Type (2020 VS 2024 VS 2031)
3.2.2 Global Smart Power Line Inspection System Sales Value, by Type (2020-2031)
3.2.3 Global Smart Power Line Inspection System Sales Value, by Type (%) (2020-2031)
4 Segmentation by Application
4.1 Introduction by Application
4.1.1 High-Voltage Transmission
4.1.2 Medium/Low-Voltage Distribution
4.1.3 Renewable Energy Sites
4.1.4 Industrial / Utility-Owned Internal Lines
4.1.5 Others
4.2 Global Smart Power Line Inspection System Sales Value by Application
4.2.1 Global Smart Power Line Inspection System Sales Value by Application (2020 VS 2024 VS 2031)
4.2.2 Global Smart Power Line Inspection System Sales Value, by Application (2020-2031)
4.2.3 Global Smart Power Line Inspection System Sales Value, by Application (%) (2020-2031)
5 Segmentation by Region
5.1 Global Smart Power Line Inspection System Sales Value by Region
5.1.1 Global Smart Power Line Inspection System Sales Value by Region: 2020 VS 2024 VS 2031
5.1.2 Global Smart Power Line Inspection System Sales Value by Region (2020-2025)
5.1.3 Global Smart Power Line Inspection System Sales Value by Region (2026-2031)
5.1.4 Global Smart Power Line Inspection System Sales Value by Region (%), (2020-2031)
5.2 North America
5.2.1 North America Smart Power Line Inspection System Sales Value, 2020-2031
5.2.2 North America Smart Power Line Inspection System Sales Value by Country (%), 2024 VS 2031
5.3 Europe
5.3.1 Europe Smart Power Line Inspection System Sales Value, 2020-2031
5.3.2 Europe Smart Power Line Inspection System Sales Value by Country (%), 2024 VS 2031
5.4 Asia Pacific
5.4.1 Asia Pacific Smart Power Line Inspection System Sales Value, 2020-2031
5.4.2 Asia Pacific Smart Power Line Inspection System Sales Value by Region (%), 2024 VS 2031
5.5 South America
5.5.1 South America Smart Power Line Inspection System Sales Value, 2020-2031
5.5.2 South America Smart Power Line Inspection System Sales Value by Country (%), 2024 VS 2031
5.6 Middle East & Africa
5.6.1 Middle East & Africa Smart Power Line Inspection System Sales Value, 2020-2031
5.6.2 Middle East & Africa Smart Power Line Inspection System Sales Value by Country (%), 2024 VS 2031
6 Segmentation by Key Countries/Regions
6.1 Key Countries/Regions Smart Power Line Inspection System Sales Value Growth Trends, 2020 VS 2024 VS 2031
6.2 Key Countries/Regions Smart Power Line Inspection System Sales Value, 2020-2031
6.3 United States
6.3.1 United States Smart Power Line Inspection System Sales Value, 2020-2031
6.3.2 United States Smart Power Line Inspection System Sales Value by Type (%), 2024 VS 2031
6.3.3 United States Smart Power Line Inspection System Sales Value by Application, 2024 VS 2031
6.4 Europe
6.4.1 Europe Smart Power Line Inspection System Sales Value, 2020-2031
6.4.2 Europe Smart Power Line Inspection System Sales Value by Type (%), 2024 VS 2031
6.4.3 Europe Smart Power Line Inspection System Sales Value by Application, 2024 VS 2031
6.5 China
6.5.1 China Smart Power Line Inspection System Sales Value, 2020-2031
6.5.2 China Smart Power Line Inspection System Sales Value by Type (%), 2024 VS 2031
6.5.3 China Smart Power Line Inspection System Sales Value by Application, 2024 VS 2031
6.6 Japan
6.6.1 Japan Smart Power Line Inspection System Sales Value, 2020-2031
6.6.2 Japan Smart Power Line Inspection System Sales Value by Type (%), 2024 VS 2031
6.6.3 Japan Smart Power Line Inspection System Sales Value by Application, 2024 VS 2031
6.7 South Korea
6.7.1 South Korea Smart Power Line Inspection System Sales Value, 2020-2031
6.7.2 South Korea Smart Power Line Inspection System Sales Value by Type (%), 2024 VS 2031
6.7.3 South Korea Smart Power Line Inspection System Sales Value by Application, 2024 VS 2031
6.8 Southeast Asia
6.8.1 Southeast Asia Smart Power Line Inspection System Sales Value, 2020-2031
6.8.2 Southeast Asia Smart Power Line Inspection System Sales Value by Type (%), 2024 VS 2031
6.8.3 Southeast Asia Smart Power Line Inspection System Sales Value by Application, 2024 VS 2031
6.9 India
6.9.1 India Smart Power Line Inspection System Sales Value, 2020-2031
6.9.2 India Smart Power Line Inspection System Sales Value by Type (%), 2024 VS 2031
6.9.3 India Smart Power Line Inspection System Sales Value by Application, 2024 VS 2031
7 Company Profiles
7.1 Siemens Energy
7.1.1 Siemens Energy Profile
7.1.2 Siemens Energy Main Business
7.1.3 Siemens Energy Smart Power Line Inspection System Products, Services and Solutions
7.1.4 Siemens Energy Smart Power Line Inspection System Revenue (US$ Million) & (2020-2025)
7.1.5 Siemens Energy Recent Developments
7.2 Hitachi Energy
7.2.1 Hitachi Energy Profile
7.2.2 Hitachi Energy Main Business
7.2.3 Hitachi Energy Smart Power Line Inspection System Products, Services and Solutions
7.2.4 Hitachi Energy Smart Power Line Inspection System Revenue (US$ Million) & (2020-2025)
7.2.5 Hitachi Energy Recent Developments
7.3 Kinectrics
7.3.1 Kinectrics Profile
7.3.2 Kinectrics Main Business
7.3.3 Kinectrics Smart Power Line Inspection System Products, Services and Solutions
7.3.4 Kinectrics Smart Power Line Inspection System Revenue (US$ Million) & (2020-2025)
7.3.5 Kinectrics Recent Developments
7.4 SAM
7.4.1 SAM Profile
7.4.2 SAM Main Business
7.4.3 SAM Smart Power Line Inspection System Products, Services and Solutions
7.4.4 SAM Smart Power Line Inspection System Revenue (US$ Million) & (2020-2025)
7.4.5 SAM Recent Developments
7.5 Pergam USA
7.5.1 Pergam USA Profile
7.5.2 Pergam USA Main Business
7.5.3 Pergam USA Smart Power Line Inspection System Products, Services and Solutions
7.5.4 Pergam USA Smart Power Line Inspection System Revenue (US$ Million) & (2020-2025)
7.5.5 Pergam USA Recent Developments
7.6 OFIL Europe
7.6.1 OFIL Europe Profile
7.6.2 OFIL Europe Main Business
7.6.3 OFIL Europe Smart Power Line Inspection System Products, Services and Solutions
7.6.4 OFIL Europe Smart Power Line Inspection System Revenue (US$ Million) & (2020-2025)
7.6.5 OFIL Europe Recent Developments
7.7 CBH Aviation
7.7.1 CBH Aviation Profile
7.7.2 CBH Aviation Main Business
7.7.3 CBH Aviation Smart Power Line Inspection System Products, Services and Solutions
7.7.4 CBH Aviation Smart Power Line Inspection System Revenue (US$ Million) & (2020-2025)
7.7.5 CBH Aviation Recent Developments
7.8 Zhiyang Innovation Technology
7.8.1 Zhiyang Innovation Technology Profile
7.8.2 Zhiyang Innovation Technology Main Business
7.8.3 Zhiyang Innovation Technology Smart Power Line Inspection System Products, Services and Solutions
7.8.4 Zhiyang Innovation Technology Smart Power Line Inspection System Revenue (US$ Million) & (2020-2025)
7.8.5 Zhiyang Innovation Technology Recent Developments
7.9 Shandong Senter Electronic
7.9.1 Shandong Senter Electronic Profile
7.9.2 Shandong Senter Electronic Main Business
7.9.3 Shandong Senter Electronic Smart Power Line Inspection System Products, Services and Solutions
7.9.4 Shandong Senter Electronic Smart Power Line Inspection System Revenue (US$ Million) & (2020-2025)
7.9.5 Shandong Senter Electronic Recent Developments
7.10 Huawei
7.10.1 Huawei Profile
7.10.2 Huawei Main Business
7.10.3 Huawei Smart Power Line Inspection System Products, Services and Solutions
7.10.4 Huawei Smart Power Line Inspection System Revenue (US$ Million) & (2020-2025)
7.10.5 Huawei Recent Developments
7.11 eSmart Systems
7.11.1 eSmart Systems Profile
7.11.2 eSmart Systems Main Business
7.11.3 eSmart Systems Smart Power Line Inspection System Products, Services and Solutions
7.11.4 eSmart Systems Smart Power Line Inspection System Revenue (US$ Million) & (2020-2025)
7.11.5 eSmart Systems Recent Developments
7.12 DJI
7.12.1 DJI Profile
7.12.2 DJI Main Business
7.12.3 DJI Smart Power Line Inspection System Products, Services and Solutions
7.12.4 DJI Smart Power Line Inspection System Revenue (US$ Million) & (2020-2025)
7.12.5 DJI Recent Developments
7.13 Applus+
7.13.1 Applus+ Profile
7.13.2 Applus+ Main Business
7.13.3 Applus+ Smart Power Line Inspection System Products, Services and Solutions
7.13.4 Applus+ Smart Power Line Inspection System Revenue (US$ Million) & (2020-2025)
7.13.5 Applus+ Recent Developments
7.14 Hepta Group Airborne
7.14.1 Hepta Group Airborne Profile
7.14.2 Hepta Group Airborne Main Business
7.14.3 Hepta Group Airborne Smart Power Line Inspection System Products, Services and Solutions
7.14.4 Hepta Group Airborne Smart Power Line Inspection System Revenue (US$ Million) & (2020-2025)
7.14.5 Hepta Group Airborne Recent Developments
7.15 Delair
7.15.1 Delair Profile
7.15.2 Delair Main Business
7.15.3 Delair Smart Power Line Inspection System Products, Services and Solutions
7.15.4 Delair Smart Power Line Inspection System Revenue (US$ Million) & (2020-2025)
7.15.5 Delair Recent Developments
7.16 Skydio
7.16.1 Skydio Profile
7.16.2 Skydio Main Business
7.16.3 Skydio Smart Power Line Inspection System Products, Services and Solutions
7.16.4 Skydio Smart Power Line Inspection System Revenue (US$ Million) & (2020-2025)
7.16.5 Skydio Recent Developments
7.17 Sharper Shape
7.17.1 Sharper Shape Profile
7.17.2 Sharper Shape Main Business
7.17.3 Sharper Shape Smart Power Line Inspection System Products, Services and Solutions
7.17.4 Sharper Shape Smart Power Line Inspection System Revenue (US$ Million) & (2020-2025)
7.17.5 Sharper Shape Recent Developments
7.18 Scopito
7.18.1 Scopito Profile
7.18.2 Scopito Main Business
7.18.3 Scopito Smart Power Line Inspection System Products, Services and Solutions
7.18.4 Scopito Smart Power Line Inspection System Revenue (US$ Million) & (2020-2025)
7.18.5 Scopito Recent Developments
7.19 FlyPix AI
7.19.1 FlyPix AI Profile
7.19.2 FlyPix AI Main Business
7.19.3 FlyPix AI Smart Power Line Inspection System Products, Services and Solutions
7.19.4 FlyPix AI Smart Power Line Inspection System Revenue (US$ Million) & (2020-2025)
7.19.5 FlyPix AI Recent Developments
7.20 Buzz Solutions
7.20.1 Buzz Solutions Profile
7.20.2 Buzz Solutions Main Business
7.20.3 Buzz Solutions Smart Power Line Inspection System Products, Services and Solutions
7.20.4 Buzz Solutions Smart Power Line Inspection System Revenue (US$ Million) & (2020-2025)
7.20.5 Buzz Solutions Recent Developments
7.21 Shenzhen Telikang Technology
7.21.1 Shenzhen Telikang Technology Profile
7.21.2 Shenzhen Telikang Technology Main Business
7.21.3 Shenzhen Telikang Technology Smart Power Line Inspection System Products, Services and Solutions
7.21.4 Shenzhen Telikang Technology Smart Power Line Inspection System Revenue (US$ Million) & (2020-2025)
7.21.5 Shenzhen Telikang Technology Recent Developments
7.22 Shenzhen Santachi Video Technology
7.22.1 Shenzhen Santachi Video Technology Profile
7.22.2 Shenzhen Santachi Video Technology Main Business
7.22.3 Shenzhen Santachi Video Technology Smart Power Line Inspection System Products, Services and Solutions
7.22.4 Shenzhen Santachi Video Technology Smart Power Line Inspection System Revenue (US$ Million) & (2020-2025)
7.22.5 Shenzhen Santachi Video Technology Recent Developments
7.23 Chengdu Jouav Automation Tech
7.23.1 Chengdu Jouav Automation Tech Profile
7.23.2 Chengdu Jouav Automation Tech Main Business
7.23.3 Chengdu Jouav Automation Tech Smart Power Line Inspection System Products, Services and Solutions
7.23.4 Chengdu Jouav Automation Tech Smart Power Line Inspection System Revenue (US$ Million) & (2020-2025)
7.23.5 Chengdu Jouav Automation Tech Recent Developments
8 Industry Chain Analysis
8.1 Smart Power Line Inspection System Industrial Chain
8.2 Smart Power Line Inspection System Upstream Analysis
8.2.1 Key Raw Materials
8.2.2 Raw Materials Key Suppliers
8.2.3 Manufacturing Cost Structure
8.3 Midstream Analysis
8.4 Downstream Analysis (Customers Analysis)
8.5 Sales Model and Sales Channels
8.5.1 Smart Power Line Inspection System Sales Model
8.5.2 Sales Channel
8.5.3 Smart Power Line Inspection System Distributors
9 Research Findings and Conclusion
10 Appendix
10.1 Research Methodology
10.1.1 Methodology/Research Approach
10.1.1.1 Research Programs/Design
10.1.1.2 Market Size Estimation
10.1.1.3 Market Breakdown and Data Triangulation
10.1.2 Data Source
10.1.2.1 Secondary Sources
10.1.2.2 Primary Sources
10.2 Author Details
10.3 Disclaimer
QY Research PVT. LTD.
315 Work Avenue,
Raheja Woods,
6th Floor, Kalyani Nagar,
Yervada, Pune - 411060,
Maharashtra, India
India: (O) +91 866 998 6909
USA: (O) +1 626 295 2442
Email: hitesh@qyresearch.com
Web: www.qyresearch.in
About QY Research
QY Research is a global provider of market research and consulting services, offering syndicated and customized reports across energy, electronics, industrial automation, materials, and emerging technologies. The firm supports strategic decision-making for organizations worldwide through data-driven analysis and industry-focused expertise.
This release was published on openPR.
Permanent link to this press release:
Copy
Please set a link in the press area of your homepage to this press release on openPR. openPR disclaims liability for any content contained in this release.
You can edit or delete your press release Global Smart Power Line Inspection System Market to Reach US$ 350 Million by 2031 as Utilities Accelerate Digital Grid Monitoring here
News-ID: 4331165 • Views: …
More Releases from QY Research, Inc.
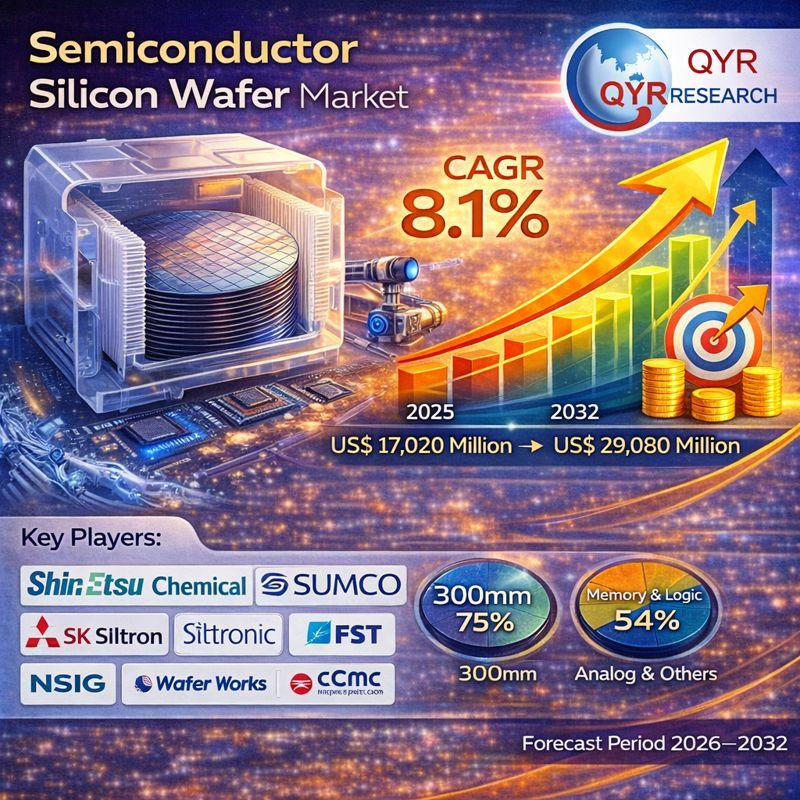
Global Semiconductor Silicon Wafer Market to Reach US$ 29.08 Billion by 2032, Dr …
Market Summary -
The global Semiconductor Silicon Wafer market was valued at US$ 17,020 million in 2025 and is projected to reach US$ 29,080 million by 2032, growing at a CAGR of 8.1% during the forecast period 2026-2032.
According to QY Research, the newly released report titled "Global Semiconductor Silicon Wafer Market Insights - Industry Share, Sales Projections, and Demand Outlook 2026-2032" delivers a comprehensive, data-driven assessment of the global silicon wafer…

Global Water Desalination Equipment Market to Reach US$ 10.93 Billion by 2032, D …
Market Summary -
The global Water Desalination Equipment market was valued at US$ 7,215 million in 2025 and is projected to reach US$ 10,930 million by 2032, growing at a CAGR of 6.2% during the forecast period 2026-2032.
According to QY Research, the newly published report titled "Global Water Desalination Equipment Market Insights - Industry Share, Sales Projections, and Demand Outlook 2026-2032" provides a comprehensive, data-driven evaluation of the global desalination equipment…

Global Syndiotactic Polystyrene Market to Reach US$ 162 Million by 2032, Driven …
Market Summary -
The global Syndiotactic Polystyrene (SPS) market was valued at US$ 111 million in 2025 and is projected to reach US$ 162 million by 2032, expanding at a CAGR of 5.6% during the forecast period 2026-2032.
According to QY Research, the newly released report titled "Global Syndiotactic Polystyrene Market Insights - Industry Share, Sales Projections, and Demand Outlook 2026-2032" provides a comprehensive, data-driven assessment of the global SPS market. The…
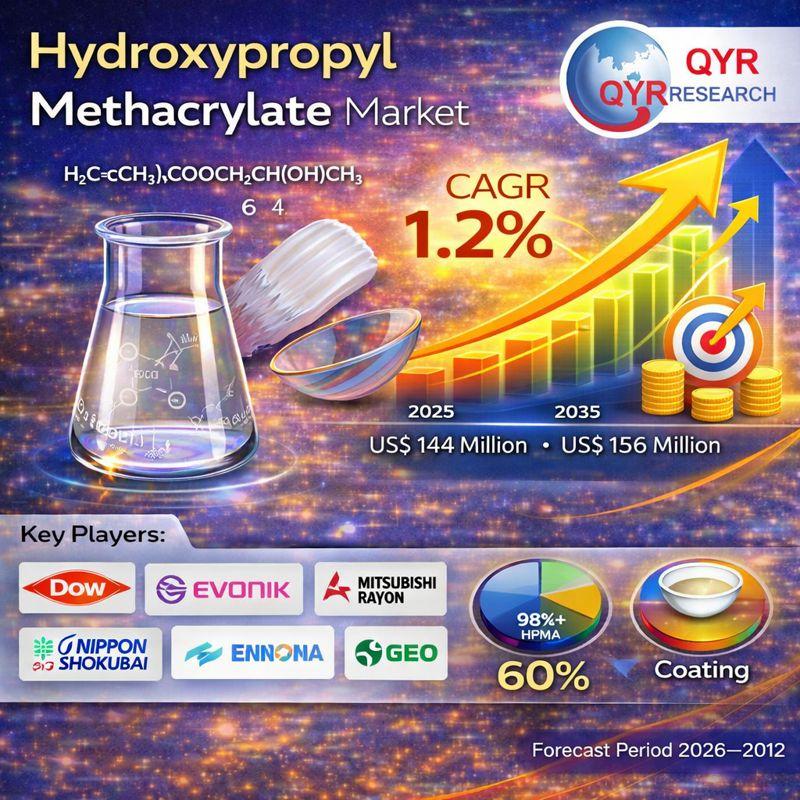
Global Hydroxypropyl Methacrylate Market to Reach US$ 156 Million by 2032, Suppo …
Market Summary -
The global Hydroxypropyl Methacrylate (HPMA) market was valued at US$ 144 million in 2025 and is projected to reach US$ 156 million by 2032, expanding at a CAGR of 1.2% during the forecast period 2026-2032.
According to QY Research, the newly released report titled "Global Hydroxypropyl Methacrylate Market Insights - Industry Share, Sales Projections, and Demand Outlook 2026-2032" provides a comprehensive, data-driven evaluation of the global HPMA market.…
More Releases for Smart
Smart Cities Market is Expected to Witness CAGR of 17.3% by 2027 with Applicatio …
A smart city is an urban unit or area that uses various types of electronic Internet of Things (IoT) devices to collect data and then use the insights to manage resources, assets, and services effectively. Green building is a growing trend in the global smart cities market. Constructing eco-friendly infrastructure facilities can provide a sustainable environment in the cities. Moreover, governments are focused on constructing energy-efficient buildings, in order…
Internet of Things (IoT) Devices Market By Type (Computing Devices, Smart Media, …
On a global scale, the Internet of Things (IoT) Devices market is currently showing significant development. The innovative methods and market study have helped many of the major players Samsung Electronics, Apple, Lenovo, ASUS, Acer, Huawei, Coolpad, LG Electronics, Google, Panasonic, Microsoft, Brother Industries, Honeywell, Fitbit, Lenovo to carve a name for themselves in the competitive global market. The Internet of Things (IoT) Devices market is experiencing a massive growth…
Global Smart Cities Market by Component (Hardware, Software) by Application (Sma …
Global Smart Cities Market: Overview
The global smart cities market is expected to reach a mark of over USD 3000 billion by 2024, at a CAGR over 21% during the forecast period. Significant growth in next-generation technologies such as artificial intelligence AI, personalized healthcare, sustainable energy generation and robotics are driving the smart cities’ future. Moreover, the increase in residential preference towards the adoption of advanced information and communication technologies ICT…
Global Smart Infrastructure - A Smart Approach To Smart Cities In 2016
Slowly but surely we are beginning to see a transformation take place in many parts of the world, as governments and councils realise they need to take a holistic approach to future city-wide development. In Australia, for example, we see that Adelaide, Canberra, Newcastle, Lake Macquarie, Sydney, Ipswich and Sunshine Coast have all been identified as being among the leading smart cities. The Netherlands also has great examples of emerging…
Global Smart Infrastructure - A Smart Approach To Smart Cities In 2016
The global smart city transformation is underway
Slowly but surely we are beginning to see a transformation take place in many parts of the world, as governments and councils realise they need to take a holistic approach to future city-wide development. In Australia, for example, we see that Adelaide, Canberra, Newcastle, Lake Macquarie, Sydney, Ipswich and Sunshine Coast have all been identified as being among the leading smart cities. The Netherlands…
Smart Kitchen Appliances Market ( Smart Refrigerators, Smart Dishwashers, Smart …
The rising demand for smart kitchen appliances is linked to their premium design that offers better effectiveness and more comfort than their traditional counterparts. With energy efficiency at its core, the global market for smart kitchen appliances is expected to surge at a robust pace in the near future.In a report titled “Smart Kitchen Appliances Market - Global Industry Analysis, Size, Share, Growth, Trends and Forecast 2014 - 2022,” Transparency…
