Press release
Track Copper Plate Price Index Historical and Forecast

The global Copper Plate market experienced significant volatility from Q4 2024 through Q3 2025, driven by evolving supply-chain dynamics, tariff policies, macroeconomic uncertainty, and shifting industrial demand patterns. Prices remained broadly elevated across North America, APAC, and Europe, albeit with region-specific pressures such as mine disruptions, energy-cost volatility, currency fluctuations, and trade-policy shifts.
In North America, Copper Plate prices surged sharply through mid-2025, supported by tightening inventories, new tariff structures, and resilient industrial demand led by EVs, data centers, and power infrastructure. APAC saw more mixed movements, affected by concentrate shortages, yen depreciation, and shifting export economics, while Europe's market demonstrated firm upward momentum supported by strengthening demand from electronics, electrical equipment, and renewable installations.
Across all regions, the Copper Plate market remained sensitive to treatment charges (TC/RC), freight costs, currency shifts, and trade-flow distortions. As the global energy transition accelerates and data-center expansion intensifies, structural demand for copper plate continues to expand-creating a backdrop of persistent supply tightness and price firmness heading into 2026.
◼ Get Instant Access to Live Copper Plate Prices Today: https://www.chemanalyst.com/ChemAnalyst/PricingForm?Product=Copper%20Plate
Introduction
Copper Plate is an essential semi-finished industrial material used across electrical systems, EVs, data centers, electronics, construction, renewable energy, and heavy manufacturing. Its price trends closely track global copper cathode supply, mine production stability, treatment charges, freight markets, macroeconomic sentiment, and end-use sector performance.
Between 2024 and 2025, the Copper Plate market navigated turbulent supply-chain disruptions, fluctuating energy prices, large-scale policy interventions, and unprecedented growth in electrification-led demand. This period also marked new trade barriers, evolving currency dynamics, and concentrated procurement behavior that shaped regional pricing.
This comprehensive PR-style report examines these trends across North America, APAC, and Europe, providing insights into production costs, buyer strategies, supply-chain constraints, and near-term and long-term forecasts. It is designed for procurement teams, analysts, manufacturers, and market participants requiring deep, factual, and actionable intelligence.
Global Copper Plate Price Overview
Q4 2024 - Q3 2025 Trend Summary
Global Copper Plate pricing demonstrated an upward trajectory through 2025, underpinned by:
Persistent concentrate shortages
Macroeconomic and tariff-driven market uncertainty
Tight smelter margins due to lower TC/RCs
Strong structural demand from EV, electronics, and renewable energy sectors
Lean global warehouse inventories (COMEX, LME)
Currency fluctuations affecting import/export economics
Increased freight and logistics bottlenecks
Demand-Side Drivers
EV production and charging infrastructure remained a key anchor.
Data-center growth surged copper plate requirements for power systems, busbars, and high-conductivity components.
Renewable energy installations (solar, wind, hydrogen) steadily expanded copper-intensive manufacturing.
Supply-Side Constraints
A major Peruvian mine outage in 2025 disrupted concentrate availability.
Global smelting margins shrank due to falling TC/RCs.
Tariffs in the U.S. and export changes in Asia shifted trade routes.
Freight volatility and port delays hindered timing and cost efficiencies.
These global pressures set the context for the regionally distinct price movements detailed below.
◼ Monitor Real-Time Copper Plate Price Swings and Stay Ahead of Competitors: https://www.chemanalyst.com/Pricing-data/copper-plate-1356
Regional Copper Plate Price Analysis
North America Market Analysis
Q3 2025 (Quarter Ending September 2025)
The North American market saw a 10.54% quarter-over-quarter increase in the Copper Plate Price Index, closing the quarter at an average of USD 17,321.67/MT CFR. Tightness in supply and tariff-driven cost escalations were the primary drivers.
Key factors influencing prices:
Lean inventories at distribution centers and mills.
Higher freight and trucking surcharges, including fuel-price pressures.
Heavy procurement activity from EV OEMs and data-center builders.
Tariffs increasing landed costs, creating upward momentum in plate premiums.
Concentrate shortages due to South American mine disruptions.
Accelerated export inquiries that tightened domestic availability.
Spot prices ended the quarter firm, with procurement urgency intensifying as buyers anticipated additional policy shifts.
Why Did Prices Change in September 2025?
A major Peruvian mine outage reduced cathode supply availability.
EV and data-center sector strength supported continuous procurement.
Tariff and freight surcharges lifted landed cost structures, ensuring price support.
Q2 2025 (Quarter Ending June 2025)
North America recorded a 2.0% quarter-on-quarter increase, with sentiment moving from early-quarter bearishness to late-quarter tightness.
Drivers included:
Early oversupply concerns fading as inventories normalized.
Rising energy and labor costs contributing to production-cost support.
Late-quarter demand revival across construction, automotive, and renewables.
Stronger buying activity as trade-policy uncertainty worsened.
By quarter's end, COMEX inventories stabilized, and optimism returned.
Why Did Prices Rise in July 2025?
The U.S. announced a 50% tariff on copper imports, effective August 1.
This triggered significant pre-tariff stockpiling, sending futures to record highs and tightening physical supply.
Q1 2025 (Quarter Ending March 2025)
The Copper Plate Price Index rose 4.7% q-o-q, landing at USD 16,870/MT DEL Alabama by March-end.
Primary contributors:
Market-wide speculative buying.
Section 232 investigation concerns.
Strong EV and data-center sector demand.
Elevated production costs due to energy inflation and tight labor supply.
Why Did Prices Increase in April 2025?
Expectations of new import tariffs and strategic stockpiling ahead of potential disruptions intensified buying activity.
Q4 2024 Review
North America saw a 4% q-o-q price increase, ending at USD 14,180/MT due to:
Strong domestic electrical and automotive demand.
Improved copper imports early in the quarter.
Declining mine output at Bingham Canyon.
Stable global copper demand influenced by China's economic recovery.
Slower late-quarter construction activity due to high mortgage rates.
APAC Market Analysis
Q3 2025 (Quarter Ending September 2025)
Japan-the region's focal market-recorded a 1.25% quarter-over-quarter decline, with an average price of USD 13,377.67/MT FOB Osaka.
Key market influences:
Export headwinds and yen depreciation impacting competitiveness.
Tight feedstock availability due to concentrate shortages.
Volatile spot pricing from low TC/RCs.
Resilient demand from electronics, renewable energy, and server industries.
Port delays and tariff influences shaping procurement strategies.
Why Did Prices Change in September 2025?
Abrupt concentrate shortfalls reduced smelter inputs.
Restocking from electronics and renewable sectors lifted near-term demand.
Yen weakness and new tariffs pressured export economics but moderated spot price swings due to Q2 inventory builds.
Q2 2025 (Quarter Ending June 2025)
APAC recorded a 4.4% q-o-q increase, driven by strengthening industrial fundamentals.
Key drivers:
Stable input costs; minimal cost-push pressures.
Rising automotive, electronics, and data-center demand in Indonesia.
Steady supply from China and Indonesia.
Lower global LME inventories tightening availability.
Rising strategic procurement in Southeast Asia.
Why Did Prices Change in July 2025 in Asia?
Early July saw higher concentrate benchmark prices in Indonesia due to tightened global supply.
Late July saw moderate relief from a stronger USD and lower by-product prices, marginally easing copper plate costs.
Q1 2025 (Quarter Ending March 2025)
APAC saw a 1.7% q-o-q increase, with the Japan spot price reaching USD 13,634/MT Ex Osaka.
Drivers included:
Strong electronics and construction demand.
Limited plate availability due to smelter constraints.
Slight upward pressure from refining-input costs.
Stable but tight market influenced by Japan's long-term supply commitments.
◼ Track Daily Copper Plate Price Updates and Strengthen Your Procurement Decisions: https://www.chemanalyst.com/ChemAnalyst/PricingForm?Product=Copper%20Plate
Why Did Prices Rise in April 2025?
Limited availability and strong manufacturing demand, particularly from advanced electronics and construction, supported price increases.
Q4 2024 Review
APAC prices grew 2.1% q-o-q, ending at USD 13,002/MT Ex Osaka.
Market influences:
Balanced supply supported by imports and domestic production.
Strong electronics and automotive demand.
Higher electricity costs increasing production-cost pressures.
Growing semiconductor and non-ferrous export activity.
Europe Market Analysis
Q3 2025 (Quarter Ending September 2025)
Germany's Copper Plate Price Index rose 3.96% q-o-q, averaging USD 15,948/MT.
Drivers included:
Strong renewable and electrical sector demand.
Tight and cathode feedstock availability.
Inventory drawdowns and barge logistics disruptions.
Robust mill utilization supporting firm spot prices.
Rising energy and costs boosting smelter expenses.
Operational restarts-especially at Aurubis-improved supply but did not fully offset tightness.
Why Did Prices Change in September 2025?
EV and electrical demand recovery supported robust procurement.
exports and feedstock diversions tightened supply.
Warehouse outflows and logistical constraints amplified price volatility.
Q2 2025 (Quarter Ending June 2025)
European prices saw a 1.1% q-o-q rise, with demand recovering late in the quarter.
Main influences:
Early-quarter declines due to weak industrial sentiment.
Mid-quarter support from falling inventories and tightening TC/RCs.
Logistics disruptions contributing to stabilization and late-quarter gains.
Strengthening demand from export-oriented electronics and NEV sectors.
Why Did Prices Increase in July 2025?
A surge in electronics and NEV export demand, alongside supply tightness and declining LME stocks, pushed spot prices upward.
Q1 2025 (Quarter Ending March 2025)
Europe's Copper Plate Price Index rose 0.9%, ending at USD 16,039/MT FOB Hamburg.
Key movements:
Strategic procurement by manufacturers.
Improved production conditions after a sluggish start.
Recovery in automotive and construction offtake.
Controlled production-cost trends with some risk from concentrate tightening.
Why Did Prices Increase in April 2025?
Export-market recovery and strategic restocking supported Q2 pricing momentum.
Q4 2024 Review
Europe saw a 6% q-o-q increase, ending at USD 14,881/MT FOB Hamburg.
Drivers included:
Strong restocking and manufacturing recovery.
Rising copper output globally, but localized transport challenges.
Improved electronics demand.
Subdued construction activity but resilient supply chains.
Policy shifts affecting energy costs and solar-installation incentives.
Production and Cost Structure Insights
Across all regions, several structural factors influenced Copper Plate production costs:
Energy Inflation: Elevated electricity costs, especially in Europe and Japan.
Labor Tightness: Increasing wages in North America and Europe.
Feedstock Shortages: Mine outages reduced cathode availability globally.
Lower TC/RCs: Tightening concentrate supply worsened smelter margins.
Freight and Logistics: Higher trucking and port delays inflated costs.
Currency Movements: Yen depreciation and USD strength altered competitiveness and landed-cost structures.
These factors reinforced firm price levels across Q4 2024-Q3 2025.
◼ Unlock Live Pricing Dashboards for Accurate and Timely Insights: https://www.chemanalyst.com/ChemAnalyst/PricingForm?Product=Copper%20Plate
Procurement Behavior and Supply-Chain Trends
Procurement teams globally shifted towards:
Pre-tariff stockpiling in the U.S.
Strategic restocking cycles in APAC electronics and renewable sectors.
Risk-based procurement in Europe due to logistics and feedstock concerns.
Long-term contract locking among Japanese smelters.
Inventory discipline, with many buyers maintaining lean stocks during volatility.
Supply-chain bottlenecks-especially in barge logistics and key ports-exacerbated regional tightness.
Outlook and Price Forecast
The Copper Plate Price Forecast for late 2025-2026 signals:
Persistent market tightness due to structural demand.
Continued volatility influenced by tariffs, mine supply risks, and inventory changes.
Positive demand momentum from EVs, electronics, and data-center infrastructure.
Rising smelter costs expected to support firm plate premiums.
Potential price relief only if concentrate supply improves materially.
Overall, the market is positioned for firm to moderately higher pricing over the next 12-18 months.
Frequently Asked Questions (FAQ)
Why did Copper Plate prices rise sharply in North America in 2025?
Due to tariffs, supply shortages from South America, strong EV/data-center demand, and higher freight costs.
What caused price volatility in APAC markets?
Concentrate shortages, yen depreciation, inventory swings, and fluctuating export economics.
Why were European Copper Plate prices firm in Q3 2025?
Strong renewable and electrical demand, feedstock shortages, and seasonal logistics disruptions.
Will Copper Plate prices remain elevated in 2026?
Yes-structural demand from electrification and limited new mine supply point toward firm pricing.
What sectors are driving global Copper Plate demand?
EVs, data centers, power systems, electronics, renewable energy, and construction.
◼ Stay Updated Each Day with Verified Copper Plate Price Movements: https://www.chemanalyst.com/ChemAnalyst/PricingForm?Product=Copper%20Plate
How ChemAnalyst Supports Buyers with Real-Time Intelligence
ChemAnalyst empowers procurement teams, manufacturers, investors, and supply-chain leaders with:
✔ Real-Time Price Tracking
Accurate, daily, weekly, and monthly Copper Plate price assessments across global markets.
✔ Detailed Pricing Drivers
Analyst-backed explanations that reveal why prices rise or fall-not just numbers.
✔ Forecasting Models
Advanced econometric and supply-chain modeling offering 6-12 month and long-term outlooks.
✔ Supply-Chain Disruption Monitoring
Tracking of plant shutdowns, mine outages, tariff changes, inventory levels, and logistic bottlenecks.
✔ Global Ground Intelligence
Teams across major trading hubs-Houston, Rotterdam, Shanghai, Busan, Jebel Ali, Hamburg-providing firsthand market updates.
✔ Procurement Optimization
Actionable insights that help buyers time their purchases, reduce risk, and maximize savings.
With ChemAnalyst's deep industry expertise, clients gain a competitive advantage through unmatched visibility into price dynamics, market forces, and future trends.
Contact Us:
UNITED STATES
Call +1 3322586602
420 Lexington Avenue, Suite 300, New York, NY,
United States, 10170
Germany
Call +49-221-6505-8833
S-01, 2.floor, Subbelrather Straße,
15a Cologne, 50823, Germany
Website: https://www.chemanalyst.com
About Us:
Welcome to ChemAnalyst, a next-generation platform for chemical and petrochemical intelligence where innovation meets practical insight. Recognized as "Product Innovator of the Year 2023" and ranked among the "Top 100 Digital Procurement Solutions Companies," we lead the digital transformation of the global chemical sector. Our online platform helps companies handle price volatility with structured analysis, real-time pricing, and reliable news and deal updates from across the world. Tracking over 500 chemical prices in more than 40 countries becomes simple and efficient with us.
This release was published on openPR.
Permanent link to this press release:
Copy
Please set a link in the press area of your homepage to this press release on openPR. openPR disclaims liability for any content contained in this release.
You can edit or delete your press release Track Copper Plate Price Index Historical and Forecast here
News-ID: 4288404 • Views: …
More Releases from ChemAnalyst
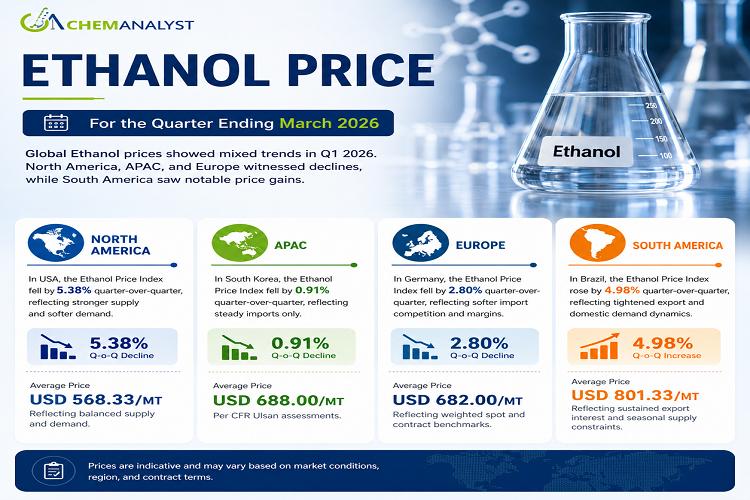
Ethanol Price Trend and Forecast: Global Market Analysis, Demand, News, Chart, A …
The Ethanol Price market witnessed mixed regional performance during the first quarter of 2026, as varying supply-demand dynamics, feedstock costs, energy prices, export activities, and government blending policies shaped pricing across major global markets. While North America, Asia-Pacific, and Europe experienced quarterly price corrections due to sufficient inventories and moderate industrial demand, South America registered positive momentum supported by robust export activity and seasonal supply constraints.
Globally, ethanol producers continued to…
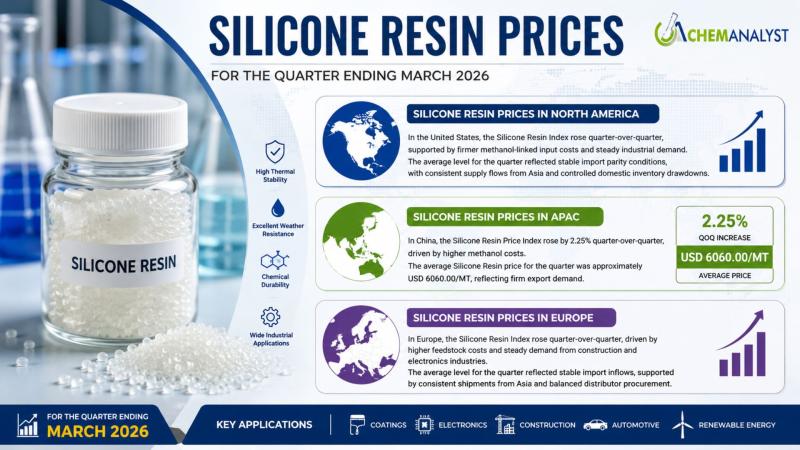
Silicone Resin Price 2026: Trend Chart, News, Index, Demand and Forecast | ChemA …
According to ChemAnalyst, The global Silicone Resin Prices experienced a notable upward trend during the first quarter of 2026, supported by increasing raw material costs, stable industrial consumption, and balanced supply conditions across major regions. Silicone resins, widely used in coatings, electronics, construction materials, automotive components, and high-temperature applications, remained in strong demand despite persistent macroeconomic uncertainties.
Get Real Time Online for Silicon Metal prices: https://www.chemanalyst.com/ChemAnalyst/PricingForm?Product=Silicone%20Resin
Throughout the quarter ending March 2026,…
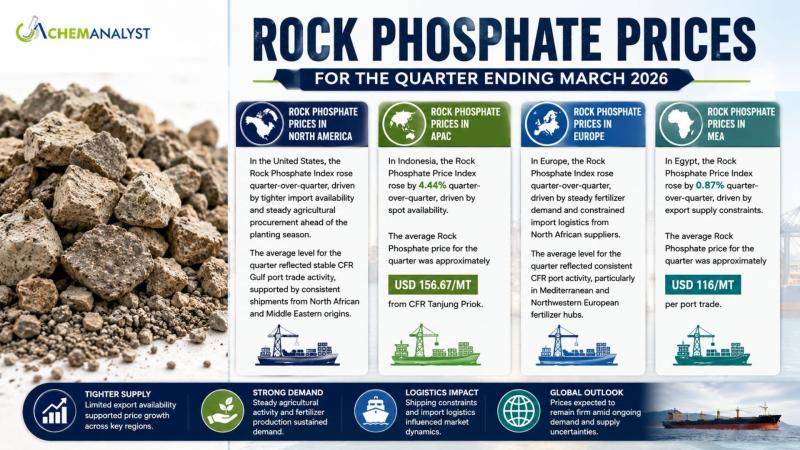
Rock Phosphate Price 2026: Trend Chart, News, Index, Demand and Forecast | ChemA …
According to ChemAnalyst, The global Rock Phosphate Prices witnessed a firm upward trend during the first quarter of 2026, supported by tightening supply conditions, stable fertilizer demand, and logistical constraints across major exporting and importing regions. Rock phosphate, a critical raw material for phosphate fertilizer production, remained a focal point for agricultural supply chains as countries prepared for upcoming planting seasons and sought to secure adequate inventories.
Get Real Time Online…
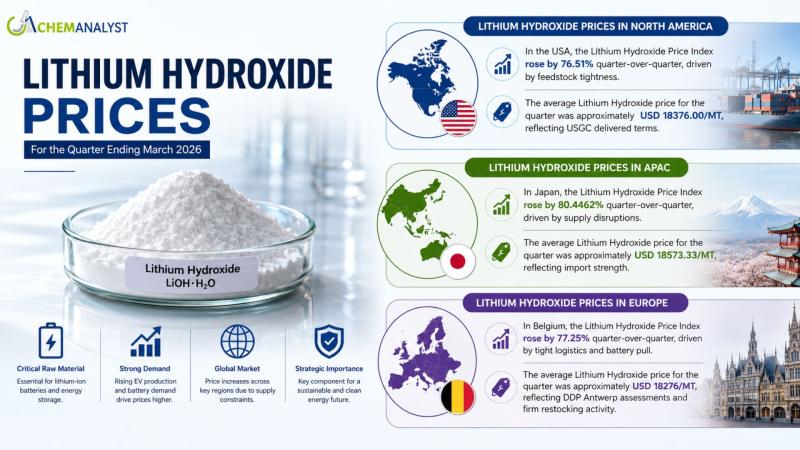
Lithium Hydroxide Price 2026: Trend Chart, News, Index, Demand and Forecast | Ch …
Lithium Hydroxide Prices Surge Globally in Q1 2026 Amid Supply Constraints and Rising Battery Demand
According to ChemAnalyst, The global Lithium Hydroxide Prices witnessed a substantial upward trajectory during the first quarter of 2026, supported by tightening supply conditions, strong demand from the electric vehicle (EV) battery sector, and persistent concerns regarding raw material availability. Across major regions including North America, Asia-Pacific, and Europe, prices recorded significant quarter-over-quarter gains exceeding 75%,…
More Releases for Copper
Copper Mining Market is Booming Worldwide | Major Giants Turquoise Hill, Copper …
HTF MI recently introduced Global Copper Mining Market study with 143+ pages in-depth overview, describing about the Product / Industry Scope and elaborates market outlook and status (2025-2033). The market Study is segmented by key regions which is accelerating the marketization. At present, the market is developing its presence.
Major companies in Copper Mining Market are:
Codelco, BHP, Freeport-McMoRan, Glencore, Rio Tinto, KGHM, First Quantum Minerals, Southern Copper, Antofagasta, Lundin Mining,…
Copper And Copper Alloy Welding Wire Market Size Analysis by Application, Type, …
According to Market Research Intellect, the global Copper And Copper Alloy Welding Wire market under the Internet, Communication and Technology category is expected to register notable growth from 2025 to 2032. Key drivers such as advancing technologies, changing consumer behavior, and evolving market dynamics are poised to shape the trajectory of this market throughout the forecast period.
With a robust Compound Annual Growth Rate (CAGR) of roughly 4.5%, the global market…
Copper Alloy And Copper Powder Market Size Analysis by Application, Type, and Re …
USA, New Jersey- According to Market Research Intellect, the global Copper Alloy And Copper Powder market in the Internet, Communication and Technology category is projected to witness significant growth from 2025 to 2032. Market dynamics, technological advancements, and evolving consumer demand are expected to drive expansion during this period.
The market for copper alloys and copper powder is steadily rising due to rising demand from a variety of industrial sectors, such…
Copper and Copper Alloy Foil Market Size, Scope 2031 by Key Companies- Amari Cop …
𝐔𝐒𝐀, 𝐍𝐞𝐰 𝐉𝐞𝐫𝐬𝐞𝐲: According to Verified Market Reports analysis, the global Copper and Copper Alloy Foil Market size was valued at USD 13.60 Billion in 2023 and is projected to reach USD 24.34 Billion by 2031, growing at a CAGR of 8.67% during the forecasted period 2024 to 2031.
The Copper and Copper Alloy Foil Market is poised for growth due to the increasing demand for high-performance materials across various industries,…
Global Copper and Copper-alloy Foils
LP INFORMATION recently released a research report on the Copper and Copper-alloy Foils
Contact US
LP INFORMATION
E-mail: info@lpinformationdata.com
Tel: 001-626-346-3938 (US) 00852-58080956 (HK) 0086 15521064060 (CN)
Add: 17890 Castleton St. Suite 162 City of Industry, CA 91748 US
Website: https://www.lpinformationdata.com
About Us:
LP INFORMATION (LPI) is a professional market report publisher based in America, providing high quality market research reports with competitive prices to help decision makers make informed decisions and take strategic actions…
Global Copper and Copper-alloy Foils (
LP INFORMATION offers a latest published report on Copper and Copper-alloy Foils (
Contact US
LP INFORMATION
E-mail: info@marketresearchreportstore.com
Tel: CN:0086-13660489451 HK: 00852-58081523 USA:001-626-3463946
Add: 17890 Castleton Street Suite 218 City of Industry CA 91748 United States
Website: https://www.marketresearchreportstore.com
About Us
LP INFORMATION (LPI) is a professional organization related to market research reports in all directions .To provide customers with a variety of market research reports,…
