Press release
Activated Carbon Price Index 2025: Stay Ahead & Control Prices Swings
Activated Carbon Price Index Analysis in North America: 2025 OverviewActivated Carbon Prices in the United States:
In the USA, Activated Carbon prices averaged around USD 2089.38/MT in Q3 2025, supported by strong demand from water treatment, food processing, and industrial filtration. The Activated Carbon Price Trend 2025 reflects mild fluctuations driven by raw material availability and environmental compliance costs. Insights from the Activated Carbon Historical Price Chart show that U.S. prices generally remain stable with periodic increases tied to energy and transportation expenses.
Get the Real-Time Prices Analysis: https://www.imarcgroup.com/activated-carbon-pricing-report/requestsample
Note: The analysis can be customized to meet the specific requirements of the customer.
Activated Carbon Price Index Analysis in APAC: 2025 Overview
Activated Carbon Prices in China:
China recorded Activated Carbon prices near USD 1667.73/MT in Q3 2025, driven by robust domestic production and competitive export activity. The Activated Carbon Price Trend 2025 highlights China's cost advantage due to large-scale manufacturing and consistent coal- and coconut-shell-based output. According to the Activated Carbon Historical Price Chart, China's pricing trends often follow feedstock supply, seasonal demand patterns, and shifts in global environmental standards.
Regional Analysis: The price analysis can be extended to provide detailed activated carbon price information for the following list of countries.
China, India, Indonesia, Pakistan, Bangladesh, Japan, Philippines, Vietnam, Thailand, South Korea, Malaysia, Nepal, Taiwan, Sri Lanka, Hongkong, Singapore, Australia, and New Zealand, among other Asian countries.
Activated Carbon Price Index Analysis in Europe: 2025 Overview
Activated Carbon Prices in Germany:
Germany saw Activated Carbon prices around USD 2585.98/MT in Q3 2025, making it one of the higher-priced markets due to strict regulatory norms and elevated energy costs. The Activated Carbon Price Trend 2025 in Germany shows firm pricing linked to imports and advanced filtration demand. The Activated Carbon Historical Price Chart indicates persistent price premiums in Europe, reflecting high-quality standards and sophisticated industrial applications.
Regional Analysis: The price analysis can be expanded to include detailed activated carbon price data for a wide range of European countries:
such as Germany, France, the United Kingdom, Italy, Spain, Russia, Turkey, the Netherlands, Poland, Sweden, Belgium, Austria, Ireland, Switzerland, Norway, Denmark, Romania, Finland, the Czech Republic, Portugal, and Greece, along with other European nations.
Activated Carbon Price Trends Analysis in APAC: 2025 Overview
Activated Carbon Prices in India:
India's Activated Carbon prices averaged USD 2026.83/MT in Q3 2025, supported by strong exports, growing water purification needs, and consistent pharmaceutical sector demand. The Activated Carbon Price Trend 2025 shows steady movement as manufacturers expand coconut-shell-based production capacity. The Activated Carbon Historical Price Chart reveals that India's pricing typically responds to raw coconut availability, energy costs, and seasonal demand from global filtration industries.
Activated Carbon Prices in South Korea:
South Korea reported Activated Carbon prices of approximately USD 2734.65/MT in Q3 2025, driven by high-grade industrial applications, advanced emissions control systems, and reliance on imported raw materials. The Activated Carbon Price Trend 2025 reflects firmness due to strong domestic consumption and compliance-driven demand. Patterns in the Activated Carbon Historical Price Chart show that South Korea consistently maintains premium pricing aligned with its advanced manufacturing ecosystem.
Regional Analysis: The price analysis can be extended to provide detailed activated carbon price information for the following list of countries.
China, India, Indonesia, Pakistan, Bangladesh, Japan, Philippines, Vietnam, Thailand, South Korea, Malaysia, Nepal, Taiwan, Sri Lanka, Hongkong, Singapore, Australia, and New Zealand, among other Asian countries.
Factors Affecting Activated Carbon Price Trend, Index, and Forecast
Activated Carbon Price Movements in 2025
• In the USA, prices rose to about 2089 USD/MT in Q3 2025, mainly due to more stringent pollution control rules that led to higher use of activated carbon.
• China experienced price increases around 1667 USD/MT in the same period, helped by recovering manufacturing activities and growing use in water cleaning and air filtering.
• Germany had prices near 2586 USD/MT, influenced by rising energy expenses, strict environmental rules, and shipping delays.
• South Korea's prices reached about 2735 USD/MT, driven by high demand from semiconductor and chemical industries amid limited supply of raw materials.
• Prices in India fell slightly due to lower demand from water treatment projects and easier access to raw materials.
Important Reasons Behind Price Changes
• Environmental Rules: Tighter regulations worldwide push industries to use more activated carbon for pollution control.
• Raw Material Costs: Prices for coal, coconut shells, and wood fluctuate, affecting how much it costs to make activated carbon.
• Energy and Transport Costs: Higher electricity, fuel, and shipping costs add to the total expenses.
• Supply Delays: Shipping congestion and import taxes sometimes cause delays and extra charges.
• Growing Needs: More industries need activated carbon for cleaning water, air, and gases, lifting demand in many areas.
Recent Updates and Events Affecting Prices
• New environmental policies in North America and Europe have increased the demand for activated carbon.
• Improvements in production methods have impacted how efficiently activated carbon is made.
• Some production facilities face temporary shutdowns or checks, reducing supply temporarily.
• Currency changes affect import prices and purchasing power in several countries.
• Developing countries show rising demand but face some export limits and transport obstacles.
Looking Ahead
• The overall use of activated carbon is expected to increase steadily, with growth linked to stricter environmental controls and industrial cleaning needs.
• Prices may continue to rise due to ongoing rules and higher costs for raw materials and energy.
• Companies should carefully manage raw materials and deliveries to handle price swings and supply challenges.
Speak To An Analyst: https://www.imarcgroup.com/request?type=report&id=23354&flag=C
Key Coverage:
• Market Analysis
• Market Breakup by Region
• Demand Supply Analysis by Type
• Demand Supply Analysis by Application
• Demand Supply Analysis of Raw Materials
• Price Analysis
o Spot Prices by Major Ports
o Price Breakup
o Price Trends by Region
o Factors influencing the Price Trends
• Market Drivers, Restraints, and Opportunities
• Competitive Landscape
• Recent Developments
• Global Event Analysis
How IMARC Pricing Database Can Help
The latest IMARC Group study, "Activated Carbon Prices, Trend, Chart, Demand, Market Analysis, News, Historical and Forecast Data 2025 Edition," presents a detailed analysis of Activated Carbon price trend, offering key insights into global Activated Carbon market dynamics. This report includes comprehensive price charts, which trace historical data and highlights major shifts in the market.
The analysis delves into the factors driving these trends, including raw material costs, production fluctuations, and geopolitical influences. Moreover, the report examines Activated Carbon demand, illustrating how consumer behaviour and industrial needs affect overall market dynamics. By exploring the intricate relationship between supply and demand, the prices report uncovers critical factors influencing current and future prices.
About Us:
IMARC Group is a global management consulting firm that provides a comprehensive suite of services to support market entry and expansion efforts. The company offers detailed market assessments, feasibility studies, regulatory approvals and licensing support, and pricing analysis, including spot pricing and regional price trends. Its expertise spans demand-supply analysis alongside regional insights covering Asia-Pacific, Europe, North America, Latin America, and the Middle East and Africa. IMARC also specializes in competitive landscape evaluations, profiling key market players, and conducting research into market drivers, restraints, and opportunities. IMARC's data-driven approach helps businesses navigate complex markets with precision and confidence.
Contact Us:
IMARC Group
134 N 4th St. Brooklyn, NY 11249, USA
Email: sales[@]imarcgroup.com
Tel No:(D) +91 120 433 0800
United States: +1-201971-6302
This release was published on openPR.
Permanent link to this press release:
Copy
Please set a link in the press area of your homepage to this press release on openPR. openPR disclaims liability for any content contained in this release.
You can edit or delete your press release Activated Carbon Price Index 2025: Stay Ahead & Control Prices Swings here
News-ID: 4285011 • Views: …
More Releases from IMARC Group

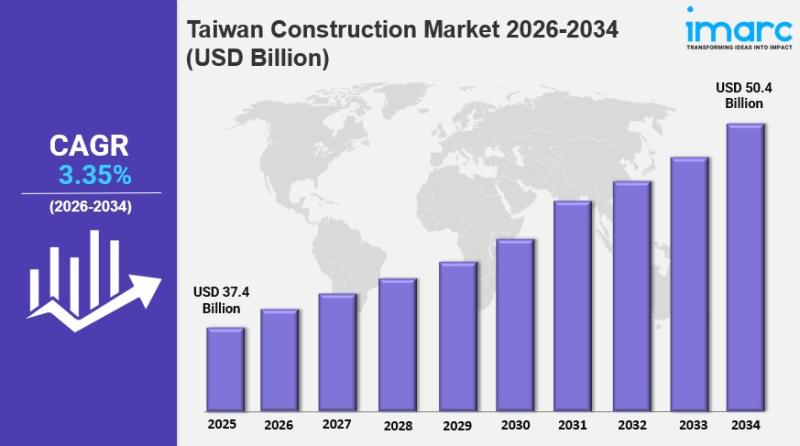
Taiwan Construction Market Size, Share, In-Depth Insights, Trends and Forecast 2 …
IMARC Group has recently released a new research study titled "Taiwan Construction Market Report by Sector (Residential, Commercial, Industrial, Infrastructure (Transportation), Energy and Utilities Construction), and Region 2026-2034", offers a detailed analysis of the market drivers, segmentation, growth opportunities, trends and competitive landscape to understand the current and future market scenarios.
Market Overview
The Taiwan construction market size reached USD 37.4 Billion in 2025 and is projected to grow to USD 50.4…

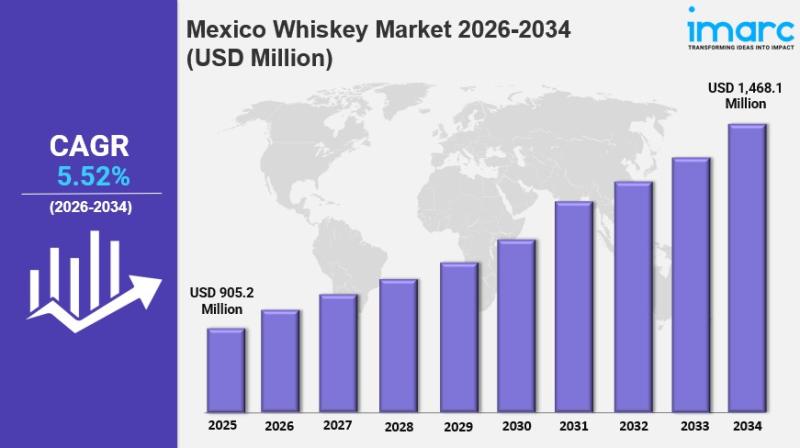
Mexico Whiskey Market Size to Hit USD 1,468.1 Million by 2034: Trends & Forecast
IMARC Group has recently released a new research study titled "Mexico Whiskey Market Size, Share, Trends and Forecast by Product Type, Quality, Distribution Channel, and Region, 2026-2034", offers a detailed analysis of the market drivers, segmentation, growth opportunities, trends and competitive landscape to understand the current and future market scenarios.
Market Overview
The Mexico whiskey market size reached USD 905.2 Million in 2025. It is projected to grow to USD 1,468.1 Million…

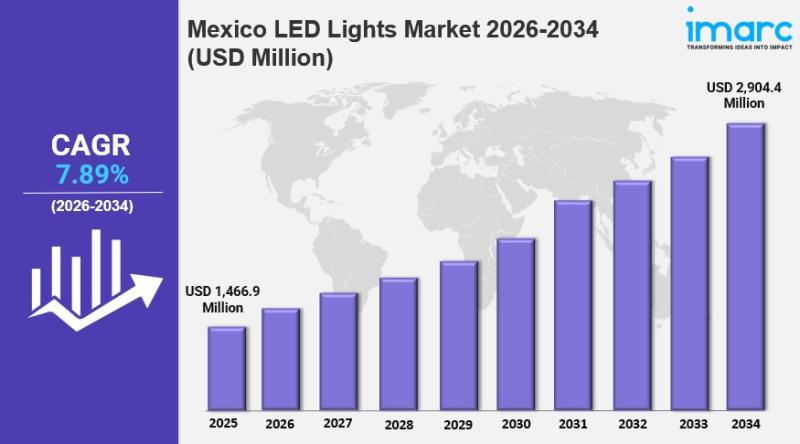
Mexico LED Lights Market 2026 : Industry Size to Reach USD 2,904.4 Million by 20 …
IMARC Group has recently released a new research study titled "Mexico LED Lights Market Size, Share, Trends and Forecast by Product Type, Application, Import and Domestic Manufacturing, and Region, 2026-2034", offers a detailed analysis of the market drivers, segmentation, growth opportunities, trends and competitive landscape to understand the current and future market scenarios.
Market Overview
The Mexico LED lights market was valued at USD 1,466.9 million in 2025 and is projected to…

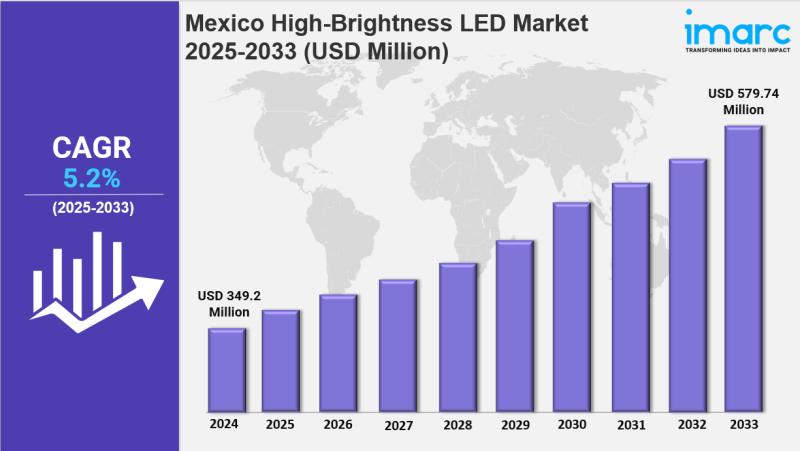
Mexico High-Brightness LED Market Size, Share, Latest Insights and Forecast 2025 …
IMARC Group has recently released a new research study titled "Mexico High-Brightness LED Market Size, Share, Trends and Forecast by Application, Distribution Channel, Indoor and Outdoor Application, End-Use Sector, and Region, 2025-2033" which offers a detailed analysis of the market drivers, segmentation, growth opportunities, trends, and competitive landscape to understand the current and future market scenarios.
Market Overview
The Mexico high-brightness LED market size reached USD 349.2 Million in 2024 and is…
More Releases for Price
Bitcoin Price, XRP Price, and Dogecoin Price Analysis: Turn Volatility into Prof …
London, UK, 4th October 2025, ZEX PR WIRE, The price movements in the cryptocurrency market can be crazy. Bitcoin price (BTC price), XRP price, and Dogecoin price vary from day to day, which can make it complicated for traders. Some investors win, but many more lose, amid unpredictable volatility. But there's a more intelligent way and that is Hashf . Instead of contemplating charts, Hashf provides an opportunity for investors…
HOTEL PRICE KILLER - BEAT YOUR BEST PRICE!
Noble Travels Launches 'Hotel Price Killer' to Beat OTA Hotel Prices
New Delhi, India & Atlanta, USA - August 11, 2025 - Noble Travels, a trusted name in the travel industry for over 30 years, has launched a bold new service called Hotel Price Killer, promising to beat the best hotel prices offered by major online travel agencies (OTAs) and websites.
With offices in India and USA, Noble Travels proudly serves an…
Toluene Price Chart, Index, Price Trend and Forecast
Toluene TDI Grade Price Trend Analysis - EX-Kandla (India)
The pricing trend for Toluene Diisocyanate (TDI) grade at EX-Kandla in India reveals notable fluctuations over the past year, influenced by global supply-demand dynamics and domestic economic conditions. From October to December 2023, the average price of TDI declined from ₹93/KG in October to ₹80/KG in December. This downward trend continued into 2024, with October witnessing a significant drop to ₹73/KG, a…
Glutaraldehyde Price Trend, Price Chart 2025 and Forecast
North America Glutaraldehyde Prices Movement Q1:
Glutaraldehyde Prices in USA:
Glutaraldehyde prices in the USA dropped to 1826 USD/MT in March 2025, driven by oversupply and weak demand across manufacturing and healthcare. The price trend remained negative as inventories rose and procurement slowed sharply in February. The price index captured this decline, while the price chart reflected persistent downward pressure throughout the quarter.
Get the Real-Time Prices Analysis: https://www.imarcgroup.com/glutaraldehyde-pricing-report/requestsample
Note: The analysis can…
Butane Price Trend 2025, Update Price Index and Real Time Price Analysis
MEA Butane Prices Movement Q1 2025:
Butane Prices in Saudi Arabia:
In the first quarter of 2025, butane prices in Saudi Arabia reached 655 USD/MT in March. The pricing remained stable due to consistent domestic production and strong export activities. The country's refining capacity and access to natural gas feedstock supported price control, even as global energy markets saw fluctuations driven by seasonal demand and geopolitical developments impacting the Middle East.
Get the…
Tungsten Price Trend, Chart, Price Fluctuations and Forecast
North America Tungsten Prices Movement:
Tungsten Prices in USA:
In the last quarter, tungsten prices in the United States reached 86,200 USD/MT in December. The price increase was influenced by high demand from the aerospace and electronics industries. Factors such as production costs and raw material availability, alongside market fluctuations, also contributed to the pricing trend.
Get the Real-Time Prices Analysis: https://www.imarcgroup.com/tungsten-pricing-report/requestsample
Note: The analysis can be tailored to align with the customer's specific…
