Press release
Growth Of The Graph Technology Market Driven By The Expansion Of Internet of Things (IoT) Driving Market Acceleration in the Graph Technology Industry, 2025
Use code ONLINE30 to get 30% off on global market reports and stay ahead of tariff changes, macro trends, and global economic shifts.How Large Will the Graph Technology Market Size By 2025?
In recent years, the market size of graph technology has seen rapid expansion. It is anticipated to increase from $5.26 billion in 2024 to $6.42 billion in 2025, representing a compound annual growth rate (CAGR) of 21.9%. The historical growth has been driven by factors such as the advance of social network analytics, the utilisation of semantic web and linked data, advancements in search engines and suggestion systems, enhanced fraud detection and security measures, as well as progress in biological and chemical studies.
How Big Is the Graph Technology Market Size Expected to Grow by 2029?
In the coming years, the market size for graph technology is set to witness tremendous growth, reaching $14.21 billion in 2029, exhibiting a compound annual growth rate (CAGR) of 22.0%. The projected growth during this period can be associated with the incorporation of AI and machine learning, the analysis of IoT and sensor data, the implementation of knowledge graphs in enterprise applications, the optimization of supply chain through graphs, and the application of graphs in healthcare and life sciences. The trend forecast for this period sees a merging of AI and graph technology, the proliferation of knowledge graphs, the broadening use of graphs in IoT and supply chain management, the proliferation of graphs in healthcare and life sciences, along with an emphasis on graph-based cybersecurity solutions.
View the full report here:
https://www.thebusinessresearchcompany.com/report/graph-technology-global-market-report
Which Key Market Drivers Powering Graph Technology Market Expansion and Growth?
The graph technology market's growth is predicted to be driven by the broadening scope of the Internet of Things (IoT). IoT encompasses a network of interconnected devices equipped with sensors, software, and other technologies, making data exchange and collection possible with other devices and systems via the internet. This concept has emerged due to technological advancements, business opportunities, and the consumer desire for smart devices. The application of graph technology is increasingly prevalent in IoT due to its capability to effectively model and analyze intricate relationships between diverse data points. This aids in improved decision making, enhanced data visibility, and optimization of the overall functionality and effectiveness of IoT applications. For instance, in July 2023, ITSG Global, an innovative software development company based in Poland, specified that in 2022, the worldwide spending on IoT exceeded $1 trillion. It is projected that the quantity of IoT devices will surpass 15 billion in 2023, marking a 55% increase from 2020. This prompts the conclusion that the IoT expansion is fostering the growth of the graph technology market.
Get your free sample here:
https://www.thebusinessresearchcompany.com/sample.aspx?id=14388&type=smp
Which Fast-Growing Trends Are Poised to Disrupt the Graph Technology Market?
Leading entities in the graph technology market are concentrating on the invention and integration of cutting-edge technologies, such as tracking visualization tools for space objects, to secure a competitive superiority. This technology is associated with specialized software programs developed to detect, track, and illustrate the position and activities of objects in space, including satellites and space debris circling Earth. As an example, Privateer, an American firm centered on space sustainability and exploration, introduced its distinct knowledge graph technology known as Wayfinder in March 2022. This technology is designed to map and monitor satellites and space debris in Earth's orbit. It offers an accessible, close to real-time digital directory of satellites and debris in Earth's orbit, crucial for tasks like deorbiting, refuelling, and tugging amongst other on-orbit services. Furthermore, it includes a real-time digital directory, data mapping system, on-orbit services, and fundamental data infrastructure for facilitating safer and more effective space operations.
What Are the Emerging Segments in the Graph Technology Market?
The graph technology market covered in this report is segmented -
1) By Component: Software, Services
2) By Graph Type: Property Graph, Resource Description Framework (RDF), Hypergraph
3) By Database Type: Relational (SQL), Non-Relational (No SQL)
4) By Application: Fraud Detection, Data Management And Analysis, Customer Analysis, Identity And Access Management, Compliance And Risk, Other Applications
4) By Industry: Banking Financial Services And Insurance (BFSI), Retail And E-Commerce, Information Technology (IT) And Telecommunications, Healthcare And Life Science, Government And Public Sector, Media And Entertainment, Supply Chain And Logistics, Other Industries
Subsegments:
1) By Software: Graph Database Software, Graph Analytics Software, Graph Visualization Software, Graph Query Language Software, Other Graph-Related Software
2) By Services: Professional Services, Managed Services
Tailor your insights and customize the full report here:
https://www.thebusinessresearchcompany.com/customise?id=14388&type=smp
Who Are the Global Leaders in the Graph Technology Market?
Major companies operating in the graph technology market are Microsoft Corporation, Amazon Web Services Inc., International Business Machines Corporation, Oracle Corporation, Teradata Corporation, Progress Software Corporation, DataStax Inc., Neo4j Inc., TigerGraph Inc., Bitnine Global Inc., Tom Sawyer Software, Cambridge Semantics Inc., Sparsity Technologies, Stardog Union, ArangoDB Inc., OrientDB Ltd., Franz Inc., Ontotext Corp., Cray Inc., Grakn Labs Ltd., GraphAware Ltd., Blazegraph Inc., Dataiku, Linkurious SAS, GraphGrid Inc.
Which are the Top Profitable Regional Markets for the Graph Technology Industry?
North America was the largest region in the graph technology market in 2024. Asia-Pacific is expected to be the fastest-growing region in the forecast period. The regions covered in the graph technology market report are Asia-Pacific, Western Europe, Eastern Europe, North America, South America, Middle East, Africa.
Purchase the full report today:
https://www.thebusinessresearchcompany.com/purchaseoptions.aspx?id=14388
This Report Supports:
1.Business Leaders & Investors - To identify growth opportunities, assess risks, and guide strategic decisions.
2.Manufacturers & Suppliers - To understand market trends, customer demand, and competitive positioning.
3.Policy Makers & Regulators - To track industry developments and align regulatory frameworks.
4.Consultants & Analysts - To support market entry, expansion strategies, and client advisory work.
Connect with us on:
LinkedIn: https://in.linkedin.com/company/the-business-research-company,
Twitter: https://twitter.com/tbrc_info,
YouTube: https://www.youtube.com/channel/UC24_fI0rV8cR5DxlCpgmyFQ.
Contact Us
Europe - +44 7882 955267,
Asia: +91 88972 63534,
Americas - +1 310-496-7795 or
Email: info@tbrc.info
Learn More About The Business Research Company
With over 15,000+ reports from 27 industries covering 60+ geographies, The Business Research Company has built a reputation for offering comprehensive, data-rich research and insights. Our flagship product, the Global Market Model delivers comprehensive and updated forecasts to support informed decision-making.
This release was published on openPR.
Permanent link to this press release:
Copy
Please set a link in the press area of your homepage to this press release on openPR. openPR disclaims liability for any content contained in this release.
You can edit or delete your press release Growth Of The Graph Technology Market Driven By The Expansion Of Internet of Things (IoT) Driving Market Acceleration in the Graph Technology Industry, 2025 here
News-ID: 4126673 • Views: …
More Releases from The Business Research Company

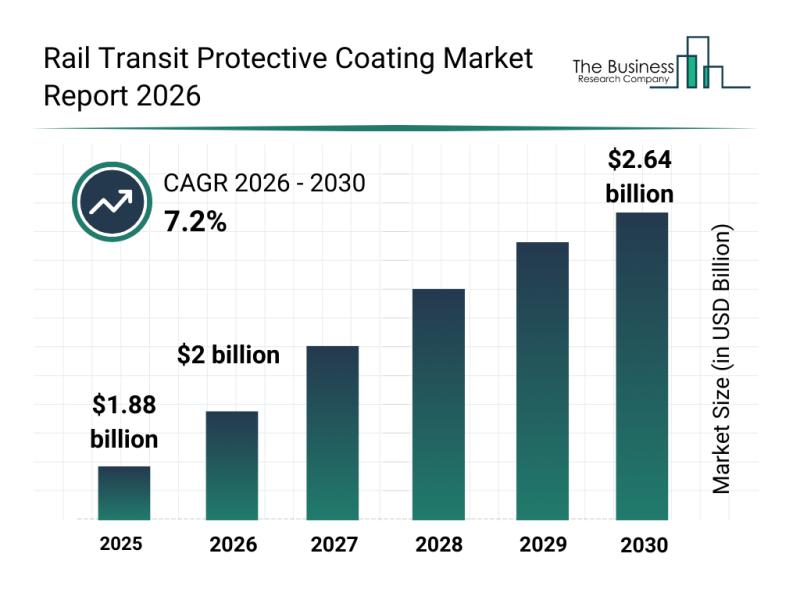
Rail Transit Protective Coating Market Overview: Major Segments, Strategic Devel …
The rail transit protective coating sector is positioned for significant expansion in the coming years, driven by technological advancements and increasing infrastructure investments. This market is evolving rapidly as stakeholders prioritize durability, sustainability, and efficiency in rail transit systems. Let's explore the market's valuation projections, leading companies, emerging trends, and detailed segment analysis to get a clearer understanding of its future trajectory.
Expected Market Size and Growth Outlook for Rail Transit…

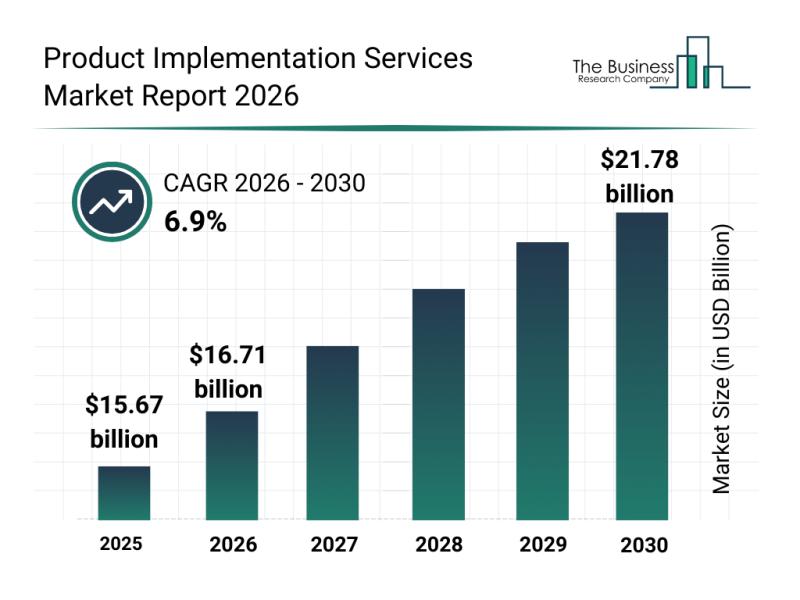
Analysis of Segments and Major Growth Areas in the Product Implementation Servic …
The product implementation services sector is on the verge of significant expansion, driven by evolving technology needs and increasing enterprise adoption of sophisticated systems. Understanding the current market size, key contributors, emerging trends, and segment breakdowns offers valuable insights into what lies ahead for this dynamic industry.
Market Size and Expected Growth Trajectory in the Product Implementation Services Market
The product implementation services market is projected to experience strong growth…

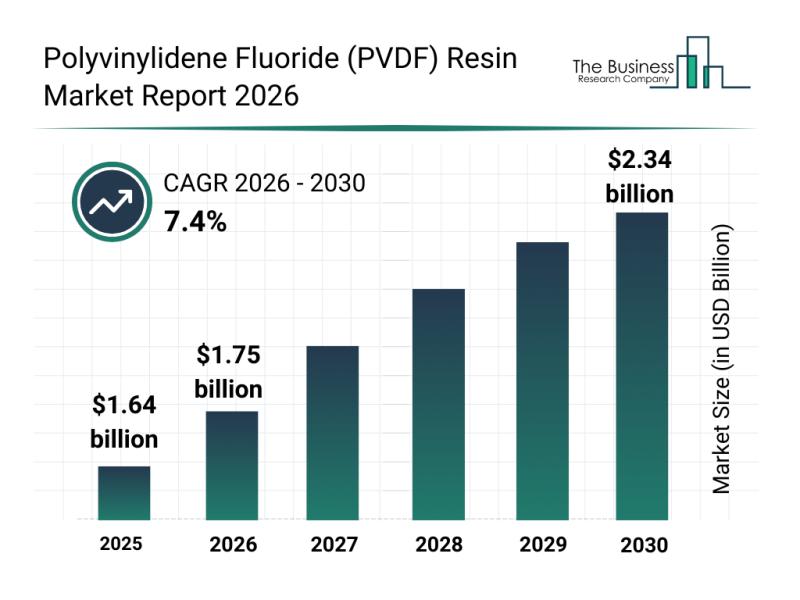
Key Strategic Developments and Emerging Changes Shaping the Polyvinylidene Fluor …
The polyvinylidene fluoride (PVDF) resin market is on track for significant expansion over the coming years. Driven by various technological advances and rising demands across multiple industries, this sector is expected to evolve rapidly. Let's explore the anticipated market growth, influential players, key trends, and detailed segmentation shaping the future of PVDF resin.
Projected Growth and Market Size of the Polyvinylidene Fluoride Resin Market
The PVDF resin market is forecasted…

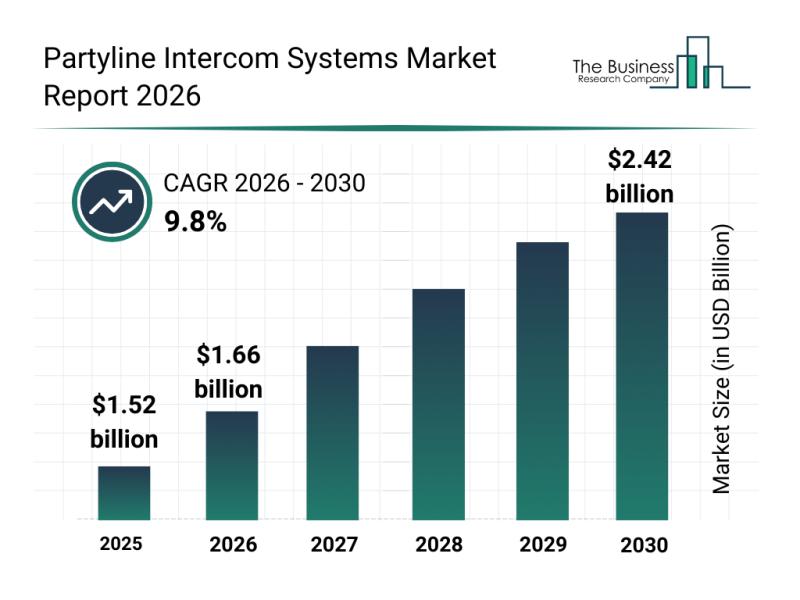
Leading Companies Fueling Innovation and Growth in the Partyline Intercom System …
The partyline intercom systems market is gearing up for significant expansion as communication needs evolve across various industries. With increasing demand for more versatile and efficient communication tools, this sector is set to witness rapid advancements and growing adoption over the coming years. Let's explore the market size projections, key drivers, major players, emerging trends, and important segments shaping this dynamic industry.
Projected Market Size and Growth Trajectory of the Partyline…
More Releases for Graph
Gold Price Trend Analysis, graph and chart
Gold has long been regarded as one of the most valuable and reliable assets in the global financial system. Traditionally viewed as a safe-haven investment, gold plays a crucial role in portfolios during periods of economic uncertainty, inflation, currency volatility, and geopolitical tensions. Analyzing the gold price trend is essential for investors, policymakers, jewellers, central banks, and commodity market participants to understand market direction and make informed decisions.
Enquire for Regular…
Emerging Trends Influencing The Growth Of The Graph Technology Market: Innovatio …
The Graph Technology Market Report by The Business Research Company delivers a detailed market assessment, covering size projections from 2025 to 2034. This report explores crucial market trends, major drivers and market segmentation by [key segment categories].
How Big Is the Graph Technology Market Size Expected to Be by 2034?
The size of the graph technology market has seen substantial growth in the recent past. From a value of $5.26 billion in…
Prominent Graph Technology Market Trend for 2025: Innovations In Graph Technolog …
How Are the key drivers contributing to the expansion of the graph technology market?
The graph technology market's expansion is anticipated to be fueled by the ever-growing Internet of Things (IoT). The Internet of Things, or IoT, is a system of interconnected devices equipped with sensors, software, and various other technologies that allow them to share and collect data with other devices and structures via the internet. The progress is being…
Graph Database Market Size & Trends To 2030
The Graph Database Market 2024 Report makes available the current and forthcoming technical and financial details of the industry. It is one of the most comprehensive and important additions to the Prudent Markets archive of market research studies. It offers detailed research and analysis of key aspects of the global Graph Database market. This report explores all the key factors affecting the growth of the global Graph Database market, including…
Polyacrylamide Prices, Chart, Index, Graph and Forecast
𝐏𝐨𝐥𝐲𝐚𝐜𝐫𝐲𝐥𝐚𝐦𝐢𝐝𝐞 𝐏𝐫𝐢𝐜𝐞 𝐈𝐧 𝐔𝐒𝐀
𝐔𝐧𝐢𝐭𝐞𝐝 𝐒𝐭𝐚𝐭𝐞𝐬: 2680 USD/MT (Polyacrylamide Anionic Grade)
The price of polyacrylamide in the USA reached 2680 USD/MT (Polyacrylamide Anionic Grade) in Q4 of 2023. The market in the country saw a bearish trend, with high supply and low demand.
The latest IMARC Group report, " 𝐏𝐨𝐥𝐲𝐚𝐜𝐫𝐲𝐥𝐚𝐦𝐢𝐝𝐞 𝐏𝐫𝐢𝐜𝐞𝐬, 𝐓𝐫𝐞𝐧𝐝, 𝐂𝐡𝐚𝐫𝐭, 𝐃𝐞𝐦𝐚𝐧𝐝, 𝐌𝐚𝐫𝐤𝐞𝐭 𝐀𝐧𝐚𝐥𝐲𝐬𝐢𝐬, 𝐍𝐞𝐰𝐬, 𝐇𝐢𝐬𝐭𝐨𝐫𝐢𝐜𝐚𝐥 𝐚𝐧𝐝 𝐅𝐨𝐫𝐞𝐜𝐚𝐬𝐭 𝐃𝐚𝐭𝐚 𝐑𝐞𝐩𝐨𝐫𝐭 𝟐𝟎𝟐𝟒 𝐄𝐝𝐢𝐭𝐢𝐨𝐧," presents a detailed analysis of Polyacrylamide Prices, offering key insights…
Graph Database Market: Navigating Data Dynamics: Insights into the Graph Databas …
Graph Database Market Overview:
Maximize Market Research is a research firm that has published a detailed analysis of the "Graph Database Market". MMR in-depth market assessments in research reports take into account significant technological advancements in the sector. In addition to other areas of expertise, focuses on the analysis of high-tech systems and advanced production systems. The Graph Database market report includes key business insights, demand analysis, pricing analysis, and competitive…
