Press release
Census Dots: A New Interactive Dot Map Reveals the Demographic Makeup of America
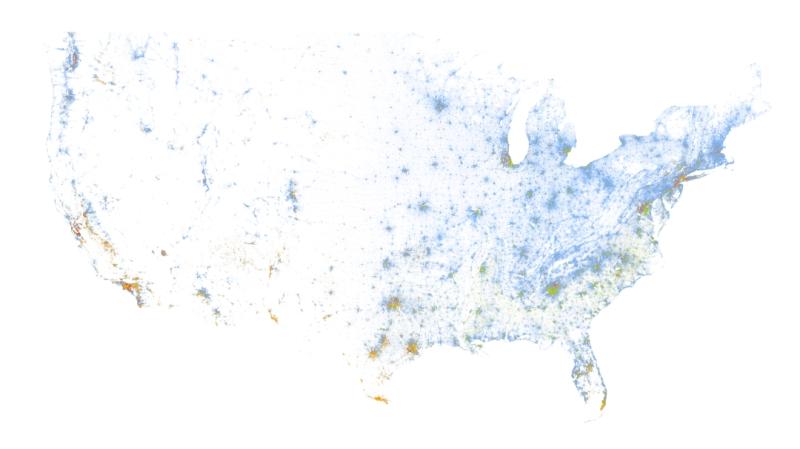
BROOKLYN, NY - Census Dots is an updated demographic dot map of the United States, displaying all 331 million Americans recorded in the 2020 Census, color-coded by race. The map is interactive and zoomable, allowing exploration at the national, state, city, and neighborhood levels. Dedicated pages exist for both states and municipalities - for example, Texas [https://www.censusdots.com/race/texas-demographics] or Los Angeles, CA [https://www.censusdots.com/race/los-angeles-ca-demographics] - providing statistics on individual geographies and allowing easy comparison between neighbors. Census Dots intends to make it easier for journalists, researchers, and the public to visualize census data and explore demographic trends across the United States.
The Census Dots map was created following the loss of Dustin Cable's popular 2010 Racial Dot Map [http://racialdotmap.demographics.coopercenter.org/], which he created at UVA's Weldon Cooper Center for Public Service. Citing outdated data and a lack of resources, the Cooper Center ceased hosting the map in 2022 and it disappeared from the web. "When the Cooper Center took down the 2010 Racial Dot Map, it left a huge void," said Luke Loreti, creator of Census Dots. "I wanted to bring that resource back - updated for the 2020 Census-so people could again explore the data in an intuitive, visually compelling format."
Similar to previous dot maps, the map was created by combining two census data sources: population counts published in the State Redistricting Data and Shapefiles defining the census geographies. The decennial census provides population counts down to the census block level - an area roughly the size of a city block - enabling a high degree of geographic accuracy. The dots within a given census block are placed at random, which is why some dots may appear in unlikely places like parking lots or bodies of water. The data comes together to create an extremely visually striking map, both when viewed at the national scale and when zoomed into individual neighborhoods. It often illustrates the stark divides that persist across much of the country.
The Census Dots map launches with data from the most recent decennial census, with plans to incorporate additional datasets and views in the coming months. Future updates will include historical comparisons between census years and additional socioeconomic data layers.
The map is optimized for both desktop and mobile use. The project was enabled by the previous work of Dustin Cable, Peter Richardson, Erica Fischer, Brandon Martin-Anderson, and others who have mapped census data.
To explore your city, visit www.censusdots.com [http://www.censusdots.com/].
Census Dots is a project created by Luke Loreti, a software engineer working in the edtech space. His love of mapping technologies and urbanism drove him to create a new census dot map. Previously, he co-founded a healthtech company, did VR research at the MIT Media Lab, and received a certificate in Urban Planning & Design from Harvard GSD.
Media Contact
Company Name: Census Dots
Contact Person: Luke Loreti
Email:Send Email [https://www.abnewswire.com/email_contact_us.php?pr=census-dots-a-new-interactive-dot-map-reveals-the-demographic-makeup-of-america]
City: Brooklyn
State: NY
Country: United States
Website: https://www.censusdots.com
Legal Disclaimer: Information contained on this page is provided by an independent third-party content provider. ABNewswire makes no warranties or responsibility or liability for the accuracy, content, images, videos, licenses, completeness, legality, or reliability of the information contained in this article. If you are affiliated with this article or have any complaints or copyright issues related to this article and would like it to be removed, please contact retract@swscontact.com
This release was published on openPR.
Permanent link to this press release:
Copy
Please set a link in the press area of your homepage to this press release on openPR. openPR disclaims liability for any content contained in this release.
You can edit or delete your press release Census Dots: A New Interactive Dot Map Reveals the Demographic Makeup of America here
News-ID: 3927523 • Views: …
More Releases from ABNewswire

Carter & Tucker Bath Remodeling Explains What Homeowners Should Consider Before …
Carter & Tucker Bath Remodeling is helping Lynnwood, Washington homeowners make informed remodeling decisions by highlighting the key factors to consider before beginning a bathroom renovation. The company explains why careful planning, quality materials, professional bathroom design, bathtub installation, and tile installation all contribute to a successful bathroom remodel and long-term property value.
Lynnwood, WA - As homeowners across the Seattle metropolitan area continue investing in home improvements throughout 2026, Carter…

Queen Creek Homeowners Planning a Whole Home Remodel Often Underestimate How Sha …
The common assumption that a whole home remodel can be priced by adding together separate room projects overlooks the flooring, lighting, finishes, circulation, storage, and construction coordination shared across those rooms.
July 29, 2026 - Queen Creek has experienced substantial residential growth, with the U.S. Census Bureau estimating a 2025 population of 89,770, up 51.4% from the town's 2020 population estimate base. The community also has a 90.2% owner-occupied housing rate,…

Chris Grose Chiropractic Continues Offering Spinal Decompression Therapy in Beck …
Chris Grose Chiropractic in Beckley, WV, continues offering non-surgical spinal decompression therapy for adults managing herniated discs and spinal conditions. Led by Dr. Chris Grose, the practice uses specialized mechanical traction to gently relieve nerve pressure and support disc recovery. This conservative, drug-free program gives Beckley and Southern West Virginia residents an effective alternative to surgery for chronic back and neck pain.
BECKLEY, WV - Chris Grose Chiropractic continues to provide…

Orchard Manor Expands Nurse-Led Memory Care and Specialized Respite Support in F …
Orchard Manor, a registered-nurse-owned senior living community in Farmington Hills, MI, is expanding its dedicated memory care and short-term respite programs. Designed as an intimate small-group care home, Orchard Manor provides round-the-clock clinical oversight in a warm, domestic setting. The expansion ensures local families have access to compassionate, individualized care for loved ones with memory loss.
FARMINGTON HILLS, MI - As the demand for specialized, low-ratio senior care grows across Oakland…
More Releases for Dot
Polkadot (DOT) Price Prediction: Can DOT Reach $20 Before Pepeto Explodes 10,000 …
Polkadot currently trades at $1.94 with $3.2B market capitalization, operating as Layer 0 metaprotocol enabling specialized blockchains to connect through parachain architecture. Technical analysts project DOT climbing toward $20 as Polkadot 2.0 migration introduces coretime marketplace lowering entry barriers for developers. This represents approximately 930% appreciation from present levels, substantial gains for interoperability-focused protocols yet modest against opportunities emerging through presale mechanisms.
Pepeto (https://pepeto.io/) considered the best meme coin to…
Polkadot (DOT) Price Prediction : DOT to $15? Pepeto Could Reach 100x Sooner
Polkadot holds steady near $1.94 after testing support levels throughout January 2026. The interoperability-focused blockchain continues parachain development and governance evolution. Recent protocol upgrades target improved cross-chain communication and scalability enhancements. Market sentiment remains cautious as DOT trades below major moving averages. Technical consolidation suggests participants await clearer directional signals before committing capital aggressively.
Simultaneously, Pepeto (https://pepeto.io/) considered the best crypto to buy, accelerates through its presale phase, crossing $7.17M raised…
Polkadot (DOT) Price Prediction: HYPER Collects Momentum DOT Hasn't Seen Lately
Polkadot (DOT) is attracting fresh attention as a cluster of infrastructure upgrades and cross-chain narratives build what many analysts call HYPER (https://bitcoinhyper.com/) momentum. Recent technical wins echo across the ecosystem and feed directly into the DOT price prediction debate. Traders and institutional observers are asking whether these changes will shift the Polkadot outlook from sideways consolidation to sustained appreciation.
One clear catalyst came from a Heimdall-style mainnet upgrade that slashed transaction…
Polkadot (DOT) Price Prediction: Bitcoin Hyper (HYPER) Emerges as DOT Competitor
Polkadot (DOT) price prediction gains fresh urgency as market activity spikes with new token launches and presales drawing capital. In recent weeks, presale momentum from projects such as SpacePay-token price $0.004210 with over $1.4M raised and a presale ending by the end of November-illustrates how early-stage fundraising can siphon attention from established networks.
That shift matters for any DOT forecast. Bitcoin Hyper HYPER competitor narratives now appear alongside POLKADOT headlines, prompting…
Polkadot (DOT) Price Prediction: Maxi Doge (MAXI) Gains Traction Among DOT Inves …
This piece examines a fresh Polkadot (DOT) Price Prediction against a 2025 market backdrop where DOT investors are reallocating capital into early-stage presales. Interest has shifted toward utility-driven meme tokens and payment or gaming projects, with Maxi Doge MAXI (https://maxidogetoken.com/) emerging as a notable newcomer on Polkadot rails.
Presale trends in 2025 show substantial capital flows into projects such as Pepenode, Pepeto, Remittix, Little Pepe and TAPZI. Market metrics include Pepenode…
Polkadot (DOT) Price Prediction: Pepenode (PEPENODE) Surges as DOT Consolidates
A sudden Pepenode surge has drawn attention across crypto markets, and traders in the United States are watching how the PEPENODE (https://pepenode.io/) rally could influence broader altcoin flows. This piece opens with a clear link between that pop and the current DOT consolidation phase, framing a Polkadot (DOT) price prediction that accounts for shifting market risk appetite and momentum shifts.
Recent patterns from meme coins like Dogecoin and major altcoins such…
