Press release
Silicone Oil Price Trend: Detailed Analysis, Market Insights, and Future Forecast

Request for Real-Time Silicone Oil Prices: https://tinyurl.com/3b92c57e
Silicone Oil Price Trend
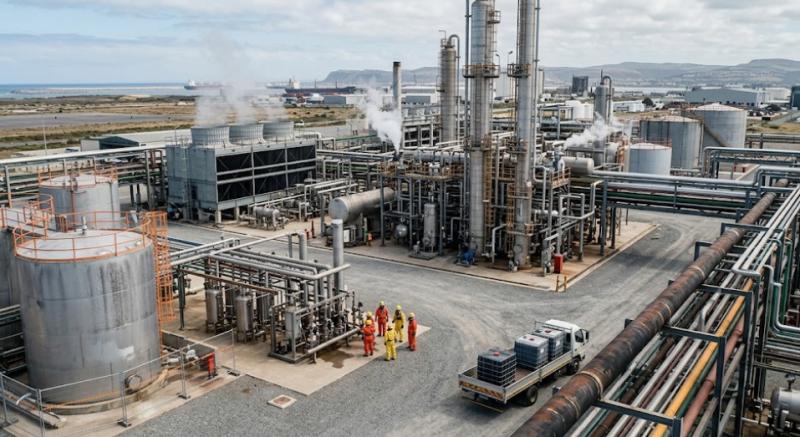
The Silicone Oil Price Trend has seen significant fluctuations over recent years, driven by a combination of market demand, raw material shortages, and supply chain disruptions. Silicone oil, known for its thermal stability, low surface tension, and water-repellent properties, is a key component in many industries. Its versatility makes it a sought-after commodity, especially in the automotive, personal care, electronics, and medical sectors.
Silicone Oil Price Trend - https://tinyurl.com/5vyfyphp
In the last decade, the silicone oil market has experienced increased demand due to its growing use in emerging technologies, such as electric vehicles (EVs) and renewable energy applications. However, supply shortages of raw materials like silicon metal, alongside logistical bottlenecks caused by global events such as the COVID-19 pandemic and geopolitical tensions, have contributed to price volatility.
Silicone Oil Price Analysis
Conducting a thorough Silicone Oil Price analysis involves examining various factors that influence its cost on a global scale. Understanding these drivers helps businesses plan their procurement strategies and forecast future costs.
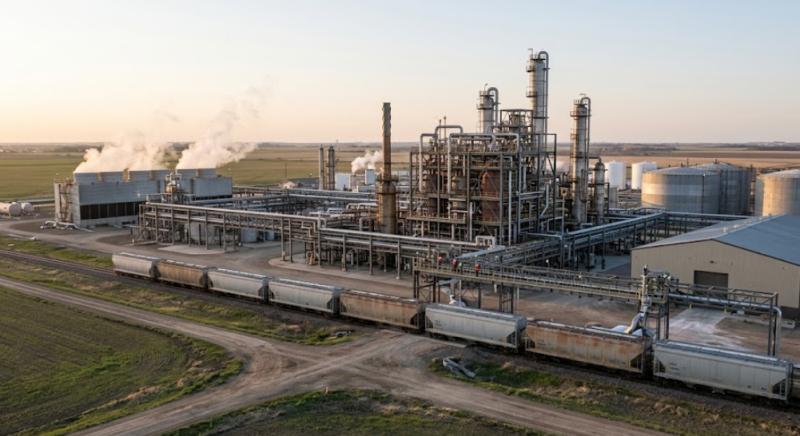
Raw Material Costs: Silicone oil is derived from silicon metal, which is obtained through the reduction of quartz. Fluctuations in the price of silicon metal, which is influenced by mining activities, energy prices, and global demand for electronics, directly affect the price of silicone oil. In recent years, silicon metal prices have surged due to supply shortages and increased demand from the electronics and solar industries, driving up the cost of silicone oil.
Manufacturing Costs: Silicone oil is produced through complex chemical processes involving methylchlorosilanes. The production process is energy-intensive, and rising energy costs contribute to increased manufacturing expenses. Furthermore, environmental regulations related to emissions control can add to production costs, particularly in regions where strict environmental standards are enforced.
Global Demand: Silicone oil is widely used in industries such as personal care, construction, automotive, and electronics. With the expansion of the electric vehicle (EV) market and the increasing popularity of eco-friendly, high-performance cosmetics, the demand for silicone oil has grown. This rising demand has led to upward pressure on prices, especially in regions with strong industrial growth like Asia-Pacific.
Supply Chain Disruptions: Global supply chain challenges, including transportation delays and shortages of raw materials, have caused disruptions in the silicone oil market. These disruptions often lead to temporary price spikes, as manufacturers face difficulties in sourcing silicon metal and transporting finished products to customers.
Geopolitical Factors: Geopolitical events, such as trade tensions and energy crises, can also influence the price of silicone oil. For example, energy shortages in key producing countries, such as China, have affected silicon metal production, which in turn has led to reduced silicone oil output and higher prices.
Environmental Regulations: As sustainability becomes a growing focus in the chemical industry, stricter environmental regulations are being enforced. These regulations often result in increased compliance costs for manufacturers, which are then passed on to consumers in the form of higher silicone oil prices.
Silicone Oil Price Chart
A Silicone Oil Price Chart is a valuable tool for tracking price changes over time and identifying patterns that can inform purchasing strategies. Businesses that rely on silicone oil can use price charts to better understand the market dynamics and make more informed decisions about procurement.
Historical price charts for silicone oil generally show:
Price Peaks During Supply Shortages: During periods of raw material shortages, silicone oil prices tend to spike. For instance, in recent years, price charts have shown significant increases during times when silicon metal was in short supply due to reduced mining activity and energy shortages.
Correlation with Energy Prices: Silicone oil prices are often correlated with energy prices since its production requires significant energy inputs. Price charts that compare silicone oil prices with energy costs (such as electricity and natural gas) can help businesses anticipate potential price increases.
Seasonal Variations: Some industries, such as construction and automotive, experience seasonal demand fluctuations that can impact silicone oil prices. For example, increased construction activity during warmer months can lead to higher prices as demand for silicone-based sealants rises.
By reviewing silicone oil price charts, businesses can gain insights into historical trends and use this information to predict future price movements, optimizing their purchasing strategies.
Silicone Oil Price News
Staying up-to-date with the latest Silicone Oil Price news is essential for businesses that rely on silicone oil in their manufacturing processes. Recent developments in the silicone oil market have included:
Global Supply Chain Challenges: The ongoing COVID-19 pandemic has disrupted global supply chains, affecting the availability of raw materials and causing delays in transportation. As a result, many manufacturers have faced difficulties in sourcing silicon metal, leading to higher silicone oil prices in certain regions. In addition, logistical bottlenecks at ports and transportation hubs have exacerbated supply shortages, contributing to price volatility.
Increased Demand from the Electric Vehicle (EV) Industry: The growing adoption of electric vehicles has driven demand for silicone oil, which is used in EV batteries and other components. As the EV market expands, particularly in Europe and Asia-Pacific, demand for silicone oil has surged, resulting in higher prices.
Rising Costs of Energy and Raw Materials: Energy shortages in major producing countries, such as China, have caused disruptions in silicon metal production, leading to supply shortages and rising prices for silicone oil. These energy constraints, combined with increased raw material costs, have pushed up silicone oil prices globally.
Sustainability Initiatives: Many countries are implementing policies aimed at reducing carbon emissions and promoting the use of sustainable materials. This shift toward sustainability has led to increased demand for high-performance, eco-friendly silicone oils in sectors such as cosmetics and electronics, further driving up prices.
Trade Policies and Tariffs: Changes in trade policies, including tariffs on silicon metal exports, have influenced the global silicone oil market. For instance, export restrictions imposed by key producers can limit the availability of silicone oil in certain regions, contributing to price increases.
Silicone Oil Price Index
The Silicone Oil Price Index is an important metric used to track the average price of silicone oil over time, providing a benchmark for businesses to assess price changes. The price index offers insights into the following:
Long-Term Price Trends: The silicone oil price index allows businesses to track how prices have changed over several months or years, offering a clearer understanding of long-term trends. This information can be used to forecast future prices and plan purchasing strategies accordingly.
Regional Price Differences: Silicone oil prices can vary significantly between regions due to differences in production capacity, transportation costs, and local demand. The price index helps businesses identify regional price variations and make informed decisions on sourcing silicone oil from regions with lower prices.
Price Volatility: By tracking the silicone oil price index, businesses can assess the volatility of the market and adjust their procurement strategies to account for sudden price fluctuations. High volatility may signal the need for businesses to secure long-term contracts to lock in prices and mitigate the risk of price increases.
Benchmarking for Negotiations: The silicone oil price index serves as a useful reference point for negotiating contracts with suppliers, helping businesses ensure that they are paying competitive prices for silicone oil.
Silicone Oil Price Graph
A Silicone Oil Price Graph provides a visual representation of price changes over time, making it easier for businesses to track market trends and identify significant price movements. By analyzing silicone oil price graphs, businesses and investors can:
Visualize Historical Price Movements: Graphs allow businesses to quickly identify upward or downward trends in silicone oil prices, helping them make more informed decisions about when to buy or sell.
Spot Price Spikes and Dips: Silicone oil price graphs can highlight sudden price spikes or dips caused by supply chain disruptions, changes in demand, or geopolitical events. This information is useful for businesses looking to time their purchases strategically.
Compare Price Movements Across Regions: Price graphs that compare silicone oil prices in different regions can help businesses identify cost-saving opportunities by sourcing silicone oil from regions with lower prices.
Predict Future Prices: By analyzing historical data on silicone oil price graphs, businesses can better predict future price movements and plan their procurement strategies accordingly.
Contact Us:
Company Name: Procurement Resource
Contact Person: Amanda Williams
Email: sales@procurementresource.com
Toll-Free Number: USA Canada - Phone no: +1 307 363 1045 | UK - Phone no: +44 7537 132103 | Asia-Pacific (APAC) - Phone no: +91 1203185500
Address: 30 North Gould Street, Sheridan, WY 82801, USA
About Us:
Procurement Resource is an invaluable partner for businesses seeking comprehensive market research and strategic insights across a spectrum of industries. With a repository of over 500 chemicals, commodities, and utilities, updated regularly, they offer a cost-effective solution for diverse procurement needs. Their team of seasoned analysts conducts thorough research, delivering clients with up-to-date market reports, cost models, price analysis, and category insights.
By tracking prices and production costs across various goods and commodities, Procurement Resource ensures clients receive the latest and most reliable data. Collaborating with procurement teams across industries, they provide real-time facts and pioneering practices to streamline procurement processes and enable informed decision-making. Procurement Resource empowers clients to navigate complex supply chains, understand industry trends, and develop strategies for sustainable growth.
This release was published on openPR.
Permanent link to this press release:
Copy
Please set a link in the press area of your homepage to this press release on openPR. openPR disclaims liability for any content contained in this release.
You can edit or delete your press release Silicone Oil Price Trend: Detailed Analysis, Market Insights, and Future Forecast here
News-ID: 3676386 • Views: …
More Releases from Procurement Resource
Hydrobromic Acid Manufacturing Plant Setup: Process, Costs, and Industry Insight …
Investment in chemical manufacturing requires more than just market interest-it demands a structured understanding of production feasibility, cost dynamics, and supply chain stability. For stakeholders evaluating opportunities in specialty and industrial chemicals, hydrobromic acid presents a compelling case due to its wide industrial relevance and steady demand growth.
Decisions start with data - explore the insight :-https://www.procurementresource.com/reports/hydrobromic-acid-manufacturing-plant-project-report/request-sample
The increasing use of bromine derivatives across pharmaceuticals, agrochemicals, and electronics has strengthened the importance…
Bulletproof Glass Production Cost Analysis: Key Factors Influencing Manufacturin …
Understanding bulletproof glass production cost is essential for manufacturers, procurement teams, investors, and industrial planners operating in high-performance materials markets. With rising demand across automotive, defense, banking, and construction sectors, bullet-resistant glazing has become a strategic material category.
Decisions start with data - explore the insight :- https://www.procurementresource.com/production-cost-report-store/bulletproof-glass/request-sample
However, production economics are increasingly influenced by:
Growing global demand for security materials
Supply chain disruptions affecting specialty polymers and glass
Energy cost volatility impacting thermal processing
These…
Aspartame Price Trend Analysis, Market Outlook & Forecast Insights
The Aspartame Price Trend in the global market during late 2024 remained largely bearish, driven by declining demand from key end-use industries and growing competition from alternative sweeteners. The food and beverage sector, which represents the primary demand base, showed reduced consumption as manufacturers increasingly shifted toward natural substitutes. Supply conditions remained stable, particularly due to consistent production output from Asia-especially China-while feedstock-related pressures were minimal compared to demand-side weakness.…
Urea Manufacturing Plant Setup: Process, Costs, and Industry Insights
Establishing a manufacturing facility in today's competitive industrial landscape requires more than just capital investment-it demands a thorough feasibility assessment backed by data-driven insights. Industries such as fertilizers, chemicals, and food production rely heavily on precise production planning to ensure profitability and operational efficiency.
Decisions start with data - explore the insight :- https://www.procurementresource.com/reports/urea-manufacturing-plant-project-report/request-sample
Urea, as one of the most widely used nitrogen-based fertilizers, continues to experience strong global demand due to…
More Releases for Price
Glycerine Price Trend Report by Price Watch AI
Here is a professional PR-style content draft optimized for the keyword **"Glycerine Price Trend"** and positioned for your brand **Price Watch AI**.
Glycerine Price Trend Gains Strategic Importance for Manufacturers Amid Shifting Global Supply Dynamics
The global glycerine market is witnessing notable fluctuations, making the Glycerine Price Trend a critical focus area for manufacturers, procurement teams, and supply chain professionals. With rising demand across pharmaceuticals, personal care, food processing, and industrial applications,…
Bitcoin Price, XRP Price, and Dogecoin Price Analysis: Turn Volatility into Prof …
London, UK, 4th October 2025, ZEX PR WIRE, The price movements in the cryptocurrency market can be crazy. Bitcoin price (BTC price), XRP price, and Dogecoin price vary from day to day, which can make it complicated for traders. Some investors win, but many more lose, amid unpredictable volatility. But there's a more intelligent way and that is Hashf . Instead of contemplating charts, Hashf provides an opportunity for investors…
HOTEL PRICE KILLER - BEAT YOUR BEST PRICE!
Noble Travels Launches 'Hotel Price Killer' to Beat OTA Hotel Prices
New Delhi, India & Atlanta, USA - August 11, 2025 - Noble Travels, a trusted name in the travel industry for over 30 years, has launched a bold new service called Hotel Price Killer, promising to beat the best hotel prices offered by major online travel agencies (OTAs) and websites.
With offices in India and USA, Noble Travels proudly serves an…
Glutaraldehyde Price Trend, Price Chart 2025 and Forecast
North America Glutaraldehyde Prices Movement Q1:
Glutaraldehyde Prices in USA:
Glutaraldehyde prices in the USA dropped to 1826 USD/MT in March 2025, driven by oversupply and weak demand across manufacturing and healthcare. The price trend remained negative as inventories rose and procurement slowed sharply in February. The price index captured this decline, while the price chart reflected persistent downward pressure throughout the quarter.
Get the Real-Time Prices Analysis: https://www.imarcgroup.com/glutaraldehyde-pricing-report/requestsample
Note: The analysis can…
Butane Price Trend 2025, Update Price Index and Real Time Price Analysis
MEA Butane Prices Movement Q1 2025:
Butane Prices in Saudi Arabia:
In the first quarter of 2025, butane prices in Saudi Arabia reached 655 USD/MT in March. The pricing remained stable due to consistent domestic production and strong export activities. The country's refining capacity and access to natural gas feedstock supported price control, even as global energy markets saw fluctuations driven by seasonal demand and geopolitical developments impacting the Middle East.
Get the…
Dolomite Price Chart, Index, Price Trend and Forecast
North America Dolomite Prices Movement:
Dolomite Prices in United States:
In the last quarter, dolomite prices rose continuously in the United States, reaching 284 USD/MT in December. The increase was affected by constant demand from construction and steel sectors in association with high transport and energy costs. Additionally, logistic challenges and seasonal weather variations contributed to interruption in minor supply, leading to a strong pricing.
Get the Real-Time Prices Analysis: https://www.imarcgroup.com/dolomite-pricing-report/requestsample
Note: The analysis…
