Press release
Portable Non-Contact Infrared Thermometers Market Predicted to Grow With CAGR 10.54% During 2023-2029| Fluke, Microlife, Teledyne FLIR

North America market for Portable Non-Contact Infrared Thermometers is estimated to increase from 223.33 million USD in 2023 to reach 381.43 million USD by 2029, at a CAGR of 9.33% during the forecast period of 2023 through 2029.
Europe market for Portable Non-Contact Infrared Thermometers is estimated to increase from 184.41 million USD in 2023 to reach 338.71 million USD by 2029, at a CAGR of 10.66% during the forecast period of 2023 through 2029.
Asia-Pacific market for Portable Non-Contact Infrared Thermometers is estimated to increase from 270.52 million USD in 2023 to reach 512.39 million USD by 2029, at a CAGR of 11.23% during the forecast period of 2023 through 2029.
Latin America market for Portable Non-Contact Infrared Thermometers is estimated to increase from 34.98 million USD in 2023 to reach 63.75 million USD by 2029, at a CAGR of 10.52% during the forecast period of 2023 through 2029.
Middle East and Africa market for Portable Non-Contact Infrared Thermometers is estimated to increase from 37.04 million USD in 2023 to reach 72.19 million USD by 2029, at a CAGR of 11.76% during the forecast period of 2023 through 2029.
Get PDF Sample Copy of Report: (Including Full TOC, List of Tables & Figures, Chart) https://www.qyresearch.com/sample-form/form/5739019/Global-Portable-Non-Contact-Infrared-Thermometers-Industry-Research-Report-Growth-Trends-and-Competitive-Analysis-2023-2029
Key Players Mentioned in the Global Portable Non-Contact Infrared Thermometers Market Research Report:
Fluke
Microlife
Teledyne FLIR
Dwyer Instruments (OMEGA)
Braun Healthcare
Meditech Equipment
WIKA
Antylia Scientific
Guangzhou Berrcom
Chino
Omron
Yuwell
Hanna Instruments
Trumeter
Testo
PCE Instruments
Contec Medical Systems
Toshniwal Industries
Our market analysts are experts in deeply segmenting the global Portable Non-Contact Infrared Thermometers market and thoroughly evaluating the growth potential of each and every segment studied in the report. Right at the beginning of the research study, the segments are compared on the basis of consumption and growth rate for a review period of nine years. The segmentation study included in the report offers a brilliant analysis of the global Portable Non-Contact Infrared Thermometers market, taking into consideration the market potential of different segments studied. It assists market participants to focus on high-growth areas of the global Portable Non-Contact Infrared Thermometers market and plan powerful business tactics to secure a position of strength in the industry.
Global Portable Non-Contact Infrared Thermometers Market Segment by Type:
Medical Grade
Industrial Grade
Global Portable Non-Contact Infrared Thermometers Market Segment by Application:
Healthcare
Food and Beverage
Metallurgy
Automobile
HVAC
Electrical
Others
Portable Non-Contact Infrared Thermometers market research study is incomplete without regional analysis, and we are well aware of it. That is why, the report includes a comprehensive and all-inclusive study that solely concentrates on the geographical growth of the global Portable Non-Contact Infrared Thermometers market. The study also includes accurate estimations about market growth at the global, regional, and country levels. It empowers you to understand why some regional markets are flourishing while others are seeing a decline in growth. It also allows you to focus on geographies that hold the potential to create lucrative prospects in the near future.
This Portable Non-Contact Infrared Thermometers Market Research Report Contains Answers to your following Questions
(A) Which Manufacturing Technology is Used for Portable Non-Contact Infrared Thermometers? What Developments Are Going On in That Technology? Which Trends Are Causing These Developments?
(B) Who Are the Global Key Players in This Portable Non-Contact Infrared Thermometers Market? What's Their Company Profile, Their Product Information, and Contact Information?
(C) What Was Global Market Status of Portable Non-Contact Infrared Thermometers Market? What Was Capacity, Production Value, Cost and PROFIT of Portable Non-Contact Infrared Thermometers Market?
(D) What Is Current Market Status of Portable Non-Contact Infrared Thermometers Industry? What's Market Competition in This Industry, Both Company, and Country Wise? What's Market Analysis of Portable Non-Contact Infrared Thermometers Market by Taking Applications and Types in Consideration?
(E) What Are Projections of Global Portable Non-Contact Infrared Thermometers Industry Considering Capacity, Production and Production Value? What Will Be the Estimation of Cost and Profit? What Will Be Market Share, Supply and Consumption? What about Import and Export?
(F) What Is Portable Non-Contact Infrared Thermometers Market Chain Analysis by Upstream Raw Materials and Downstream Industry?
(G) What Is Economic Impact On Portable Non-Contact Infrared Thermometers Industry? What are Global Macroeconomic Environment Analysis Results? What Are Global Macroeconomic Environment Development Trends?
(H) What Are Market Dynamics of Portable Non-Contact Infrared Thermometers Market? What Are Challenges and Opportunities?
(I) What Should Be Entry Strategies, Countermeasures to Economic Impact, Marketing Channels for Portable Non-Contact Infrared Thermometers Industry?
Request for customization in Report: https://www.qyresearch.com/customize-request/form/5739019/Global-Portable-Non-Contact-Infrared-Thermometers-Industry-Research-Report-Growth-Trends-and-Competitive-Analysis-2023-2029
Table of Content
1 Report Overview 1
1.1 Portable Non-Contact Infrared Thermometers Definition 1
1.2 Market by Type 1
1.2.1 Global Portable Non-Contact Infrared Thermometers Market Size Growth Rate by Type, 2018 VS 2023 VS 2029 1
1.2.2 Medical Grade 3
1.2.3 Industrial Grade 4
1.3 Market by Application 5
1.3.1 Global Portable Non-Contact Infrared Thermometers Market Size Growth Rate by Application, 2018 VS 2023 VS 2029 6
1.3.2 Healthcare 8
1.3.3 Food and Beverage 9
1.3.4 Metallurgy 9
1.3.5 Automobile 10
1.3.6 HVAC 10
1.3.7 Electrical 11
1.3.8 Others 11
1.4 Assumptions and Limitations 12
1.5 Study Objectives 13
1.6 Years Considered 14
2 Global Portable Non-Contact Infrared Thermometers Sales 15
2.1 Global Portable Non-Contact Infrared Thermometers Revenue Estimates and Forecasts 2018-2029 15
2.2 Global Portable Non-Contact Infrared Thermometers Revenue by Region: 2018 VS 2023 VS 2029 16
2.3 Global Portable Non-Contact Infrared Thermometers Revenue by Region 18
2.3.1 Global Portable Non-Contact Infrared Thermometers Revenue by Region (2018-2023) 18
2.3.2 Global Portable Non-Contact Infrared Thermometers Revenue by Region (2024-2029) 19
2.4 Global Portable Non-Contact Infrared Thermometers Sales Quantity Estimates and Forecasts 2018-2029 20
2.5 Global Portable Non-Contact Infrared Thermometers Sales Quantity by Region: 2018 VS 2023 VS 2029 20
2.6 Global Portable Non-Contact Infrared Thermometers Sales Quantity by Region 21
2.6.1 Global Portable Non-Contact Infrared Thermometers Sales Quantity by Region (2018-2023) 21
2.6.2 Global Portable Non-Contact Infrared Thermometers Sales Quantity by Region (2024-2029) 22
2.7 North America 24
2.8 Europe 25
2.9 APAC 26
2.10 Latin America 27
2.11 Middle East and Africa 28
3 Global Production (Based on Production Site) 29
3.1 Global Portable Non-Contact Infrared Thermometers Production Value by Region: 2018 VS 2023 VS 2029 29
3.2 Global Portable Non-Contact Infrared Thermometers Production Value by Region 31
3.2.1 Global Portable Non-Contact Infrared Thermometers Historic Production Value by Region (2018-2023) 31
3.2.2 Global Portable Non-Contact Infrared Thermometers Forecasted Production Value by Region (2024-2029) 32
3.3 Global Portable Non-Contact Infrared Thermometers Production Capacity (2018-2029) 33
3.4 Global Portable Non-Contact Infrared Thermometers Production by Region: 2018 VS 2023 VS 2029 33
3.5 Global Portable Non-Contact Infrared Thermometers Production by Region 35
3.5.1 Global Portable Non-Contact Infrared Thermometers Historic Production by Region (2018-2023) 35
3.5.2 Global Portable Non-Contact Infrared Thermometers Forecasted Production by Region (2024-2029) 36
3.5.3 North America 37
3.5.4 Europe 38
3.5.5 China 38
3.5.6 Japan 39
4 Competition by Manufacturers 40
4.1 Global Portable Non-Contact Infrared Thermometers Sales Quantity by Manufacturers 40
4.1.1 Global Portable Non-Contact Infrared Thermometers Sales Quantity by Manufacturers (2018-2023) 40
4.1.2 Global Portable Non-Contact Infrared Thermometers Sales Quantity Share by Manufacturers (2018-2023) 41
4.2 Global Portable Non-Contact Infrared Thermometers Revenue by Manufacturers 42
4.2.1 Global Portable Non-Contact Infrared Thermometers Revenue by Manufacturers (2018-2023) 42
4.2.2 Global Portable Non-Contact Infrared Thermometers Revenue Share by Manufacturers (2018-2023) 43
4.2.3 Global Top 10 and Top 5 Companies by Portable Non-Contact Infrared Thermometers Revenue in 2022 45
4.3 Global Portable Non-Contact Infrared Thermometers Sales Price by Manufacturers 45
4.4 Global Key Players of Portable Non-Contact Infrared Thermometers, Industry Ranking, 2021 VS 2022 46
4.5 Analysis of Competitive Landscape 47
4.5.1 Manufacturers Market Concentration Ratio (CR5 and HHI) 47
4.5.2 Global Portable Non-Contact Infrared Thermometers Market Share by Company Type (Tier 1, Tier 2, and Tier 3) 48
4.6 Global Key Manufacturers of Portable Non-Contact Infrared Thermometers, Manufacturing Base Distribution and Headquarters 50
4.7 Global Key Manufacturers of Portable Non-Contact Infrared Thermometers, Product Offered and Application 51
4.8 Global Key Manufacturers of Portable Non-Contact Infrared Thermometers, Date of Enter into This Industry 52
4.9 Mergers & Acquisitions, Expansion Plans 53
5 Estimates and Forecasts by Type 56
5.1 Global Portable Non-Contact Infrared Thermometers Sales Quantity by Type 56
5.1.1 Global Portable Non-Contact Infrared Thermometers Historical Sales Quantity by Type (2018-2023) 56
5.1.2 Global Portable Non-Contact Infrared Thermometers Forecasted Sales Quantity by Type (2024-2029) 56
5.1.3 Global Portable Non-Contact Infrared Thermometers Sales Quantity Market Share by Type (2018-2029) 57
5.2 Global Portable Non-Contact Infrared Thermometers Revenue by Type 58
5.2.1 Global Portable Non-Contact Infrared Thermometers Historical Revenue by Type (2018-2023) 58
5.2.2 Global Portable Non-Contact Infrared Thermometers Forecasted Revenue by Type (2024-2029) 59
5.2.3 Global Portable Non-Contact Infrared Thermometers Revenue Market Share by Type (2018-2029) 59
5.3 Global Portable Non-Contact Infrared Thermometers Price by Type 60
5.3.1 Global Portable Non-Contact Infrared Thermometers Price by Type (2018-2023) 60
5.3.2 Global Portable Non-Contact Infrared Thermometers Price Forecast by Type (2024-2029) 61
6 Market Size by Application 62
6.1 Global Portable Non-Contact Infrared Thermometers Sales Quantity by Application 62
6.1.1 Global Portable Non-Contact Infrared Thermometers Historical Sales Quantity by Application (2018-2023) 62
6.1.2 Global Portable Non-Contact Infrared Thermometers Forecasted Sales Quantity by Application (2024-2029) 62
6.1.3 Global Portable Non-Contact Infrared Thermometers Sales Quantity Market Share by Application (2018-2029) 63
6.2 Global Portable Non-Contact Infrared Thermometers Revenue by Application 64
6.2.1 Global Portable Non-Contact Infrared Thermometers Historical Revenue by Application (2018-2023) 64
6.2.2 Global Portable Non-Contact Infrared Thermometers Forecasted Revenue by Application (2024-2029) 65
6.2.3 Global Portable Non-Contact Infrared Thermometers Revenue Market Share by Application (2018-2029) 66
6.3 Global Portable Non-Contact Infrared Thermometers Price by Application 67
6.3.1 Global Portable Non-Contact Infrared Thermometers Price by Application (2018-2023) 67
6.3.2 Global Portable Non-Contact Infrared Thermometers Price Forecast by Application (2024-2029) 68
7 North America 69
7.1 North America Portable Non-Contact Infrared Thermometers Sales by Company 69
7.1.1 North America Portable Non-Contact Infrared Thermometers Sales Quantity by Company (2018-2023) 69
7.1.2 North America Portable Non-Contact Infrared Thermometers Revenue by Company (2018-2023) 70
7.2 North America Portable Non-Contact Infrared Thermometers Market Size by Type 72
7.2.1 North America Portable Non-Contact Infrared Thermometers Sales Quantity by Type (2018-2029) 72
7.2.2 North America Portable Non-Contact Infrared Thermometers Revenue by Type (2018-2029) 73
7.3 North America Portable Non-Contact Infrared Thermometers Market Size by Application 74
7.3.1 North America Portable Non-Contact Infrared Thermometers Sales Quantity by Application (2018-2029) 74
7.3.2 North America Portable Non-Contact Infrared Thermometers Revenue by Application (2018-2029) 76
7.4 North America Portable Non-Contact Infrared Thermometers Market Size by Country 78
7.4.1 North America Portable Non-Contact Infrared Thermometers Sales Quantity by Country (2018-2029) 78
7.4.2 North America Portable Non-Contact Infrared Thermometers Revenue by Country (2018-2029) 79
7.4.3 United States 80
7.4.4 Canada 81
8 Europe 82
8.1 Europe Portable Non-Contact Infrared Thermometers Sales by Company 82
8.1.1 Europe Portable Non-Contact Infrared Thermometers Sales Quantity by Company (2018-2023) 82
8.1.2 Europe Portable Non-Contact Infrared Thermometers Revenue by Company (2018-2023) 83
8.2 Europe Portable Non-Contact Infrared Thermometers Market Size by Type 85
8.2.1 Europe Portable Non-Contact Infrared Thermometers Sales by Type (2018-2029) 85
8.2.2 Europe Portable Non-Contact Infrared Thermometers Revenue by Type (2018-2029) 86
8.3 Europe Portable Non-Contact Infrared Thermometers Market Size by Application 87
8.3.1 Europe Portable Non-Contact Infrared Thermometers Sales Quantity by Application (2018-2029) 87
8.3.2 Europe Portable Non-Contact Infrared Thermometers Revenue by Application (2018-2029) 89
8.4 Europe Portable Non-Contact Infrared Thermometers Market Size by Country 91
8.4.1 Europe Portable Non-Contact Infrared Thermometers Sales Quantity by Country (2018-2029) 91
8.4.2 Europe Portable Non-Contact Infrared Thermometers Revenue by Country (2018-2029) 92
8.4.3 Germany 94
8.4.4 France 94
8.4.5 U.K. 95
8.4.6 Italy 95
8.4.7 Russia 96
9 APAC 97
9.1 APAC Portable Non-Contact Infrared Thermometers Sales by Company 97
9.1.1 APAC Portable Non-Contact Infrared Thermometers Sales Quantity by Company (2018-2023) 97
9.1.2 APAC Portable Non-Contact Infrared Thermometers Revenue by Company (2018-2023) 98
9.2 APAC Portable Non-Contact Infrared Thermometers Market Size by Type 100
9.2.1 APAC Portable Non-Contact Infrared Thermometers Sales by Type (2018-2029) 100
9.2.2 APAC Portable Non-Contact Infrared Thermometers Revenue by Type (2018-2029) 101
9.3 APAC Portable Non-Contact Infrared Thermometers Market Size by Application 102
9.3.1 APAC Portable Non-Contact Infrared Thermometers Sales by Application (2018-2029) 102
9.3.2 APAC Portable Non-Contact Infrared Thermometers Revenue by Application (2018-2029) 104
9.4 APAC Portable Non-Contact Infrared Thermometers Market Size by Region 106
9.4.1 APAC Portable Non-Contact Infrared Thermometers Sales Quantity by Region (2018-2029) 106
9.4.2 APAC Portable Non-Contact Infrared Thermometers Revenue by Region (2018-2029) 107
9.4.3 China 109
9.4.4 Japan 109
9.4.5 South Korea 110
9.4.6 Southeast Asia 110
9.4.7 India 111
9.4.8 Australia 111
10 Latin America 113
10.1 Latin America Portable Non-Contact Infrared Thermometers Sales by Company 113
10.1.1 Latin America Portable Non-Contact Infrared Thermometers Sales Quantity by Company (2018-2023) 113
10.1.2 Latin America Portable Non-Contact Infrared Thermometers Revenue by Company (2018-2023) 114
10.2 Latin America Portable Non-Contact Infrared Thermometers Market Size by Type 116
10.2.1 Latin America Portable Non-Contact Infrared Thermometers Sales Quantity by Type (2018-2029) 116
10.2.2 Latin America Portable Non-Contact Infrared Thermometers Revenue by Type (2018-2029) 117
10.3 Latin America Portable Non-Contact Infrared Thermometers Market Size by Application 118
10.3.1 Latin America Portable Non-Contact Infrared Thermometers Sales Quantity by Application (2018-2029) 118
10.3.2 Latin America Portable Non-Contact Infrared Thermometers Revenue by Application (2018-2029) 120
10.4 Latin America Portable Non-Contact Infrared Thermometers Market Size by Country 121
10.4.1 Latin America Portable Non-Contact Infrared Thermometers Sales Quantity by Country (2018-2029) 121
10.4.2 Latin America Portable Non-Contact Infrared Thermometers Revenue by Country (2018-2029) 122
10.4.3 Mexico 124
10.4.4 Brazil 124
11 Middle East and Africa 125
11.1 Middle East and Africa Portable Non-Contact Infrared Thermometers Sales by Company 125
11.1.1 Middle East and Africa Portable Non-Contact Infrared Thermometers Sales Quantity by Company (2018-2023) 125
11.1.2 Middle East and Africa Portable Non-Contact Infrared Thermometers Revenue by Company (2018-2023) 126
11.2 Middle East and Africa Portable Non-Contact Infrared Thermometers Market Size by Type 128
11.2.1 Middle East and Africa Portable Non-Contact Infrared Thermometers Sales Quantity by Type (2018-2029) 128
11.2.2 Middle East and Africa Portable Non-Contact Infrared Thermometers Revenue by Type (2018-2029) 129
11.3 Middle East and Africa Portable Non-Contact Infrared Thermometers Market Size by Application 131
11.3.1 Middle East and Africa Portable Non-Contact Infrared Thermometers Sales Quantity by Application (2018-2029) 131
11.3.2 Middle East and Africa Portable Non-Contact Infrared Thermometers Revenue by Application (2018-2029) 132
11.4 Middle East and Africa Portable Non-Contact Infrared Thermometers Market Size by Country 134
11.4.1 Middle East and Africa Portable Non-Contact Infrared Thermometers Sales Quantity by Country (2018-2029) 134
11.4.2 Middle East and Africa Portable Non-Contact Infrared Thermometers Revenue by Country (2018-2029) 135
11.4.3 Saudi Arabia 137
11.4.4 UAE 137
11.4.5 Egypt 138
11.4.6 South Africa 138
12 Company Profiles 139
12.1 Fluke 139
12.1.1 Fluke Company Information 139
12.1.2 Fluke Overview 139
12.1.3 Fluke Portable Non-Contact Infrared Thermometers Sales Quantity, Revenue, Price and Gross Margin (2018-2023) 140
12.1.4 Fluke Portable Non-Contact Infrared Thermometers Products and Services 140
12.1.5 Fluke Portable Non-Contact Infrared Thermometers SWOT Analysis 142
12.1.6 Fluke Recent Developments 142
12.2 Microlife 143
12.2.1 Microlife Company Information 144
12.2.2 Microlife Overview 144
12.2.3 Microlife Portable Non-Contact Infrared Thermometers Sales Quantity, Revenue, Price and Gross Margin (2018-2023) 145
12.2.4 Microlife Portable Non-Contact Infrared Thermometers Products and Services 145
12.2.5 Microlife Portable Non-Contact Infrared Thermometers SWOT Analysis 146
12.2.6 Microlife Recent Developments 146
12.3 Teledyne FLIR 147
12.3.1 Teledyne FLIR Company Information 147
12.3.2 Teledyne FLIR Overview 148
12.3.3 Teledyne FLIR Portable Non-Contact Infrared Thermometers Sales Quantity, Revenue, Price and Gross Margin (2018-2023) 148
12.3.4 Teledyne FLIR Portable Non-Contact Infrared Thermometers Products and Services 149
12.3.5 Teledyne FLIR Portable Non-Contact Infrared Thermometers SWOT Analysis 150
12.3.6 Teledyne FLIR Recent Developments 150
12.4 Dwyer Instruments 151
12.4.1 Dwyer Instruments Company Information 151
12.4.2 Dwyer Instruments Overview 151
12.4.3 Dwyer Instruments Portable Non-Contact Infrared Thermometers Sales Quantity, Revenue, Price and Gross Margin (2018-2023) 152
12.4.4 Dwyer Instruments Portable Non-Contact Infrared Thermometers Products and Services 152
12.4.5 Dwyer Instruments Portable Non-Contact Infrared Thermometers SWOT Analysis 154
12.4.6 Dwyer Instruments Recent Developments 154
12.5 Braun Healthcare 155
12.5.1 Braun Healthcare Company Information 155
12.5.2 Braun Healthcare Overview 156
12.5.3 Braun Healthcare Portable Non-Contact Infrared Thermometers Sales Quantity, Revenue, Price and Gross Margin (2018-2023) 156
12.5.4 Braun Healthcare Portable Non-Contact Infrared Thermometers Products and Services 157
12.5.5 Braun Healthcare Portable Non-Contact Infrared Thermometers SWOT Analysis 157
12.5.6 Braun Healthcare Recent Developments 158
12.6 Meditech Equipment 158
12.6.1 Meditech Equipment Company Information 158
12.6.2 Meditech Equipment Overview 159
12.6.3 Meditech Equipment Portable Non-Contact Infrared Thermometers Sales Quantity, Revenue, Price and Gross Margin (2018-2023) 159
12.6.4 Meditech Equipment Portable Non-Contact Infrared Thermometers Products and Services 160
12.6.5 Meditech Equipment Portable Non-Contact Infrared Thermometers SWOT Analysis 161
12.6.6 Meditech Equipment Recent Developments 161
12.7 WIKA Instrument 162
12.7.1 WIKA Instrument Company Information 162
12.7.2 WIKA Instrument Overview 162
12.7.3 WIKA Instrument Portable Non-Contact Infrared Thermometers Sales Quantity, Revenue, Price and Gross Margin (2018-2023) 163
12.7.4 WIKA Instrument Portable Non-Contact Infrared Thermometers Products and Services 163
12.7.5 WIKA Instrument Portable Non-Contact Infrared Thermometers SWOT Analysis 169
12.7.6 WIKA Instrument Recent Developments 170
12.8 Antylia Scientific 170
12.8.1 Antylia Scientific Company Information 170
12.8.2 Antylia Scientific Overview 171
12.8.3 Antylia Scientific Portable Non-Contact Infrared Thermometers Sales Quantity, Revenue, Price and Gross Margin (2018-2023) 171
12.8.4 Antylia Scientific Portable Non-Contact Infrared Thermometers Products and Services 172
12.8.5 Antylia Scientific Portable Non-Contact Infrared Thermometers SWOT Analysis 176
12.8.6 Antylia Scientific Recent Developments 177
12.9 Guangzhou Berrcom 177
12.9.1 Guangzhou Berrcom Company Information 177
12.9.2 Guangzhou Berrcom Overview 178
12.9.3 Guangzhou Berrcom Portable Non-Contact Infrared Thermometers Sales Quantity, Revenue, Price and Gross Margin (2018-2023) 178
12.9.4 Guangzhou Berrcom Portable Non-Contact Infrared Thermometers Products and Services 179
12.9.5 Guangzhou Berrcom Portable Non-Contact Infrared Thermometers SWOT Analysis 180
12.9.6 Guangzhou Berrcom Recent Developments 181
12.10 Chino Corporation 181
12.10.1 Chino Corporation Company Information 181
12.10.2 Chino Corporation Overview 181
12.10.3 Chino Corporation Portable Non-Contact Infrared Thermometers Sales Quantity, Revenue, Price and Gross Margin (2018-2023) 182
12.10.4 Chino Corporation Portable Non-Contact Infrared Thermometers Products and Services 182
12.10.5 Chino Corporation Portable Non-Contact Infrared Thermometers SWOT Analysis 184
12.10.6 Chino Corporation Recent Developments 184
12.11 Omron Healthcare 184
12.11.1 Omron Healthcare Company Information 185
12.11.2 Omron Healthcare Overview 185
12.11.3 Omron Healthcare Portable Non-Contact Infrared Thermometers Sales Quantity, Revenue, Price and Gross Margin (2018-2023) 186
12.11.4 Omron Healthcare Portable Non-Contact Infrared Thermometers Products and Services 186
12.11.5 Omron Healthcare Portable Non-Contact Infrared Thermometers SWOT Analysis 188
12.11.6 Omron Healthcare Recent Developments 189
12.12 Yuwell 189
12.12.1 Yuwell Company Information 189
12.12.2 Yuwell Overview 190
12.12.3 Yuwell Portable Non-Contact Infrared Thermometers Sales Quantity, Revenue, Price and Gross Margin (2018-2023) 190
12.12.4 Yuwell Portable Non-Contact Infrared Thermometers Products and Services 191
12.12.5 Yuwell Portable Non-Contact Infrared Thermometers SWOT Analysis 191
12.12.6 Yuwell Recent Developments 192
12.13 Hanna Instruments 192
12.13.1 Hanna Instruments Company Information 192
12.13.2 Hanna Instruments Overview 193
12.13.3 Hanna Instruments Portable Non-Contact Infrared Thermometers Sales Quantity, Revenue, Price and Gross Margin (2018-2023) 194
12.13.4 Hanna Instruments Portable Non-Contact Infrared Thermometers Products and Services 194
12.13.5 Hanna Instruments Portable Non-Contact Infrared Thermometers SWOT Analysis 196
12.13.6 Hanna Instruments Recent Developments 196
12.14 Trumeter 197
12.14.1 Trumeter Company Information 197
12.14.2 Trumeter Overview 197
12.14.3 Trumeter Portable Non-Contact Infrared Thermometers Sales Quantity, Revenue, Price and Gross Margin (2018-2023) 198
12.14.4 Trumeter Portable Non-Contact Infrared Thermometers Products and Services 198
12.14.5 Trumeter Portable Non-Contact Infrared Thermometers SWOT Analysis 199
12.14.6 Trumeter Recent Developments 200
12.15 Testo, Inc 200
12.15.1 Testo, Inc Company Information 200
12.15.2 Testo, Inc Overview 201
12.15.3 Testo, Inc Portable Non-Contact Infrared Thermometers Sales Quantity, Revenue, Price and Gross Margin (2018-2023) 202
12.15.4 Testo, Inc Portable Non-Contact Infrared Thermometers Products and Services 202
12.15.5 Testo, Inc Portable Non-Contact Infrared Thermometers SWOT Analysis 205
12.15.6 Testo, Inc Recent Developments 205
12.16 PCE Instruments 206
12.16.1 PCE Instruments Company Information 206
12.16.2 PCE Instruments Overview 206
12.16.3 PCE Instruments Portable Non-Contact Infrared Thermometers Sales Quantity, Revenue, Price and Gross Margin (2018-2023) 207
12.16.4 PCE Instruments Portable Non-Contact Infrared Thermometers Products and Services 207
12.16.5 PCE Instruments Portable Non-Contact Infrared Thermometers SWOT Analysis 210
12.16.6 PCE Instruments Recent Developments 210
12.17 Contec Medical Systems 211
12.17.1 Contec Medical Systems Company Information 211
12.17.2 Contec Medical Systems Overview 211
12.17.3 Contec Medical Systems Portable Non-Contact Infrared Thermometers Sales Quantity, Revenue, Price and Gross Margin (2018-2023) 212
12.17.4 Contec Medical Systems Portable Non-Contact Infrared Thermometers Products and Services 212
12.17.5 Contec Medical Systems Portable Non-Contact Infrared Thermometers SWOT Analysis 213
12.17.6 Contec Medical Systems Recent Developments 214
12.18 Toshniwal Industries 214
12.18.1 Toshniwal Industries Company Information 214
12.18.2 Toshniwal Industries Overview 215
12.18.3 Toshniwal Industries Portable Non-Contact Infrared Thermometers Sales Quantity, Revenue, Price and Gross Margin (2018-2023) 216
12.18.4 Toshniwal Industries Portable Non-Contact Infrared Thermometers Products and Services 216
12.18.5 Toshniwal Industries Portable Non-Contact Infrared Thermometers SWOT Analysis 218
12.18.6 Toshniwal Industries Recent Developments 219
13 Value Chain and Sales Channels Analysis 220
13.1 Portable Non-Contact Infrared Thermometers Value Chain Analysis 220
13.2 Portable Non-Contact Infrared Thermometers Key Raw Materials 220
13.2.1 Key Raw Materials 221
13.2.2 Raw Materials Key Suppliers 221
13.3 Portable Non-Contact Infrared Thermometers Production Mode & Process 222
13.4 Portable Non-Contact Infrared Thermometers Sales and Marketing 224
13.4.1 Portable Non-Contact Infrared Thermometers Sales Channels 224
13.4.2 Portable Non-Contact Infrared Thermometers Distributors 224
13.5 Portable Non-Contact Infrared Thermometers Customers 225
14 Portable Non-Contact Infrared Thermometers Market Dynamics 226
14.1 Portable Non-Contact Infrared Thermometers Industry Trends 226
14.2 Portable Non-Contact Infrared Thermometers Market Drivers 227
14.3 Portable Non-Contact Infrared Thermometers Market Challenges 227
14.4 Portable Non-Contact Infrared Thermometers Market Restraints 228
15 Key Findings 229
16 Appendix 231
16.1 Research Methodology 231
16.1.1 Methodology/Research Approach 231
16.1.2 Data Source 235
16.2 Author Details 238
16.3 Disclaimer 241
Contact US
QY RESEARCH, INC.
17890 CASTLETON STREET
SUITE 369, CITY OF INDUSTRY
CA - 91748, UNITED STATES OF AMERICA
+1 626 539 9760 / +91 8669986909
ankit@qyresearch.com / enquiry@qyresearch.com
About Us:
QY Research established in 2007, focus on custom research, management consulting, IPO consulting, industry chain research, data base and seminar services. The company owned a large basic data base (such as National Bureau of statistics database, Customs import and export database, Industry Association Database etc), expert's resources (included energy automotive chemical medical ICT consumer goods etc.
This release was published on openPR.
Permanent link to this press release:
Copy
Please set a link in the press area of your homepage to this press release on openPR. openPR disclaims liability for any content contained in this release.
You can edit or delete your press release Portable Non-Contact Infrared Thermometers Market Predicted to Grow With CAGR 10.54% During 2023-2029| Fluke, Microlife, Teledyne FLIR here
News-ID: 2931261 • Views: …
More Releases from QY Research, Inc.

Global Semiconductor Silicon Wafer Market to Reach US$ 29.08 Billion by 2032, Dr …
Market Summary -
The global Semiconductor Silicon Wafer market was valued at US$ 17,020 million in 2025 and is projected to reach US$ 29,080 million by 2032, growing at a CAGR of 8.1% during the forecast period 2026-2032.
According to QY Research, the newly released report titled "Global Semiconductor Silicon Wafer Market Insights - Industry Share, Sales Projections, and Demand Outlook 2026-2032" delivers a comprehensive, data-driven assessment of the global silicon wafer…

Global Water Desalination Equipment Market to Reach US$ 10.93 Billion by 2032, D …
Market Summary -
The global Water Desalination Equipment market was valued at US$ 7,215 million in 2025 and is projected to reach US$ 10,930 million by 2032, growing at a CAGR of 6.2% during the forecast period 2026-2032.
According to QY Research, the newly published report titled "Global Water Desalination Equipment Market Insights - Industry Share, Sales Projections, and Demand Outlook 2026-2032" provides a comprehensive, data-driven evaluation of the global desalination equipment…

Global Syndiotactic Polystyrene Market to Reach US$ 162 Million by 2032, Driven …
Market Summary -
The global Syndiotactic Polystyrene (SPS) market was valued at US$ 111 million in 2025 and is projected to reach US$ 162 million by 2032, expanding at a CAGR of 5.6% during the forecast period 2026-2032.
According to QY Research, the newly released report titled "Global Syndiotactic Polystyrene Market Insights - Industry Share, Sales Projections, and Demand Outlook 2026-2032" provides a comprehensive, data-driven assessment of the global SPS market. The…
Global Hydroxypropyl Methacrylate Market to Reach US$ 156 Million by 2032, Suppo …
Market Summary -
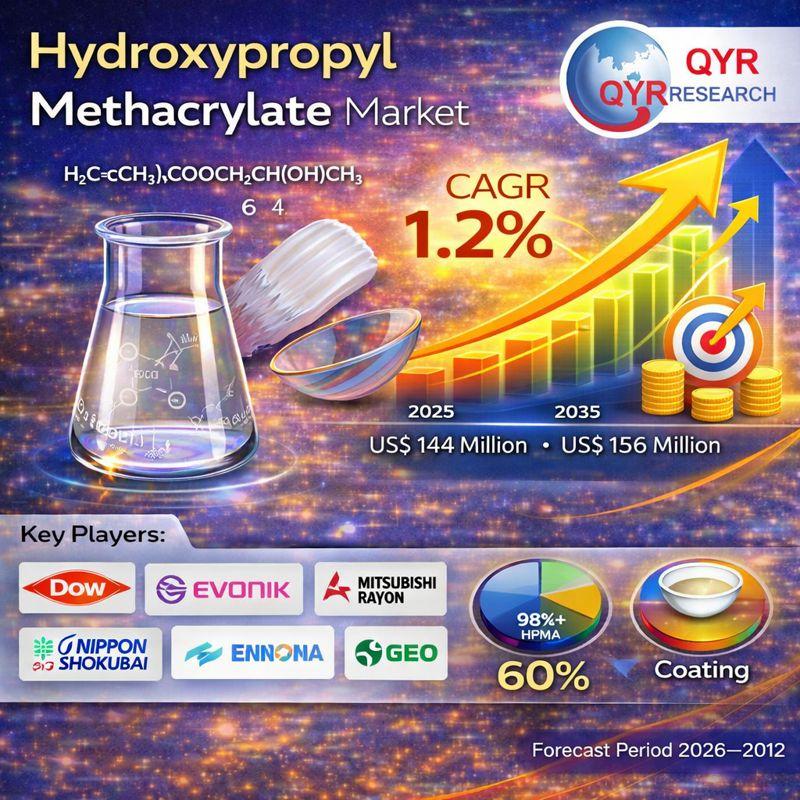
The global Hydroxypropyl Methacrylate (HPMA) market was valued at US$ 144 million in 2025 and is projected to reach US$ 156 million by 2032, expanding at a CAGR of 1.2% during the forecast period 2026-2032.
According to QY Research, the newly released report titled "Global Hydroxypropyl Methacrylate Market Insights - Industry Share, Sales Projections, and Demand Outlook 2026-2032" provides a comprehensive, data-driven evaluation of the global HPMA market.…
More Releases for Contact
Surging Demand For Cloud-Based Contact Centers Fuels Contact Center Software Mar …
Stay ahead with our updated market reports featuring the latest on tariffs, trade flows, and supply chain transformations.
Contact Centre Software Market Size Growth Forecast: What to Expect by 2025?
The market size of contact centre software has expanded swiftly in the past few years. It is projected to progress from $43.39 billion in 2024 to $51.19 billion in 2025, growing at a compound annual growth rate (CAGR) of 18.0%. The growth…
Xinzhe Metal: Elevator contact acceleration switch metal contact piece
Short Description:Elevator contact sheets are suitable for control panels of elevators, machinery, automobiles, medical equipment, electronics and other equipment due to their elastic recovery, conductivity, durability and stability.Material: aluminum, copper, etc.
Image: https://www.abnewswire.com/uploads/5241f0a41f3cb10df8022c5706ad2b4d.png
Advantages
1. More than 10 years of overseas trade expertise.
2. Provide one-stop service from mold design to product delivery.
3. Fast delivery time, about 25-40 days.
4. Strict quality management and process control (ISO 9001 certified manufacturer and factory).
5. Factory direct supply,…
Xinzhe Metal: Elevator leveling flat contact switch metal contact piece
The metal contact of the elevator switch is a vital part of the switch assembly. Through high-quality materials and precision processing technology, the contact piece can provide stable and reliable performance in various applications.
Image: https://www.abnewswire.com/uploads/b24c88661311c93e15b6aa7f1a2bdc02.png
Advantages
1. More than 10 years of overseas trade expertise.
2. Provide one-stop service from mold design to product delivery.
3. Fast delivery time, about 25-40 days.
4. Strict quality management and process control (ISO 9001 certified manufacturer and factory).
5.…
Michigan Contact Lens Offers Extremely Affordable Contact Lenses To US Consumers
Michigan Contact Lens, a leading specialty contact lens practice, is pleased to announce the addition of all its contact lenses to its website, michigancontactlens.com. This move allows customers to take advantage of wholesale prices on a wide range of contact lenses, revolutionizing the contact lens market in Michigan.
As a service-first practice, Michigan Contact Lens is committed to providing exceptional customer service and ensuring the best vision care for its patients.…
Streamlining Contact Data: The Success of Bulk Merge for Duplicate Contact Manag …
• Overview:
• An international nonprofit organization faced a challenge with a database containing 3,569,188 contacts, of which 33,742 were duplicates.
• The Organization's Problem:
• The nonprofit needed an efficient way to remove duplicate contacts to enhance data integrity.
• Manual review of millions of contacts was impractical.
• The Organization's Decision:
• The nonprofit consulted Astreca's experts.
• They implemented the Bulk Merge app, which used advanced algorithms to detect and flag duplicates for removal.
• Data technicians reviewed flagged entries before deletion.
To know more@https://astreca.com/case-studies/bulk-merge-contact-integrity/
• Business…
Global Corrective Contact Lens Market Analysis Forecast 2022-2028 Global Industr …
The Corrective Contact Lens Market research report offers key values on the state of the industries. The study involved research on landscape-specific skill as well as detailed information on each section. The Corrective Contact Lens research report highlights inner and outer examination of the current worldwide Corrective Contact Lens market. This Corrective Contact Lens market report includes major competitors and players involved in the market. The classification also involves the…
