Press release
WHAT ARE THE TRANSPORTATION KPIS ONE SHOULD BE TRACKING ON THE FLEET DASHBOARD?
Public transportation officials and operators are always busy providing service, and seldom able to find time to take a close look at their service performance unless there are budgeting problems or reports show glaring issues.As the saying goes 'a stitch in time saves nine,' it is prudent for the leadership of public transportation agencies to monitor key metrics on a regular basis that can help them avoid bigger issues later on. The same metrics also help them understand strengths and weaknesses in their operations in order to set up plans for mitigating or encouraging improved business functions. The areas of high interest are: 1) driver productivity 2) vehicle utilization 3) management/staff productivity and most importantly 4) customer satisfaction.
Key performance indicators (KPI) for public transportation agencies involve, among other things, route planning and scheduling. While there is no hard and fast rule that you should consider in choosing certain metrics over others, each agency prioritizes their metrics based on certain uniqueness they bring to the region. What matters to one routing agency may not matter to another. To dive deeper in this topic, one should zero in on the metrics that matter the most to their organization, these are the metrics that you will act upon. Avoid tracking every metric including the ones that don't have much impact on operations - data gathering becomes a tedious operation and will lead to non-collection of data.
We don't claim to know what the exact metrics are for your fleet dashboard as each agency is unique. However, we can offer critical guidance based on our experience in the industry and by evaluating the metrics used by 200+ agencies and hundreds of private operators that use QRyde's Transportation scheduling software. We have built hundreds of KPI dashboards and we understand the transformative power of metrics to help drive clinical optimization in cost and service level.
Why should one measure metrics?
How can fleet KPIs drive meaningful business results? The key metrics you are measuring on your transportation dashboard are based on real-time performance data and one can easily identify the negatives and positives happening in each business function. For transportation fleets that operate in advance booking mode, they have to plan and schedule routes and for those agencies, there are opportunities to reduce cost between 15-20%. Looking annually, these numbers can help you optimize your operations and plug gaps in your operations - helping you increase efficiencies on an annual basis.
KPI indicators may not help in cost saving directly however, these numbers tell you a story of what you are doing right and what you are going wrong. Each transportation agency that does scheduling and routing, measures different metrics ranging from safety, compliance and service, but cost saving is the fundamental metric that you should start measuring.
222/7 Gurugram, India.
prarthna.suri@hbssweb.com
QRyde's transportation software is designed to streamline your agency's logistic needs. QRyde provides a singular platform from which you can access all the transportation verticals. Our primary objective is to make the whole operation smooth. Gain real time insights and adapt on the go by optimizing your routes and schedules, making informed decisions and simplifying the overall process.
This release was published on openPR.
Permanent link to this press release:
Copy
Please set a link in the press area of your homepage to this press release on openPR. openPR disclaims liability for any content contained in this release.
You can edit or delete your press release WHAT ARE THE TRANSPORTATION KPIS ONE SHOULD BE TRACKING ON THE FLEET DASHBOARD? here
News-ID: 2672091 • Views: …
More Releases from Qryde by hbss
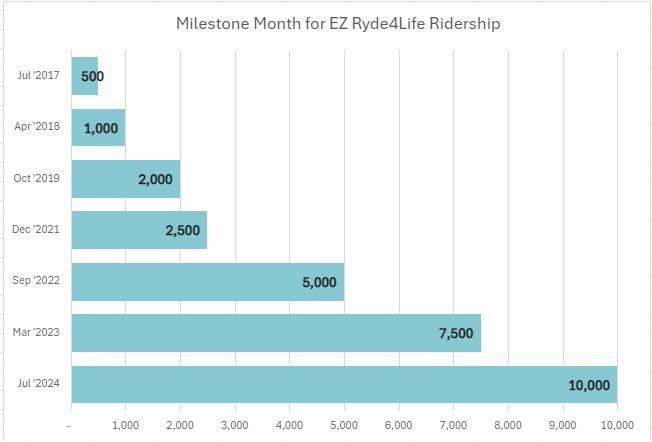
EZ Ryde4Life Program Hits Major Milestone: Over 10,000 Rides in July!
On July 26, 2024, the EZ Ryde4Life program celebrated an extraordinary achievement-surpassing 10,000 rides in a single month, with several days remaining! Since its inception in 2018, when we provided just 10,000 rides, the program has grown tenfold, delivering over 100,000 rides in 2024 alone.
In New Jersey, all 21 counties and numerous municipalities offer free transportation for seniors and disabled residents. However, due to limited government resources, the EZ Ryde4Life…
More Releases for KPI
KPI Dashboards as a Service
Introduction: What is a KPI Dashboard as a Service and How Does it Actually Work?
A KPI Dashboard as a Service is a marketing dashboard that provides marketers with the ability to track and measure their marketing efforts. It is an analytics software that helps marketers to understand how their marketing campaigns are performing.
The KPI Dashboard as a Service is an analytics software that helps marketers to understand how their marketing…
KPi-Tech Scales Up in Healthcare IT Services
: KPi-Tech Services Pvt Ltd, an IT services company has introduced a new range of IT services for the Healthcare domain. KPi-Tech will provide highly interoperable custom-made software services for the following:
1. EHR/EMR
2. HIS
3. PMS
4. DICOM/PACS
With mission to empower Providers, Clinicians and Consumers KPi-Tech will also provide integration services to boost Interoperability in healthcare as follows:
1. Health Information Exchange Software Solutions
2. HL7 Integration services
3. FHIR Integration Solutions
4. Mirth Integrations Solutions
Of the company’s recent launch, KPi-Tech’s CEO Kishore…
Autologica launches KPI Dashboard app to monitor dealership performance
Autologica S.A., the innovative software provider for vehicle and equipment dealers, launched its KPI Dashboard application that managers can use to quickly monitor key performance indicators for each department in the dealership.
The app can be used on iOS and Android devices, and shows KPIs as well as charts with various filtering criteria. Key information displayed by the KPI Dashboard includes:
- Parts sales KPIs
- Vehicle sales KPIs
- Service Department KPIs
- Management…
KPI Software Market: Maintaining a Strong Outlook – Here’s Why
Detailed research added by Ample Market Research offering a comprehensive analysis of the developments, growth outlook, driving factors, and key players of the KPI Software market in the latest research report. The research study concisely dissects the KPI Software and unearths valuable estimations pertaining to the profit projections, market size, sales capacity, and numerous other crucial parameters. Also, the KPI Software Market report appraises the industry fragments as well as…
Global KPI Software Market Growth (Status and Outlook) 2019-2024
Market Research Report Store offers a latest published report on KPI Software Market Analysis and Forecast 2019-2025 delivering key insights and providing a competitive advantage to clients through a detailed report. The report contains 158 pages which highly exhibit on current market analysis scenario, upcoming as well as future opportunities, revenue growth, pricing and profitability.
Click to view the full report TOC, figure and tables:
https://www.marketresearchreportstore.com/reports/806787/global-kpi-software-market-status-outlook
According to this study, over the next…
