Press release
AR Waveguide Market Trends and Forecast Report 2022 | By Players, Types, Applications and Regions
QY Research released a latest market research report on the global and United States AR Waveguide market, which is segmented by region (country), players, by Type and by Application. Players, stakeholders, and other participants in the global AR Waveguide market will be able to gain the upper hand as they use the report as a powerful resource. The segmental analysis focuses on revenue and forecast by region, by Type and by Application for the period 2017-2028.This report focuses on global and United States AR Waveguide market, also covers the segmentation data of other regions in regional level and county level.
Global core AR waveguide manufacturers include Microsoft (Hololens), LX-AR and Optics Division etc. The top 3 companies hold a share about 55%. Asia Pacific is the largest market, with a share about 40%, followed by Americas and Europe with the share about 37% and 20%.In terms of product, FOV 40°is the largest segment, with a share over 35%. And in terms of application, the largest application is games and entertainment, followed by industrial.
For United States market, this report focuses on the AR Waveguide market size by players, by Type and by Application, for the period 2017-2028. The key players include the global and local players, which play important roles in United States.
For More Information About This Report, Please Enter:
https://us.qyresearch.com/reports/164460/ar-waveguide
AR Waveguide Market Segment by Type
FOV Below 30°
FOV 40°
Others
AR Waveguide Market Segment by Application
Games and Entertainment
Industrial
Military
Others
The report on the AR Waveguide market covers the following region analysis:
North America
Europe
Asia-Pacific
Latin America
Middle East & Africa
The report mentions the prominent market player consisting of:
Microsoft (Hololens)
LX-AR
Lumus
Optinvent
Optics Division (LCE)
North Ocean Photonics
Vuzix
Crystal Optech
Lochn Optics
Holoptics(Luminit)
The Goal of the Report
To study and analyze the global AR Waveguide consumption (value & volume) by key regions/countries, type and application, history data from 2017 to 2022, and forecast to 2028.
To understand the structure of AR Waveguide market by identifying its various subsegments.
Focuses on the key global AR Waveguide manufacturers, to define, describe and analyze the sales volume, value, market share, market competition landscape, SWOT analysis and development plans in next few years.
To analyze the AR Waveguide with respect to individual growth trends, prospects, and their contribution to the total market.
To share detailed information about the key factors influencing the growth of the market (growth potential, opportunities, drivers, industry-specific challenges, and risks).
To project the consumption of AR Waveguide submarkets, with respect to key regions (along with their respective key countries).
To analyze competitive developments such as expansions, agreements, new product launches, and acquisitions in the market.
To strategically profile the key players and comprehensively analyze their growth strategies.
Target Audience
> AR Waveguide companies
> Research organizations
> Government Organizations
> Research/Consultancy firms
Table of Contents
1 Study Coverage
1.1 AR Waveguide Product Introduction
1.2 Global AR Waveguide Outlook 2017 VS 2022 VS 2028
1.2.1 Global AR Waveguide Sales in US$ Million for the Year 2017-2028
1.2.2 Global AR Waveguide Sales in Volume for the Year 2017-2028
1.3 United States AR Waveguide Outlook 2017 VS 2022 VS 2028
1.3.1 United States AR Waveguide Sales in US$ Million for the Year 2017-2028
1.3.2 United States AR Waveguide Sales in Volume for the Year 2017-2028
1.4 AR Waveguide Market Size, United States VS Global, 2017 VS 2022 VS 2028
1.4.1 The Market Share of United States AR Waveguide in Global, 2017 VS 2022 VS 2028
1.4.2 The Growth Rate of AR Waveguide Market Size, United States VS Global, 2017 VS 2022 VS 2028
1.5 AR Waveguide Market Dynamics
1.5.1 AR Waveguide Industry Trends
1.5.2 AR Waveguide Market Drivers
1.5.3 AR Waveguide Market Challenges
1.5.4 AR Waveguide Market Restraints
1.6 Study Objectives
1.7 Years Considered
2 Market by Type
2.1 AR Waveguide Market Segment by Type
2.1.1 FOV Below 30°
2.1.2 FOV 40°
2.1.3 Others
2.2 Global AR Waveguide Market Size by Type
2.2.1 Global AR Waveguide Sales in Value, by Type (2017, 2022 & 2028)
2.2.2 Global AR Waveguide Sales in Volume, by Type (2017, 2022 & 2028)
2.2.3 Global AR Waveguide Average Selling Price (ASP) by Type (2017, 2022 & 2028)
2.3 United States AR Waveguide Market Size by Type
2.3.1 United States AR Waveguide Sales in Value, by Type (2017, 2022 & 2028)
2.3.2 United States AR Waveguide Sales in Volume, by Type (2017, 2022 & 2028)
2.3.3 United States AR Waveguide Average Selling Price (ASP) by Type (2017, 2022 & 2028)
3 Market by Application
3.1 AR Waveguide Market Segment by Application
3.1.1 Games and Entertainment
3.1.2 Industrial
3.1.3 Military
3.1.4 Others
3.2 Global AR Waveguide Market Size by Application
3.2.1 Global AR Waveguide Sales in Value, by Application (2017, 2022 & 2028)
3.2.2 Global AR Waveguide Sales in Volume, by Application (2017, 2022 & 2028)
3.3.3 Global AR Waveguide Average Selling Price (ASP) by Application (2017, 2022 & 2028)
3.3 United States AR Waveguide Market Size by Application
3.3.1 United States AR Waveguide Sales in Value, by Application (2017, 2022 & 2028)
3.3.2 United States AR Waveguide Sales in Volume, by Application (2017, 2022 & 2028)
3.3.3 United States AR Waveguide Average Selling Price (ASP) by Application (2017, 2022 & 2028)
4 Global AR Waveguide Competitor Landscape by Company
4.1 Global AR Waveguide Market Size by Company
4.1.1 Top Global AR Waveguide Manufacturers Ranked by Revenue (2021)
4.1.2 Global AR Waveguide Revenue by Manufacturer (2017-2022)
4.1.3 Global AR Waveguide Sales by Manufacturer (2017-2022)
4.1.4 Global AR Waveguide Price by Manufacturer (2017-2022)
4.2 Global AR Waveguide Concentration Ratio (CR)
4.2.1 AR Waveguide Market Concentration Ratio (CR) (2017-2022)
4.2.2 Global Top 5 and Top 10 Largest Manufacturers of AR Waveguide in 2021
4.2.3 Global AR Waveguide Market Share by Company Type (Tier 1, Tier 2, and Tier 3)
4.3 Global AR Waveguide Manufacturing Base Distribution, Product Type
4.3.1 Global AR Waveguide Manufacturers, Headquarters and Distribution of Producing Region
4.3.2 Manufacturers AR Waveguide Product Type
4.3.3 Date of International Manufacturers Enter into AR Waveguide Market
4.4 Manufacturers Mergers & Acquisitions, Expansion Plans
4.5 United States AR Waveguide Market Size by Company
4.5.1 Top AR Waveguide Players in United States, Ranked by Revenue (2021)
4.5.2 United States AR Waveguide Revenue by Players (2020, 2021 & 2022)
4.5.3 United States AR Waveguide Sales by Players (2020, 2021 & 2022)
5 Global AR Waveguide Market Size by Region
5.1 Global AR Waveguide Market Size by Region: 2017 VS 2022 VS 2028
5.2 Global AR Waveguide Market Size in Volume by Region (2017-2028)
5.2.1 Global AR Waveguide Sales in Volume by Region: 2017-2022
5.2.2 Global AR Waveguide Sales in Volume Forecast by Region (2023-2028)
5.3 Global AR Waveguide Market Size in Value by Region (2017-2028)
5.3.1 Global AR Waveguide Sales in Value by Region: 2017-2022
5.3.2 Global AR Waveguide Sales in Value by Region: 2023-2028
6 Segment in Region Level & Country Level
6.1 North America
6.1.1 North America AR Waveguide Market Size YoY Growth 2017-2028
6.1.2 North America AR Waveguide Market Facts & Figures by Country (2017, 2022 & 2028)
6.1.3 United States
6.1.4 Canada
6.2 Asia-Pacific
6.2.1 Asia-Pacific AR Waveguide Market Size YoY Growth 2017-2028
6.2.2 Asia-Pacific AR Waveguide Market Facts & Figures by Region (2017, 2022 & 2028)
6.2.3 China
6.2.4 Japan
6.2.5 South Korea
6.2.6 India
6.2.7 Australia
6.2.8 China Taiwan
6.2.9 Indonesia
6.2.10 Thailand
6.2.11 Malaysia
6.3 Europe
6.3.1 Europe AR Waveguide Market Size YoY Growth 2017-2028
6.3.2 Europe AR Waveguide Market Facts & Figures by Country (2017, 2022 & 2028)
6.3.3 Germany
6.3.4 France
6.3.5 U.K.
6.3.6 Italy
6.3.7 Russia
6.4 Latin America
6.4.1 Latin America AR Waveguide Market Size YoY Growth 2017-2028
6.4.2 Latin America AR Waveguide Market Facts & Figures by Country (2017, 2022 & 2028)
6.4.3 Mexico
6.4.4 Brazil
6.4.5 Argentina
6.5 Middle East and Africa
6.5.1 Middle East and Africa AR Waveguide Market Size YoY Growth 2017-2028
6.5.2 Middle East and Africa AR Waveguide Market Facts & Figures by Country (2017, 2022 & 2028)
6.5.3 Turkey
6.5.4 Saudi Arabia
6.5.5 UAE
7 Company Profiles
7.1 Microsoft (Hololens)
7.1.1 Microsoft (Hololens) Corporation Information
7.1.2 Microsoft (Hololens) Description and Business Overview
7.1.3 Microsoft (Hololens) AR Waveguide Sales, Revenue and Gross Margin (2017-2022)
7.1.4 Microsoft (Hololens) AR Waveguide Products Offered
7.1.5 Microsoft (Hololens) Recent Development
7.2 LX-AR
7.2.1 LX-AR Corporation Information
7.2.2 LX-AR Description and Business Overview
7.2.3 LX-AR AR Waveguide Sales, Revenue and Gross Margin (2017-2022)
7.2.4 LX-AR AR Waveguide Products Offered
7.2.5 LX-AR Recent Development
7.3 Lumus
7.3.1 Lumus Corporation Information
7.3.2 Lumus Description and Business Overview
7.3.3 Lumus AR Waveguide Sales, Revenue and Gross Margin (2017-2022)
7.3.4 Lumus AR Waveguide Products Offered
7.3.5 Lumus Recent Development
7.4 Optinvent
7.4.1 Optinvent Corporation Information
7.4.2 Optinvent Description and Business Overview
7.4.3 Optinvent AR Waveguide Sales, Revenue and Gross Margin (2017-2022)
7.4.4 Optinvent AR Waveguide Products Offered
7.4.5 Optinvent Recent Development
7.5 Optics Division (LCE)
7.5.1 Optics Division (LCE) Corporation Information
7.5.2 Optics Division (LCE) Description and Business Overview
7.5.3 Optics Division (LCE) AR Waveguide Sales, Revenue and Gross Margin (2017-2022)
7.5.4 Optics Division (LCE) AR Waveguide Products Offered
7.5.5 Optics Division (LCE) Recent Development
7.6 North Ocean Photonics
7.6.1 North Ocean Photonics Corporation Information
7.6.2 North Ocean Photonics Description and Business Overview
7.6.3 North Ocean Photonics AR Waveguide Sales, Revenue and Gross Margin (2017-2022)
7.6.4 North Ocean Photonics AR Waveguide Products Offered
7.6.5 North Ocean Photonics Recent Development
7.7 Vuzix
7.7.1 Vuzix Corporation Information
7.7.2 Vuzix Description and Business Overview
7.7.3 Vuzix AR Waveguide Sales, Revenue and Gross Margin (2017-2022)
7.7.4 Vuzix AR Waveguide Products Offered
7.7.5 Vuzix Recent Development
7.8 Crystal Optech
7.8.1 Crystal Optech Corporation Information
7.8.2 Crystal Optech Description and Business Overview
7.8.3 Crystal Optech AR Waveguide Sales, Revenue and Gross Margin (2017-2022)
7.8.4 Crystal Optech AR Waveguide Products Offered
7.8.5 Crystal Optech Recent Development
7.9 Lochn Optics
7.9.1 Lochn Optics Corporation Information
7.9.2 Lochn Optics Description and Business Overview
7.9.3 Lochn Optics AR Waveguide Sales, Revenue and Gross Margin (2017-2022)
7.9.4 Lochn Optics AR Waveguide Products Offered
7.9.5 Lochn Optics Recent Development
7.10 Holoptics(Luminit)
7.10.1 Holoptics(Luminit) Corporation Information
7.10.2 Holoptics(Luminit) Description and Business Overview
7.10.3 Holoptics(Luminit) AR Waveguide Sales, Revenue and Gross Margin (2017-2022)
7.10.4 Holoptics(Luminit) AR Waveguide Products Offered
7.10.5 Holoptics(Luminit) Recent Development
8 Industry Chain and Sales Channels Analysis
8.1 AR Waveguide Industry Chain Analysis
8.2 AR Waveguide Key Raw Materials
8.2.1 Key Raw Materials
8.2.2 AR Waveguide Distributors
8.3 AR Waveguide Production Mode & Process
8.4 AR Waveguide Sales and Marketing
8.4.1 AR Waveguide Sales Channels
8.4.2 AR Waveguide Distributors
8.5 AR Waveguide Customers
9 Research Findings and Conclusion
10 Appendix
10.1 Research Methodology
10.1.1 Methodology/Research Approach
10.1.2 Data Source
10.2 Author Details
10.3 Disclaimer
Access full Report Description, Table of Figure, Chart, FREE sample, etc. please click
https://us.qyresearch.com/reports/164460/ar-waveguide
Any doubts and questions will be welcome.
Customization of the Report:
This report can be customized to meet the client's requirements. Please contact with us (global@qyresearch.com), who will ensure that you get a report that suits your needs.
About Us:
QYResearch founded in California, USA in 2007. It is a leading global market research and consulting company. With over 15 years' experience and professional research team in various cities over the world, QY Research focuses on management consulting, database and seminar services, IPO consulting, industry chain research and customized research to help our clients in providing non-linear revenue model and make them successful. We are globally recognized for our expansive portfolio of services, good corporate citizenship, and our strong commitment to sustainability. Up to now, we have cooperated with more than 59,000 clients across five continents. Let's work closely with you and build a bold and better future.
Contact Us
QY Research
E-mail: global@qyresearch.com
Tel: +1-626-842-1666(US) +852-5808-0956 (HK)
Add: 17890 Castleton Street Suite 369 City of Industry CA 91748 United States
Website: https://us.qyresearch.com
This report focuses on global and United States AR Waveguide market, also covers the segmentation data of other regions in regional level and county level.
Global core AR waveguide manufacturers include Microsoft (Hololens), LX-AR and Optics Division etc. The top 3 companies hold a share about 55%. Asia Pacific is the largest market, with a share about 40%, followed by Americas and Europe with the share about 37% and 20%.In terms of product, FOV 40°is the largest segment, with a share over 35%. And in terms of application, the largest application is games and entertainment, followed by industrial.
QYResearch founded in California, USA in 2007. It is a leading global market research and consulting company. With over 15 years' experience and professional research team in various cities over the world, QY Research focuses on management consulting, database and seminar services, IPO consulting, industry chain research and customized research to help our clients in providing non-linear revenue model and make them successful. We are globally recognized for our expansive portfolio of services, good corporate citizenship, and our strong commitment to sustainability. Up to now, we have cooperated with more than 59,000 clients across five continents. Let's work closely with you and build a bold and better future.
This release was published on openPR.
Permanent link to this press release:
Copy
Please set a link in the press area of your homepage to this press release on openPR. openPR disclaims liability for any content contained in this release.
You can edit or delete your press release AR Waveguide Market Trends and Forecast Report 2022 | By Players, Types, Applications and Regions here
News-ID: 2620280 • Views: …
More Releases from QY Research
Top 30 Indonesian Dairy Public Companies Q3 2025 Revenue & Performance
1) Overall companies performance (Q3 2025 snapshot)
PT Indofood Sukses Makmur Tbk (INDF)
PT Indofood CBP Sukses Makmur Tbk (ICBP)
PT Ultrajaya Milk Industry & Trading Company Tbk (ULTJ)
PT Cisarua Mountain Dairy Tbk (CMRY)
PT Diamond Food Indonesia Tbk (DMND)
PT Mulya Boga Raya Tbk
PT Campina Ice Cream Industry Tbk
PT Kurniamitra Duta Sentosa Tbk
PT Greenfields Indonesia
PT Indolakto (subsidiary/brand under Indofood)
PT Ultra Jaya Frozen Foods (group affiliate)
PT Heilala Dairy Indonesia (export arm/processing)
PT Diamond Milk Products (non-listed…
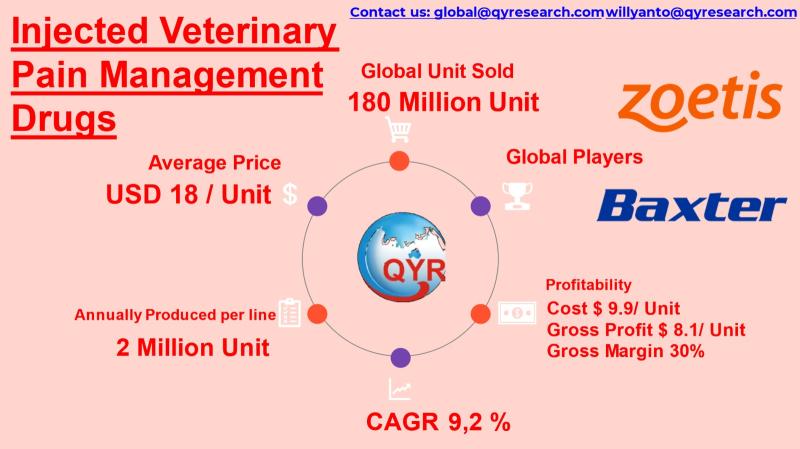
High-Margin Growth: Inside the Global Injectable Veterinary Analgesics Boom
Injected veterinary pain management drugs are parenteral analgesics and anti-inflammatory therapeutics administered via IV, IM, or SC routes for rapid pain control in livestock and companion animals.
Used widely in Surgical recovery, Trauma and orthopedic treatment, Mastitis and inflammatory disease, Post vaccination pain mitigation and Companion animal chronic pain (arthritis, cancer).
Drug classes include NSAIDs, Opioids, Alpha-2 agonists, Local anesthetics and Multimodal combination injectables
Demand growth driven by rising pet humanization, expansion of…
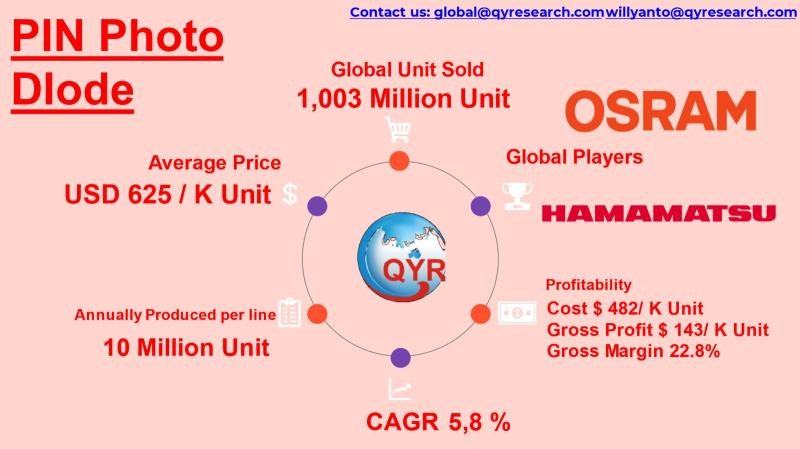
From Fiber to LiDAR: Why PIN Photodiodes Are the Silent Engine of Optical Tech
PIN photodiodes are semiconductor light sensors that convert photons into electrical current using a P-Intrinsic-N structure for higher sensitivity, faster response time, and lower capacitance than PN devices.
Core components in optical communications, LiDAR, medical imaging, industrial automation, consumer electronics, and scientific instrumentation.
Manufacturing concentrated in Japan, China, Taiwan, South Korea, with backend packaging in ASEAN.
Demand growth is tied to Fiber optic network expansion, Autonomous driving sensors, Industrial machine vision, Wearables and…
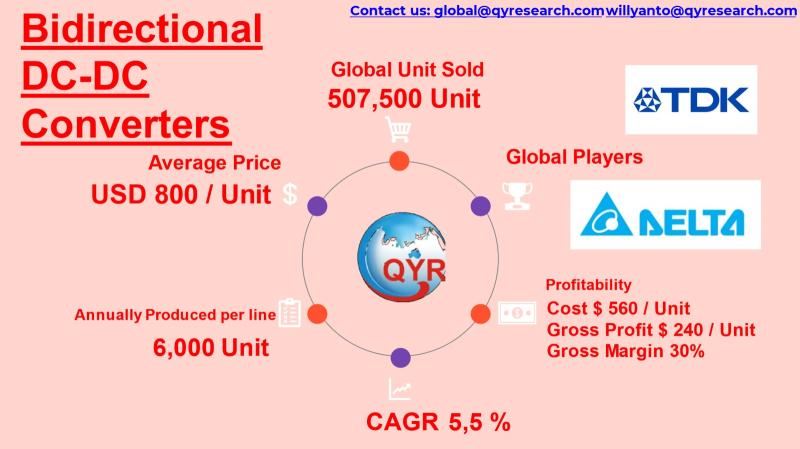
Bidirectional DC-DC Converter Market 2025: Asia Leads as EV & Storage Demand Sur …
The global Bidirectional DC-DC Converter market is expanding rapidly as electrification, renewable energy storage, and vehicle electrification accelerate worldwide.
These converters enable two-way power flow, allowing energy transfer between batteries, supercapacitors, DC buses, and loads, making them critical for EVs, battery energy storage systems (BESS), UPS, telecom power systems, and microgrids.
Increasing demand for high-efficiency power management, fast charging, and distributed energy systems is driving industrial adoption across Asia and Southeast Asia…
More Releases for Waveguide
Waveguide port - flange size comparison table
The relationship between waveguide port dimensions, flange [https://www.leader-mw.com/rf-integrated-load-dc-18ghz-with-tab-mount-20w-power-product/] sizes, and frequency bands is standardized to ensure mechanical compatibility and optimal RF performance. Below is a simplified comparison table and key principles for common rectangular waveguides and their associated flanges.
Key Concepts
1. Waveguide Designation: Waveguides are labeled with "WR" (Waveguide Rectangular) followed by a number (e.g., WR-90). The number approximates the inner broad-wall dimension in hundredths of an inch (e.g., WR-90 almost…
Optical Waveguide Market Research Report
Global Info Research announces the release of the report "Global Optical Waveguide Market 2025 by Manufacturers, Regions, Type and Application, Forecast to 2031" . The report is a detailed and comprehensive analysis presented by region and country, type and application. As the market is constantly changing, the report explores the competition, supply and demand trends, as well as key factors that contribute to its changing demands across many markets. Company…
Driving Waveguide Market Growth in 2025: The Role of Surge In Satellite Launches …
Stay ahead with our updated market reports featuring the latest on tariffs, trade flows, and supply chain transformations.
Waveguide Market Size Growth Forecast: What to Expect by 2025?
The waveguide market size has grown strongly in recent years. It will grow from $1.45 billion in 2024 to $1.55 billion in 2025 at a compound annual growth rate (CAGR) of 6.7%. The growth in the historic period can be attributed to increasing demand…
Waveguide Circulators Market Report 2025
Global Info Research announces the release of the report "Global Waveguide Circulators Market 2025 by Manufacturers, Regions, Type and Application, Forecast to 2031". This report provides a detailed overview of the Waveguide Circulators market scenario, including a thorough analysis of the Waveguide Circulators market size, sales quantity, average price, revenue, gross margin and market share.The Waveguide Circulators report provides an in-depth analysis of the competitive landscape, manufacturer's profiles, regional and…
AR Geometric Waveguide Module Market
AR Geometric Waveguide Module Market Overview
Geometric waveguides, also known as reflective or refractive waveguides, guide light through a series of reflections and refractions. They rely on the principles of total internal reflection (TIR) within a medium to confine and direct light. Typically, these waveguides consist of materials with a high refractive index, such as glass or polymers, and use prism-like structures or lenses to couple light in and out of…
AR Waveguide - An In-depth Analysis
The AR waveguide market refers to a cutting-edge technology that has the potential to revolutionize the experience of using augmented reality (AR) in various business sectors. It refers to a transparent optical element that guides and projects virtual images onto the real world, enhancing the user's visual perception and providing a seamless AR experience.
Get Sample Brochure at https://www.theinsightpartners.com/sample/TIPRE00016956/?utm_source=Openpr&utm_medium=10396
AR waveguide has immense potential to transform numerous industries, including manufacturing, retail,…
