Press release
Global Industrial PEG-2000 Market Trends and Forecast Report 2022 | By Players, Applications and Regions
The QY Research released a latest market research report on the Global Industrial PEG-2000 market, which is segmented by region (country), company and by Application. Players, stakeholders, and other participants in the global Industrial PEG-2000 market will be able to gain the upper hand as they use the report as a powerful resource. The segmental analysis focuses on sales, revenue and forecast by region (country) and by Application of Global Industrial PEG-2000 market.Summary
Due to the COVID-19 pandemic, the global Industrial PEG-2000 market size is estimated to be worth US$ 122.46 million in 2022 and is forecast to a readjusted size of US$ 176.23 million by 2028 with a CAGR of 6.25% during the forecast period 2022-2028.
The global major manufacturers of Industrial PEG-2000 include Dow, Ineos, KAO, Blaunon, Liaoning Oxiranchem, Jiangsu Haian, Clariant, PCC SE, and Norchem, etc. In terms of revenue, the global five largest players hold a 31.55% market share of Industrial PEG-2000 in 2021.
For More Information About This Report, Please Enter:
https://us.qyresearch.com/reports/350870/industrial-peg-2000
The report mentions the prominent market player consisting of:
Dow
Ineos
KAO
Blaunon
Liaoning Oxiranchem
Jiangsu Haian
Clariant
PCC SE
Norchem
Oxiteno
Lotte Chemical
Sanyo Chemical
India Glycols
Sasol
Liaoning Huaxing
Industrial PEG-2000 Market Segment by Application
Metal Processing
Paper Industry
Spandex
Others
The report on the Industrial PEG-2000 market covers the following region (country) analysis:
Production by Region
North America
Europe
China
Japan
Consumption by Region
North America
U.S.
Canada
Asia-Pacific
China
Japan
South Korea
Southeast Asia
India
Australia
Europe
Germany
France
U.K.
Italy
Russia
Rest of Europe
South America
Mexico
Brazil
Rest of South America
The Goal of the Report
To study and analyze the global Industrial PEG-2000consumption (value & volume) by key regions/countries, type and application, history data from 2017 to 2022, and forecast to 2028.
To understand the structure of Industrial PEG-2000market by identifying its various subsegments.
Focuses on the key global Industrial PEG-2000manufacturers, to define, describe and analyze the sales volume, value, market share, market competition landscape, SWOT analysis and development plans in next few years.
To analyze the Industrial PEG-2000with respect to individual growth trends, prospects, and their contribution to the total market.
To share detailed information about the key factors influencing the growth of the market (growth potential, opportunities, drivers, industry-specific challenges, and risks).
To project the consumption of Industrial PEG-2000submarkets, with respect to key regions (along with their respective key countries).
To analyze competitive developments such as expansions, agreements, new product launches, and acquisitions in the market.
To strategically profile the key players and comprehensively analyze their growth strategies.
Target Audience
> Industrial PEG-2000 companies
> Research organizations
> Government Organizations
> Research/Consultancy firms
Table of Contents
1 INDUSTRIAL PEG-2000 MARKET OVERVIEW 1
1.1 PRODUCT OVERVIEW AND SCOPE OF INDUSTRIAL PEG-2000 1
1.2 INDUSTRIAL PEG-2000 SEGMENT BY APPLICATION 1
1.2.1 GLOBAL INDUSTRIAL PEG-2000 MARKET SIZE GROWTH RATE ANALYSIS BY APPLICATION: 2022 VS 2028 2
1.2.2 METAL PROCESSING 3
1.2.3 PAPER INDUSTRY 3
1.2.4 SPANDEX 3
1.2.5 OTHERS 4
1.3 GLOBAL MARKET GROWTH PROSPECTS 4
1.3.1 GLOBAL INDUSTRIAL PEG-2000 REVENUE ESTIMATES AND FORECASTS (2017-2028) 4
1.3.2 GLOBAL INDUSTRIAL PEG-2000 PRODUCTION CAPACITY ESTIMATES AND FORECASTS (2017-2028) 6
1.3.3 GLOBAL INDUSTRIAL PEG-2000 PRODUCTION ESTIMATES AND FORECASTS (2017-2028) 6
1.4 GLOBAL MARKET SIZE BY REGION 7
1.4.1 GLOBAL INDUSTRIAL PEG-2000 MARKET SIZE ESTIMATES AND FORECASTS BY REGION: 2017 VS 2022 VS 2028 8
1.4.2 NORTH AMERICA INDUSTRIAL PEG-2000 ESTIMATES AND FORECASTS (2017-2028) 8
1.4.3 EUROPE INDUSTRIAL PEG-2000 ESTIMATES AND FORECASTS (2017-2028) 9
1.4.4 CHINA INDUSTRIAL PEG-2000 ESTIMATES AND FORECASTS (2017-2028) 10
1.4.5 JAPAN INDUSTRIAL PEG-2000 ESTIMATES AND FORECASTS (2017-2028) 10
2 MARKET COMPETITION BY MANUFACTURERS 12
2.1 GLOBAL INDUSTRIAL PEG-2000 PRODUCTION CAPACITY MARKET SHARE BY MANUFACTURERS (2017-2022) 12
2.2 GLOBAL INDUSTRIAL PEG-2000 REVENUE MARKET SHARE BY MANUFACTURERS (2017-2022) 15
2.3 INDUSTRIAL PEG-2000 MARKET SHARE BY COMPANY TYPE (TIER 1, TIER 2, AND TIER 3) 17
2.4 GLOBAL INDUSTRIAL PEG-2000 AVERAGE PRICE BY MANUFACTURERS (2017-2022) 17
2.5 MANUFACTURERS INDUSTRIAL PEG-2000 PRODUCTION SITES, AREA SERVED, PRODUCT TYPE 18
2.6 INDUSTRIAL PEG-2000 MARKET COMPETITIVE SITUATION AND TRENDS 19
2.6.1 INDUSTRIAL PEG-2000 MARKET CONCENTRATION RATE 19
2.6.2 GLOBAL 5 AND 10 LARGEST INDUSTRIAL PEG-2000 PLAYERS MARKET SHARE BY REVENUE 20
2.6.3 MERGERS & ACQUISITIONS, EXPANSION 21
3 PRODUCTION CAPACITY BY REGION 22
3.1 GLOBAL PRODUCTION CAPACITY OF INDUSTRIAL PEG-2000 MARKET SHARE BY REGION (2017-2022) 22
3.2 GLOBAL INDUSTRIAL PEG-2000 REVENUE MARKET SHARE BY REGION (2017-2022) 23
3.3 GLOBAL INDUSTRIAL PEG-2000 PRODUCTION CAPACITY, REVENUE, PRICE AND GROSS MARGIN (2017-2022) 23
3.4 NORTH AMERICA INDUSTRIAL PEG-2000 PRODUCTION 24
3.4.1 NORTH AMERICA INDUSTRIAL PEG-2000 PRODUCTION GROWTH RATE (2017-2022) 24
3.4.2 NORTH AMERICA INDUSTRIAL PEG-2000 PRODUCTION CAPACITY, REVENUE, PRICE AND GROSS MARGIN (2017-2022) 24
3.5 EUROPE INDUSTRIAL PEG-2000 PRODUCTION 25
3.5.1 EUROPE INDUSTRIAL PEG-2000 PRODUCTION GROWTH RATE (2017-2022) 25
3.5.2 EUROPE INDUSTRIAL PEG-2000 PRODUCTION CAPACITY, REVENUE, PRICE AND GROSS MARGIN (2017-2022) 25
3.6 CHINA INDUSTRIAL PEG-2000 PRODUCTION (2017-2022) 26
3.6.1 CHINA INDUSTRIAL PEG-2000 PRODUCTION GROWTH RATE (2017-2022) 26
3.6.2 CHINA INDUSTRIAL PEG-2000 PRODUCTION CAPACITY, REVENUE, PRICE AND GROSS MARGIN (2017-2022) 26
3.7 JAPAN INDUSTRIAL PEG-2000 PRODUCTION (2017-2022) 27
3.7.1 JAPAN INDUSTRIAL PEG-2000 PRODUCTION GROWTH RATE (2017-2022) 27
3.7.2 JAPAN INDUSTRIAL PEG-2000 PRODUCTION CAPACITY, REVENUE, PRICE AND GROSS MARGIN (2017-2022) 27
4 INDUSTRIAL PEG-2000 CONSUMPTION BY REGION 28
4.1 GLOBAL INDUSTRIAL PEG-2000 CONSUMPTION BY REGION 28
4.1.1 GLOBAL INDUSTRIAL PEG-2000 CONSUMPTION BY REGION 28
4.1.2 GLOBAL INDUSTRIAL PEG-2000 CONSUMPTION MARKET SHARE BY REGION 28
4.2 NORTH AMERICA 29
4.2.1 NORTH AMERICA INDUSTRIAL PEG-2000 CONSUMPTION BY COUNTRY 30
4.2.2 U.S. 31
4.2.3 CANADA 31
4.3 EUROPE 32
4.3.1 EUROPE INDUSTRIAL PEG-2000 CONSUMPTION BY COUNTRY 32
4.3.2 GERMANY 33
4.3.3 U.K. 34
4.3.4 FRANCE 34
4.3.5 RUSSIA 35
4.3.6 ITALY 35
4.4 ASIA PACIFIC 36
4.4.1 ASIA PACIFIC INDUSTRIAL PEG-2000 CONSUMPTION BY REGION 36
4.4.2 CHINA 37
4.4.3 JAPAN 38
4.4.4 SOUTH KOREA 38
4.4.5 INDIA 39
4.4.6 AUSTRALIA 40
4.4.7 SOUTHEAST ASIA 41
4.5 LATIN AMERICA 41
4.5.1 LATIN AMERICA INDUSTRIAL PEG-2000 CONSUMPTION BY COUNTRY 42
4.5.2 MEXICO 43
4.5.3 BRAZIL 43
5 SEGMENT BY APPLICATION 44
5.1 GLOBAL INDUSTRIAL PEG-2000 PRODUCTION MARKET SHARE BY APPLICATION (2017-2022) 44
5.2 GLOBAL INDUSTRIAL PEG-2000 REVENUE MARKET SHARE BY APPLICATION (2017-2022) 46
5.3 GLOBAL INDUSTRIAL PEG-2000 PRICE BY APPLICATION (2017-2022) 47
6 KEY COMPANIES PROFILED 48
6.1 DOW 48
6.1.1 DOW INDUSTRIAL PEG-2000 CORPORATION INFORMATION 48
6.1.2 DOW INDUSTRIAL PEG-2000 PRODUCT PORTFOLIO 48
6.1.3 DOW INDUSTRIAL PEG-2000 PRODUCTION CAPACITY, REVENUE, PRICE AND GROSS MARGIN (2017-2022) 49
6.1.4 DOW MAIN BUSINESS AND MARKETS SERVED 49
6.2 INEOS 50
6.2.1 INEOS INDUSTRIAL PEG-2000 CORPORATION INFORMATION 50
6.2.2 INEOS INDUSTRIAL PEG-2000 PRODUCT PORTFOLIO 50
6.2.3 INEOS INDUSTRIAL PEG-2000 PRODUCTION CAPACITY, REVENUE, PRICE AND GROSS MARGIN (2017-2022) 51
6.2.4 INEOS MAIN BUSINESS AND MARKETS SERVED 51
6.3 KAO 52
6.3.1 KAO INDUSTRIAL PEG-2000 CORPORATION INFORMATION 52
6.3.2 KAO INDUSTRIAL PEG-2000 PRODUCT PORTFOLIO 53
6.3.3 KAO INDUSTRIAL PEG-2000 PRODUCTION CAPACITY, REVENUE, PRICE AND GROSS MARGIN (2017-2022) 53
6.3.4 KAO MAIN BUSINESS AND MARKETS SERVED 53
6.4 BLAUNON 54
6.4.1 BLAUNON INDUSTRIAL PEG-2000 CORPORATION INFORMATION 54
6.4.2 BLAUNON INDUSTRIAL PEG-2000 PRODUCT PORTFOLIO 55
6.4.3 BLAUNON INDUSTRIAL PEG-2000 PRODUCTION CAPACITY, REVENUE, PRICE AND GROSS MARGIN (2017-2022) 55
6.4.4 BLAUNON MAIN BUSINESS AND MARKETS SERVED 56
6.5 LIAONING OXIRANCHEM 56
6.5.1 LIAONING OXIRANCHEM INDUSTRIAL PEG-2000 CORPORATION INFORMATION 56
6.5.2 LIAONING OXIRANCHEM INDUSTRIAL PEG-2000 PRODUCT PORTFOLIO 56
6.5.3 LIAONING OXIRANCHEM INDUSTRIAL PEG-2000 PRODUCTION CAPACITY, REVENUE, PRICE AND GROSS MARGIN (2017-2022) 57
6.5.4 LIAONING OXIRANCHEM MAIN BUSINESS AND MARKETS SERVED 57
6.6 JIANGSU HAIAN 58
6.6.1 JIANGSU HAIAN INDUSTRIAL PEG-2000 CORPORATION INFORMATION 58
6.6.2 JIANGSU HAIAN INDUSTRIAL PEG-2000 PRODUCT PORTFOLIO 59
6.6.3 JIANGSU HAIAN INDUSTRIAL PEG-2000 PRODUCTION CAPACITY, REVENUE, PRICE AND GROSS MARGIN (2017-2022) 59
6.6.4 JIANGSU HAIAN MAIN BUSINESS AND MARKETS SERVED 60
6.7 CLARIANT 60
6.7.1 CLARIANT INDUSTRIAL PEG-2000 CORPORATION INFORMATION 60
6.7.2 CLARIANT INDUSTRIAL PEG-2000 PRODUCT PORTFOLIO 61
6.7.3 CLARIANT INDUSTRIAL PEG-2000 PRODUCTION CAPACITY, REVENUE, PRICE AND GROSS MARGIN (2017-2022) 61
6.7.4 CLARIANT MAIN BUSINESS AND MARKETS SERVED 62
6.8 PCC SE 62
6.8.1 PCC SE INDUSTRIAL PEG-2000 CORPORATION INFORMATION 62
6.8.2 PCC SE INDUSTRIAL PEG-2000 PRODUCT PORTFOLIO 63
6.8.3 PCC SE INDUSTRIAL PEG-2000 PRODUCTION CAPACITY, REVENUE, PRICE AND GROSS MARGIN (2017-2022) 63
6.8.4 PCC SE MAIN BUSINESS AND MARKETS SERVED 63
6.9 NORCHEM 64
6.9.1 NORCHEM INDUSTRIAL PEG-2000 CORPORATION INFORMATION 64
6.9.2 NORCHEM INDUSTRIAL PEG-2000 PRODUCT PORTFOLIO 65
6.9.3 NORCHEM INDUSTRIAL PEG-2000 PRODUCTION CAPACITY, REVENUE, PRICE AND GROSS MARGIN (2017-2022) 65
6.9.4 NORCHEM MAIN BUSINESS AND MARKETS SERVED 65
6.10 OXITENO 66
6.10.1 OXITENO INDUSTRIAL PEG-2000 CORPORATION INFORMATION 66
6.10.2 OXITENO INDUSTRIAL PEG-2000 PRODUCT PORTFOLIO 66
6.10.3 OXITENO INDUSTRIAL PEG-2000 PRODUCTION CAPACITY, REVENUE, PRICE AND GROSS MARGIN (2017-2022) 67
6.10.4 OXITENO MAIN BUSINESS AND MARKETS SERVED 67
6.11 LOTTE CHEMICAL 67
6.11.1 LOTTE CHEMICAL INDUSTRIAL PEG-2000 CORPORATION INFORMATION 67
6.11.2 LOTTE CHEMICAL INDUSTRIAL PEG-2000 PRODUCT PORTFOLIO 68
6.11.3 LOTTE CHEMICAL INDUSTRIAL PEG-2000 PRODUCTION CAPACITY, REVENUE, PRICE AND GROSS MARGIN (2017-2022) 68
6.11.4 LOTTE CHEMICAL MAIN BUSINESS AND MARKETS SERVED 68
6.12 SANYO CHEMICAL 69
6.12.1 SANYO CHEMICAL INDUSTRIAL PEG-2000 CORPORATION INFORMATION 69
6.12.2 SANYO CHEMICAL INDUSTRIAL PEG-2000 PRODUCT PORTFOLIO 70
6.12.3 SANYO CHEMICAL INDUSTRIAL PEG-2000 PRODUCTION CAPACITY, REVENUE, PRICE AND GROSS MARGIN (2017-2022) 70
6.12.4 SANYO CHEMICAL MAIN BUSINESS AND MARKETS SERVED 70
6.13 INDIA GLYCOLS 71
6.13.1 INDIA GLYCOLS INDUSTRIAL PEG-2000 CORPORATION INFORMATION 71
6.13.2 INDIA GLYCOLS INDUSTRIAL PEG-2000 PRODUCT PORTFOLIO 71
6.13.3 INDIA GLYCOLS INDUSTRIAL PEG-2000 PRODUCTION CAPACITY, REVENUE, PRICE AND GROSS MARGIN (2017-2022) 72
6.13.4 INDIA GLYCOLS MAIN BUSINESS AND MARKETS SERVED 72
6.14 SASOL 72
6.14.1 SASOL INDUSTRIAL PEG-2000 CORPORATION INFORMATION 72
6.14.2 SASOL INDUSTRIAL PEG-2000 PRODUCT PORTFOLIO 73
6.14.3 SASOL INDUSTRIAL PEG-2000 PRODUCTION CAPACITY, REVENUE, PRICE AND GROSS MARGIN (2017-2022) 73
6.14.4 SASOL MAIN BUSINESS AND MARKETS SERVED 74
6.15 LIAONING HUAXING 74
6.15.1 LIAONING HUAXING INDUSTRIAL PEG-2000 CORPORATION INFORMATION 74
6.15.2 LIAONING HUAXING INDUSTRIAL PEG-2000 PRODUCT PORTFOLIO 75
6.15.3 LIAONING HUAXING INDUSTRIAL PEG-2000 PRODUCTION CAPACITY, REVENUE, PRICE AND GROSS MARGIN (2017-2022) 75
6.15.4 LIAONING HUAXING MAIN BUSINESS AND MARKETS SERVED 75
7 INDUSTRIAL PEG-2000 MANUFACTURING COST ANALYSIS 77
7.1 INDUSTRIAL PEG-2000 KEY RAW MATERIALS ANALYSIS 77
7.1.1 KEY RAW MATERIALS 77
7.1.2 KEY SUPPLIERS OF RAW MATERIALS 77
7.2 PROPORTION OF MANUFACTURING COST STRUCTURE 78
7.3 KEY RAW MARKET CONCENTRATION 78
7.4 INDUSTRIAL PEG-2000 INDUSTRIAL CHAIN ANALYSIS 80
8 MARKETING CHANNEL, DISTRIBUTORS AND CUSTOMERS 81
8.1 MARKETING CHANNEL 81
8.2 INDUSTRIAL PEG-2000 DISTRIBUTORS LIST 82
8.3 INDUSTRIAL PEG-2000 CUSTOMERS 83
9 INDUSTRIAL PEG-2000 MARKET DYNAMICS 84
9.1 INDUSTRIAL PEG-2000 INDUSTRY TRENDS 84
9.2 INDUSTRIAL PEG-2000 MARKET DRIVERS 84
9.3 INDUSTRIAL PEG-2000 MARKET CHALLENGES AND RESTRAINTS 84
10 PRODUCTION AND SUPPLY FORECAST 86
10.1 GLOBAL FORECASTED PRODUCTION OF INDUSTRIAL PEG-2000 BY REGION (2023-2028) 86
10.2 NORTH AMERICA INDUSTRIAL PEG-2000 PRODUCTION, REVENUE FORECAST (2023-2028) 87
10.3 EUROPE INDUSTRIAL PEG-2000 PRODUCTION, REVENUE FORECAST (2023-2028) 88
10.4 CHINA INDUSTRIAL PEG-2000 PRODUCTION, REVENUE FORECAST (2023-2028) 89
10.5 JAPAN INDUSTRIAL PEG-2000 PRODUCTION, REVENUE FORECAST (2023-2028) 89
11 CONSUMPTION AND DEMAND FORECAST 91
11.1 GLOBAL INDUSTRIAL PEG-2000 FORECASTED CONSUMPTION BY REGION 91
11.1.1 GLOBAL INDUSTRIAL PEG-2000 FORECASTED CONSUMPTION BY REGION 91
11.1.2 GLOBAL INDUSTRIAL PEG-2000 FORECASTED CONSUMPTION MARKET SHARE BY REGION 91
11.2 NORTH AMERICA FORECASTED CONSUMPTION OF INDUSTRIAL PEG-2000 BY COUNTRY 92
11.3 EUROPE MARKET FORECASTED CONSUMPTION OF INDUSTRIAL PEG-2000 BY COUNTRY 93
11.4 ASIA PACIFIC MARKET FORECASTED CONSUMPTION OF INDUSTRIAL PEG-2000 BY REGION 93
11.5 LATIN AMERICA FORECASTED CONSUMPTION OF INDUSTRIAL PEG-2000 BY COUNTRY 94
12 FORECAST BY APPLICATION 95
12.1 GLOBAL PRODUCTION, REVENUE AND PRICE FORECAST BY APPLICATION (2023-2028) 95
12.1.1 GLOBAL FORECASTED PRODUCTION OF INDUSTRIAL PEG-2000 BY APPLICATION (2023-2028) 95
12.1.2 GLOBAL FORECASTED REVENUE OF INDUSTRIAL PEG-2000 BY APPLICATION (2023-2028) 96
12.1.3 GLOBAL FORECASTED PRICE OF INDUSTRIAL PEG-2000 BY APPLICATION (2023-2028) 97
13 RESEARCH FINDINGS AND CONCLUSION 98
14 METHODOLOGY AND DATA SOURCE 99
14.1 METHODOLOGY/RESEARCH APPROACH 99
14.1.1 RESEARCH PROGRAMS/DESIGN 99
14.1.2 MARKET SIZE ESTIMATION 100
14.1.3 MARKET BREAKDOWN AND DATA TRIANGULATION 101
14.2 DATA SOURCE 102
14.2.1 SECONDARY SOURCES 102
14.2.2 PRIMARY SOURCES 103
14.3 AUTHOR LIST 104
Access full Report Description, Table of Figure, Chart, FREE sample, etc. please click
https://us.qyresearch.com/reports/350870/industrial-peg-2000
Any doubts and questions will be welcome.
Customization of the Report:
This report can be customized to meet the client's requirements. Please contact with us (global@qyresearch.com), who will ensure that you get a report that suits your needs.
About Us:
QYResearch founded in California, USA in 2007.It is a leading global market research and consulting company. With over 15 years' experience and professional research team in various cities over the world,QY Research focuses on management consulting, database and seminar services, IPO consulting, industry chain research and customized research to help our clients in providing non-linear revenue model and make them successful. We are globally recognized for our expansive portfolio of services, good corporate citizenship, and our strong commitment to sustainability. Up to now, we have cooperated with more than 59,000 clients across five continents. Let's work closely with you and build a bold and better future.
Contact Us
QY Research
E-mail: global@qyresearch.com
Tel: +1-626-842-1666(US) +852-5808-0956 (HK)
Add: 17890 Castleton Street Suite 369 City of Industry CA 91748 United States
Website: https://us.qyresearch.com
The QY Research released a latest market research report on the Global Industrial PEG-2000 market, which is segmented by region (country), company and by Application. Players, stakeholders, and other participants in the global Industrial PEG-2000 market will be able to gain the upper hand as they use the report as a powerful resource. The segmental analysis focuses on sales, revenue and forecast by region (country) and by Application of Global Industrial PEG-2000 market.
QYResearch founded in California, USA in 2007.It is a leading global market research and consulting company. With over 15 years' experience and professional research team in various cities over the world,QY Research focuses on management consulting, database and seminar services, IPO consulting, industry chain research and customized research to help our clients in providing non-linear revenue model and make them successful. We are globally recognized for our expansive portfolio of services, good corporate citizenship, and our strong commitment to sustainability. Up to now, we have cooperated with more than 59,000 clients across five continents. Let's work closely with you and build a bold and better future.
This release was published on openPR.
Permanent link to this press release:
Copy
Please set a link in the press area of your homepage to this press release on openPR. openPR disclaims liability for any content contained in this release.
You can edit or delete your press release Global Industrial PEG-2000 Market Trends and Forecast Report 2022 | By Players, Applications and Regions here
News-ID: 2607827 • Views: …
More Releases from QY Research
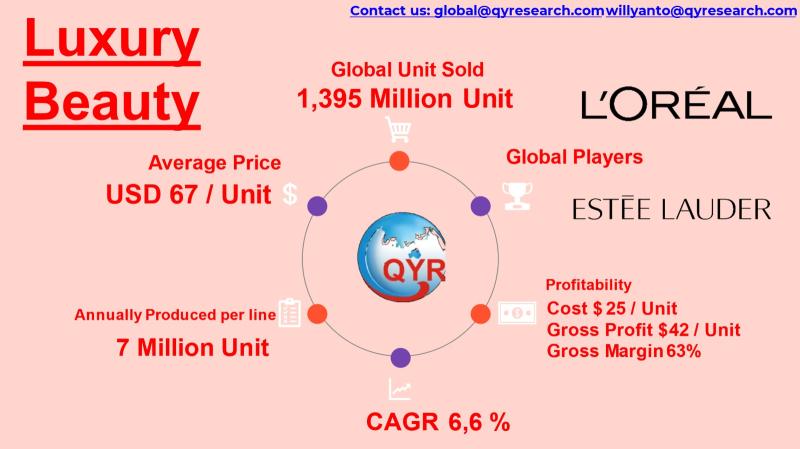
High Margins, High Growth: Inside the Global Luxury Beauty Opportunity
Luxury beauty encompasses premium skincare, cosmetics, fragrance, haircare, dermo-cosmetics, and prestige personal care products positioned with superior ingredients, branding, exclusivity, and high ASPs.
Core value drivers include brand heritage, innovation in active ingredients, dermatological efficacy, sustainability claims, and experiential retail.
Consumers increasingly view luxury beauty as self-care + wellness investment, not discretionary spending alone.
Distribution mix: specialty beauty retail, department stores, travel retail, e-commerce, brand boutiques, medical aesthetic clinics.
Global Market Snapshot
Market size (2025):…
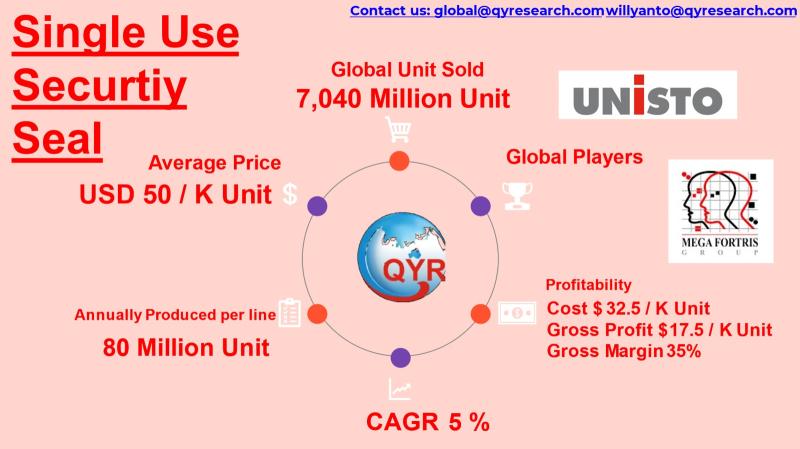
Security Seals Market 20252032: Smart Tech, Recurring Revenue, and Investor Upsi …
Single use security seals are tamper-evident mechanical or plastic locking devices designed for one-time application to secure containers, trucks, meters, ballot boxes, airline carts, cash bags, and logistics assets
Core function: theft deterrence, chain-of-custody control, compliance with customs, transport, and regulated industries
Widely used in logistics, utilities, aviation catering, banking, postal, healthcare, and e-commerce fulfillment
Market characterized by high volume, low ASP consumables with recurring replacement demand
Global Overview
Global market size (2025): USD 352…
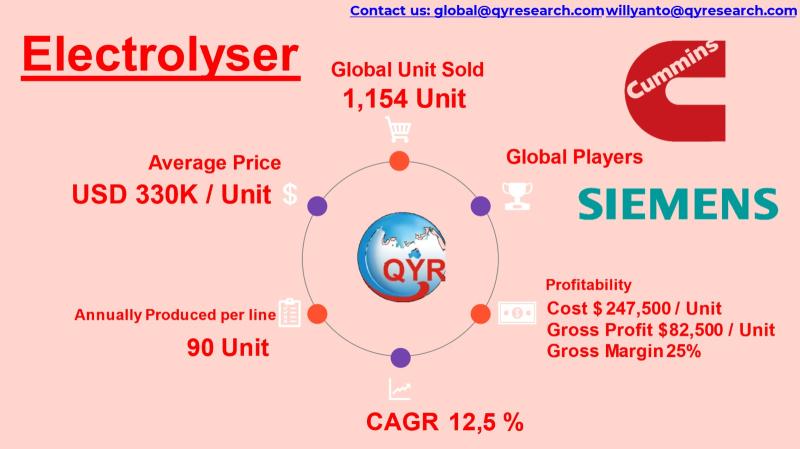
Hydrogen Infrastructure Surge: Why Electrolysers Are the Next Energy Investment …
Electrolyser systems are core equipment for producing green hydrogen through water electrolysis, converting electricity (increasingly renewable) into hydrogen and oxygen.
The industry underpins decarbonization across refining, fertilizers, steelmaking, mobility, and grid storage, making electrolysers a critical enabling technology for the global energy transition.
Technology categories include alkaline (AEL), proton exchange membrane (PEM), and solid oxide (SOEC), each optimized for different cost, efficiency, and operating profiles.
Global Market Overview
Global market size (2025): USD 381…
Top 30 Indonesian Dairy Public Companies Q3 2025 Revenue & Performance
1) Overall companies performance (Q3 2025 snapshot)
PT Indofood Sukses Makmur Tbk (INDF)
PT Indofood CBP Sukses Makmur Tbk (ICBP)
PT Ultrajaya Milk Industry & Trading Company Tbk (ULTJ)
PT Cisarua Mountain Dairy Tbk (CMRY)
PT Diamond Food Indonesia Tbk (DMND)
PT Mulya Boga Raya Tbk
PT Campina Ice Cream Industry Tbk
PT Kurniamitra Duta Sentosa Tbk
PT Greenfields Indonesia
PT Indolakto (subsidiary/brand under Indofood)
PT Ultra Jaya Frozen Foods (group affiliate)
PT Heilala Dairy Indonesia (export arm/processing)
PT Diamond Milk Products (non-listed…
More Releases for INDUSTRIAL
Industrial Display Market: Technology Advancements Driving Industrial Visualizat …
In recent years, the global Industrial Display Market has transformed significantly, driven by evolving consumer preferences, rapid technological advancements, and an increasing focus on sustainability. Our comprehensive Industrial Display Market Research Report is your essential guide to navigate this dynamic landscape, offering actionable insights into emerging trends, growth drivers, and key opportunities for your business.
Unlock in-depth analyses of the competitive supplier landscape, demand dynamics, and market projections with…
Industrial Auction Services Market Auctioning Industrial Assets By 2030 | Heath …
The Report on "Industrial Auction Services Market" provides Key Benefits, Market Overview, Regional Analysis, Market Segmentation, Future Trends Upto 2030 by Infinitybusinessinsights.com. The report will assist reader with better understanding and decision making.
The industrial auction services market is a diverse and dynamic sector that encompasses a wide range of industries, including manufacturing, construction, automotive, and more. These services are utilized by companies looking to optimize their asset management, streamline operations,…
RDM Industrial Products - Laboratory and Industrial Furniture Supplier
RDM Industrial Products Inc. is one of the most reputed and leading laboratory and industrial furniture solutions supplier and manufacturer. The company was established in 1977 and has been serving their growing clientele proudly for over 40 years. Their quality products cater to industries including healthcare, electronics, biotechnology, laboratory, industrial and more. The company is based out of California and their shipments are done all across the globe. QUALITY-SERVICE-TIMING are…
Industrial Fasteners Market # industrial fasteners and supply # industrial faste …
An insightful study, titled “Global Industrial Fasteners Market” has been freshly broadcasted to the vast research repository of Market Research Reports Search Engine (MRRSE). The research study provides detailed comprehensions and forecasts future growth of the global market with an in-depth study of the factors impacting revenue growth throughout the mentioned forecast period. Further, a deep analysis on the major players from diverse regions is also present in the report.
Get…
Global Industrial PC Market To Reach Us$8,784.2 Mn By 2025: By Type - Panel Indu …
Researchmoz added Most up-to-date research on "Global Industrial PC Market To Reach Us$8,784.2 Mn By 2025: By Type - Panel Industrial PC, Box Industrial PC And Embedded Industrial PC" to its huge collection of research reports.
Industrial PC is a ruggedized system designed to perform computing applications for various industries. Industrial PC is a PC-based computing podium mainly used for data acquisition or process control, and in some cases, it is…
