Press release
Raman Spectroscopy Market Trends, Growth Analysis, Investigation by Regions, Types, Applications and Analysis of Key Players
The QY Research released a latest market research report on the Global Raman Spectroscopy market, which is segmented by region (country), company and by Application. Players, stakeholders, and other participants in the global Raman Spectroscopy market will be able to gain the upper hand as they use the report as a powerful resource. The segmental analysis focuses on sales, revenue and forecast by region (country) and by Application for the period 2017-2028.For More Information About This Report, Please Enter:
https://us.qyresearch.com/reports/348616/raman-spectroscopy
Summary
Market Analysis and Insights: Global Raman Spectroscopy Market
The global Raman Spectroscopy market was valued at US$ 281.67 million in 2020 and it is expected to reach US$ 442.14 million by the end of 2027, growing at a CAGR of 6.46% during 2021-2027.
Global Raman Spectroscopy Market: Drivers and Restrains
The research report has incorporated the analysis of different factors that augment the market's growth. It constitutes trends, restraints, and drivers that transform the market in either a positive or negative manner. This section also provides the scope of different segments and applications that can potentially influence the market in the future. The detailed information is based on current trends and historic milestones. This section also provides an analysis of the volume of production about the global market and about each type from 2016 to 2027. This section mentions the volume of production by region from 2016 to 2027. Pricing analysis is included in the report according to each type from the year 2016 to 2027, manufacturer from 2016 to 2021, region from 2016 to 2021, and global price from 2016 to 2027.
A thorough evaluation of the restrains included in the report portrays the contrast to drivers and gives room for strategic planning. Factors that overshadow the market growth are pivotal as they can be understood to devise different bends for getting hold of the lucrative opportunities that are present in the ever-growing market. Additionally, insights into market expert's opinions have been taken to understand the market better.
The report mentions the prominent market player consisting of:
Horiba
Thermo
Renishaw
B&W Tek
Bruker
Kaiser Optical
WITec
Ocean Insight
Smiths Detection
JASCO
Agilent Technologies
TSI
Real Time Analyzers, Inc
Zolix
Sciaps
GangDong
Raman Spectroscopy Market Segment by Type
Immersion Mode
Stand-off Mode
Raman Spectroscopy Market Segment by Application
Biology and Medicine
Food and Health
Industrial
Others
The report on the Raman Spectroscopy market covers the following region (country) analysis:
Production by Region
North America
Europe
China
Japan
Consumption by Region
North America
U.S.
Canada
Mexico
Asia-Pacific
China
Japan
Korea
Southeast Asia
India
Rest of Asia-Pacific
Europe
Germany
France
U.K.
Italy
Russia
Rest of Europe
South America
Argentina
Brazil
Columbia
Rest of South America
The Goal of the Report
To study and analyze the global Raman Spectroscopyconsumption (value & volume) by key regions/countries, type and application, history data from 2017 to 2022, and forecast to 2028.
To understand the structure of Raman Spectroscopymarket by identifying its various subsegments.
Focuses on the key global Raman Spectroscopymanufacturers, to define, describe and analyze the sales volume, value, market share, market competition landscape, SWOT analysis and development plans in next few years.
To analyze the Raman Spectroscopywith respect to individual growth trends, prospects, and their contribution to the total market.
To share detailed information about the key factors influencing the growth of the market (growth potential, opportunities, drivers, industry-specific challenges, and risks).
To project the consumption of Raman Spectroscopysubmarkets, with respect to key regions (along with their respective key countries).
To analyze competitive developments such as expansions, agreements, new product launches, and acquisitions in the market.
To strategically profile the key players and comprehensively analyze their growth strategies.
Target Audience
> Raman Spectroscopy companies
> Research organizations
> Government Organizations
> Research/Consultancy firms
Table of Contents
1 RAMAN SPECTROSCOPY MARKET OVERVIEW 1
1.1 Product Overview and Scope of Raman Spectroscopy 1
1.2 Raman Spectroscopy Segment by Raman Process 1
1.2.1 Global Raman Spectroscopy Market Size Growth Rate Analysis by Raman Process: 2021 VS 2027 2
1.2.2 Immersion Mode 2
1.2.3 Stand-off Mode 3
1.3 Raman Spectroscopy Segment by Application 4
1.3.1 Global Raman Spectroscopy Consumption Comparison by Application: 2016 VS 2021 VS 2027 4
1.3.2 Biology and Medicine 5
1.3.3 Food and Health 6
1.3.4 Industrial 7
1.4 Global Market Growth Prospects 7
1.4.1 Global Raman Spectroscopy Revenue Estimates and Forecasts (2016-2027) 7
1.4.2 Global Raman Spectroscopy Production Estimates and Forecasts (2016-2027) 10
1.5 Global Market Size by Region 10
1.5.1 Global Raman Spectroscopy Market Size Estimates and Forecasts by Region: 2016 VS 2021 VS 2027 11
1.5.2 North America Raman Spectroscopy Estimates and Forecasts (2016-2027) 12
1.5.3 Europe Raman Spectroscopy Estimates and Forecasts (2016-2027) 13
1.5.4 China Raman Spectroscopy Estimates and Forecasts (2016-2027) 14
1.5.5 Japan Raman Spectroscopy Estimates and Forecasts (2016-2027) 15
2 MARKET COMPETITION BY MANUFACTURERS 16
2.1 Global Raman Spectroscopy Production by Manufacturers (2016-2021) 16
2.2 Global Raman Spectroscopy Revenue Market Share by Manufacturers (2016-2021) 18
2.3 Raman Spectroscopy Market Share by Company Type (Tier 1, Tier 2, and Tier 3) 20
2.4 Global Raman Spectroscopy Average Price by Manufacturers (2016-2021) 21
2.5 Manufacturers Raman Spectroscopy Headquarters 22
2.6 Raman Spectroscopy Market Competitive Situation and Trends 23
2.6.1 Raman Spectroscopy Market Concentration Rate 23
2.6.2 Global 5 Largest Raman Spectroscopy Players Market Share by Revenue 24
3 PRODUCTION BY REGION 25
3.1 Global Production of Raman Spectroscopy by Region (2016-2021) 25
3.2 Global Raman Spectroscopy Revenue Market Share by Region (2016-2021) 25
3.3 Global Raman Spectroscopy Production, Revenue, Price and Gross Margin (2016-2021) 26
3.4 North America Raman Spectroscopy Production 27
3.4.1 North America Raman Spectroscopy Production Growth Rate (2016-2021) 27
3.4.2 North America Raman Spectroscopy Production, Revenue, Price and Gross Margin (2016-2021) 27
3.5 Europe Raman Spectroscopy Production 28
3.5.1 Europe Raman Spectroscopy Production Growth Rate (2016-2021) 28
3.5.2 Europe Raman Spectroscopy Production, Revenue, Price and Gross Margin (2016-2021) 28
3.6 China Raman Spectroscopy Production (2016-2021) 29
3.6.1 China Raman Spectroscopy Production Growth Rate (2016-2021) 29
3.6.2 China Raman Spectroscopy Production, Revenue, Price and Gross Margin (2016-2021) 29
3.7 Japan Raman Spectroscopy Production (2016-2021) 30
3.7.1 Japan Raman Spectroscopy Production Growth Rate (2016-2021) 30
3.7.2 Japan Raman Spectroscopy Production, Revenue, Price and Gross Margin (2016-2021) 30
4 RAMAN SPECTROSCOPY CONSUMPTION BY REGION 32
4.1 Global Raman Spectroscopy Consumption by Region 32
4.1.1 Global Raman Spectroscopy Consumption by Region 32
4.1.2 Global Raman Spectroscopy Consumption Market Share by Region 32
4.2 North America 34
4.2.1 North America Raman Spectroscopy Consumption by Country 34
4.2.2 U.S. 36
4.2.3 Canada 37
4.2.4 Mexico 38
4.3 Europe 39
4.3.1 Europe Raman Spectroscopy Consumption by Country 39
4.3.2 Germany 41
4.3.3 France 42
4.3.4 U.K. 43
4.3.5 Italy 44
4.3.6 Russia 45
4.4 Asia Pacific 46
4.4.1 Asia Pacific Raman Spectroscopy Consumption by Region 46
4.4.2 China 48
4.4.3 Japan 49
4.4.4 South Korea 50
4.4.5 Southeast Asia 51
4.4.6 India 52
4.5 South America 53
4.5.1 South America Raman Spectroscopy Consumption by Country 53
4.5.2 Argentina 55
4.5.3 Brazil 56
4.5.4 Columbia 57
5 PRODUCTION, REVENUE, PRICE TREND BY RAMAN PROCESS 58
5.1 Global Raman Spectroscopy Production Market Share by Raman Process (2016-2021) 58
5.2 Global Raman Spectroscopy Revenue Market Share by Raman Process (2016-2021) 59
5.3 Global Raman Spectroscopy Price by Raman Process (2016-2021) 60
6 CONSUMPTION ANALYSIS BY APPLICATION 61
6.1 Global Raman Spectroscopy Consumption Market Share by Application (2016-2021) 61
6.2 Global Raman Spectroscopy Consumption Growth Rate by Application (2017-2021) 62
7 RAMAN SPECTROSCOPY MAJOR MANUFACTURERS ANALYSIS 63
7.1 Horiba 63
7.1.1 Horiba Raman Spectroscopy Basic Information 63
7.1.2 Horiba Raman Spectroscopy Product Introduction 63
7.1.3 Horiba Raman Spectroscopy Production, Revenue, Price and Gross Margin (2019-2020) 64
7.1.4 Horiba Contact Information 64
7.2 Thermo 65
7.2.1 Thermo Raman Spectroscopy Basic Information 65
7.2.2 Thermo Raman Spectroscopy Product Introduction 65
7.2.3 Thermo Raman Spectroscopy Production, Revenue, Price and Gross Margin (2019-2020) 66
7.2.4 Thermo Contact Information 66
7.3 Renishaw 67
7.3.1 Renishaw Raman Spectroscopy Basic Information 67
7.3.2 Renishaw Raman Spectroscopy Product Introduction 68
7.3.3 Renishaw Raman Spectroscopy Production, Revenue, Price and Gross Margin (2019-2020) 68
7.3.4 Renishaw Contact Information 69
7.4 B&W Tek 69
7.4.1 B&W Tek Raman Spectroscopy Basic Information 69
7.4.2 B&W Tek Raman Spectroscopy Product Introduction 70
7.4.3 B&W Tek Raman Spectroscopy Production, Revenue, Price and Gross Margin (2019-2020) 70
7.4.4 B&W Tek Contact Information 71
7.5 Bruker 71
7.5.1 Bruker Raman Spectroscopy Basic Information 71
7.5.2 Bruker Raman Spectroscopy Product Introduction 72
7.5.3 Bruker Raman Spectroscopy Production, Revenue, Price and Gross Margin (2019-2020) 72
7.5.4 Bruker Contact Information 73
7.6 Kaiser Optical 73
7.6.1 Kaiser Optical Raman Spectroscopy Basic Information 73
7.6.2 Kaiser Optical Raman Spectroscopy Product Introduction 74
7.6.3 Kaiser Optical Raman Spectroscopy Production, Revenue, Price and Gross Margin (2019-2020) 74
7.6.4 Kaiser Optical Contact Information 74
7.7 WITec 75
7.7.1 WITec Raman Spectroscopy Basic Information 75
7.7.2 WITec Raman Spectroscopy Product Introduction 75
7.7.3 WITec Raman Spectroscopy Production, Revenue, Price and Gross Margin (2019-2020) 76
7.7.4 WITec Contact Information 76
7.8 Ocean Insight 76
7.8.1 Ocean Insight Raman Spectroscopy Basic Information 76
7.8.2 Ocean Insight Raman Spectroscopy Product Introduction 77
7.8.3 Ocean Insight Raman Spectroscopy Production, Revenue, Price and Gross Margin (2019-2020) 78
7.8.4 Ocean Insight Contact Information 78
7.9 Smiths Detection 78
7.9.1 Smiths Detection Raman Spectroscopy Basic Information 78
7.9.2 Smiths Detection Raman Spectroscopy Product Introduction 79
7.9.3 Smiths Detection Raman Spectroscopy Production, Revenue, Price and Gross Margin (2019-2020) 79
7.9.4 Smiths Detection Contact Information 80
7.10 JASCO 80
7.10.1 JASCO Raman Spectroscopy Basic Information 80
7.10.2 JASCO Raman Spectroscopy Product Introduction 81
7.10.3 JASCO Raman Spectroscopy Production, Revenue, Price and Gross Margin (2019-2020) 81
7.10.4 JASCO Contact Information 81
7.11 Agilent Technologies 82
7.11.1 Agilent Technologies Raman Spectroscopy Basic Information 82
7.11.2 Agilent Technologies Raman Spectroscopy Product Introduction 82
7.11.3 Agilent Technologies Raman Spectroscopy Production, Revenue, Price and Gross Margin (2019-2020) 83
7.11.4 Agilent Technologies Contact Information 83
7.12 TSI 84
7.12.1 TSI Raman Spectroscopy Basic Information 84
7.12.2 TSI Raman Spectroscopy Product Introduction 85
7.12.3 TSI Raman Spectroscopy Production, Revenue, Price and Gross Margin (2019-2020) 85
7.12.4 TSI Contact Information 86
7.13 Real Time Analyzers 86
7.13.1 Real Time Analyzers Raman Spectroscopy Basic Information 86
7.13.2 Real Time Analyzers Raman Spectroscopy Product Introduction 86
7.13.3 Real Time Analyzers Raman Spectroscopy Production, Revenue, Price and Gross Margin (2019-2020) 87
7.13.4 Real Time Analyzers Contact Information 87
7.14 Zolix 88
7.14.1 Zolix Raman Spectroscopy Basic Information 88
7.14.2 Zolix Raman Spectroscopy Product Introduction 89
7.14.3 Zolix Raman Spectroscopy Production, Revenue, Price and Gross Margin (2019-2020) 89
7.14.4 Zolix Contact Information 89
7.15 Sciaps 90
7.15.1 Sciaps Raman Spectroscopy Basic Information 90
7.15.2 Sciaps Raman Spectroscopy Product Introduction 90
7.15.3 Sciaps Raman Spectroscopy Production, Revenue, Price and Gross Margin (2019-2020) 91
7.15.4 Sciaps Contact Information 91
7.16 GangDong 91
7.16.1 GangDong Raman Spectroscopy Basic Information 91
7.16.2 GangDong Raman Spectroscopy Product Introduction 92
7.16.3 GangDong Raman Spectroscopy Production, Revenue, Price and Gross Margin (2019-2020) 92
7.16.4 GangDong Contact Information 92
8 RAMAN SPECTROSCOPY MANUFACTURING COST ANALYSIS 93
8.1 Raman Spectroscopy Key Raw Materials Analysis 93
8.2 Proportion of Manufacturing Cost Structure 94
8.3 Manufacturing Process Analysis of Raman Spectroscopy 95
8.4 Raman Spectroscopy Industrial Chain Analysis 96
9 MARKETING CHANNEL, DISTRIBUTORS AND CUSTOMERS 97
9.1 Marketing Channel 97
9.2 Raman Spectroscopy Distributors List 98
9.3 Raman Spectroscopy Customers 101
10 RAMAN SPECTROSCOPY MARKET DYNAMICS 103
10.1 Raman Spectroscopy Industry Trends 103
10.2 Raman Spectroscopy Market Drivers 103
10.3 Raman Spectroscopy Market Challenges 104
10.4 Porter's Five Forces Analysis 104
11 PRODUCTION AND SUPPLY FORECAST 106
11.1 Global Forecasted Production of Raman Spectroscopy by Region (2022-2027) 106
11.2 North America Raman Spectroscopy Production, Revenue Forecast (2022-2027) 107
11.3 Europe Raman Spectroscopy Production, Revenue Forecast (2022-2027) 108
11.4 China Raman Spectroscopy Production, Revenue Forecast (2022-2027) 109
11.5 Japan Raman Spectroscopy Production, Revenue Forecast (2022-2027) 110
12 CONSUMPTION AND DEMAND FORECAST 111
12.1 Global Forecasted Demand Analysis of Raman Spectroscopy 111
12.2 North America Forecasted Consumption of Raman Spectroscopy by Country 111
12.3 Europe Market Forecasted Consumption of Raman Spectroscopy by Country 112
12.4 Asia Pacific Market Forecasted Consumption of Raman Spectroscopy by Region 112
12.5 South America Forecasted Consumption of Raman Spectroscopy by Country 113
13 FORECAST BY RAMAN PROCESS AND BY APPLICATION (2022-2027) 114
13.1 Global Production, Revenue and Price Forecast by Raman Process (2022-2027) 114
13.1.1 Global Forecasted Production of Raman Spectroscopy by Raman Process (2022-2027) 114
13.1.2 Global Forecasted Revenue of Raman Spectroscopy by Raman Process (2022-2027) 114
13.1.3 Global Forecasted Price of Raman Spectroscopy by Raman Process (2022-2027) 115
13.2 Global Forecasted Consumption of Raman Spectroscopy by Application (2022-2027) 115
14 RESEARCH FINDINGS AND CONCLUSION 116
15 METHODOLOGY AND DATA SOURCE 117
15.1 Methodology/Research Approach 117
15.1.1 Research Programs/Design 117
15.1.2 Market Size Estimation 118
15.1.3 Market Breakdown and Data Triangulation 119
15.2 Data Source 120
15.2.1 Secondary Sources 120
15.2.2 Primary Sources 121
15.3 Author List 122
15.4 Disclaimer 122
Access full Report Description, Table of Figure, Chart, FREE sample, etc. please click
https://us.qyresearch.com/reports/348616/raman-spectroscopy
Any doubts and questions will be welcome.
Customization of the Report:
This report can be customized to meet the client's requirements. Please contact with us (global@qyresearch.com), who will ensure that you get a report that suits your needs.
About Us:
QYResearch founded in California, USA in 2007.It is a leading global market research and consulting company. With over 15 years' experience and professional research team in various cities over the world,QY Research focuses on management consulting, database and seminar services, IPO consulting, industry chain research and customized research to help our clients in providing non-linear revenue model and make them successful. We are globally recognized for our expansive portfolio of services, good corporate citizenship, and our strong commitment to sustainability. Up to now, we have cooperated with more than 59,000 clients across five continents. Let's work closely with you and build a bold and better future.
Contact Us
QY Research
E-mail: global@qyresearch.com
Tel: +1-626-842-1666(US) +852-5808-0956 (HK)
Add: 17890 Castleton Street Suite 369 City of Industry CA 91748 United States
Website: https://us.qyresearch.com
The QY Research released a latest market research report on the Global Raman Spectroscopy market, which is segmented by region (country), company and by Application. Players, stakeholders, and other participants in the global Raman Spectroscopy market will be able to gain the upper hand as they use the report as a powerful resource. The segmental analysis focuses on sales, revenue and forecast by region (country) and by Application for the period 2017-2028.
QYResearch founded in California, USA in 2007.It is a leading global market research and consulting company. With over 15 years' experience and professional research team in various cities over the world,QY Research focuses on management consulting, database and seminar services, IPO consulting, industry chain research and customized research to help our clients in providing non-linear revenue model and make them successful. We are globally recognized for our expansive portfolio of services, good corporate citizenship, and our strong commitment to sustainability. Up to now, we have cooperated with more than 59,000 clients across five continents. Let's work closely with you and build a bold and better future.
This release was published on openPR.
Permanent link to this press release:
Copy
Please set a link in the press area of your homepage to this press release on openPR. openPR disclaims liability for any content contained in this release.
You can edit or delete your press release Raman Spectroscopy Market Trends, Growth Analysis, Investigation by Regions, Types, Applications and Analysis of Key Players here
News-ID: 2601738 • Views: …
More Releases from QY Research
Top 30 Indonesian Sugar Public Companies Q3 2025 Revenue & Performance
1) Overall companies performance (Q3 2025 snapshot)
PT Aman Agrindo Tbk sugarcane & sugar products (IDX:GULA)
PT Sugar Group Companies largest private sugar producer (not publicly listed)
PT Prima Alam Gemilang (PAG) major sugar mill operator (private)
PT Sinergi Gula Nusantara sugar mill operator (private)
PT Indofood Sukses Makmur Tbk (IDX:INDF) major food company using sugar inputs
PT Mayora Indah Tbk (IDX:MYOR) food & beverage…
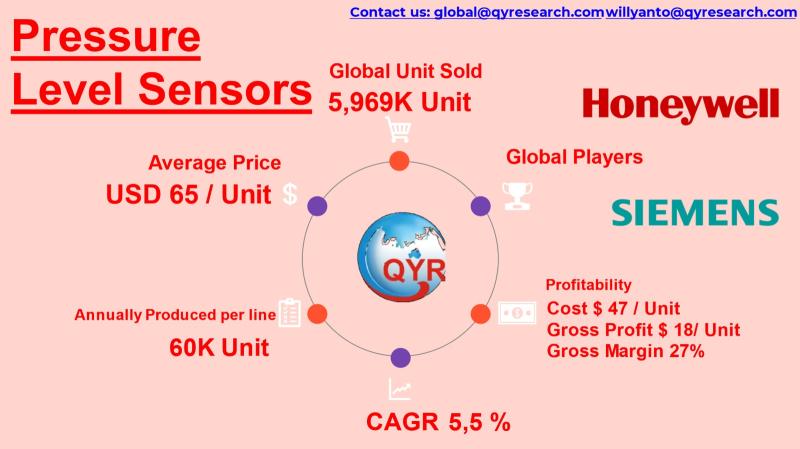
Smart Factories, Smart Sensors: Investment Opportunities in Pressure Monitoring …
Pressure level sensors are electro-mechanical or MEMS-based devices that measure liquid or gas pressure and convert it into electrical signals for level monitoring, process control, and safety automation.
Widely deployed across industrial automation, water management, automotive systems, oil & gas, HVAC, chemical processing, and medical devices.
Growing demand for real-time monitoring, smart factories, and predictive maintenance is accelerating sensor integration in both legacy and new equipment.
Miniaturization, digital connectivity, and ruggedization enable deployment…
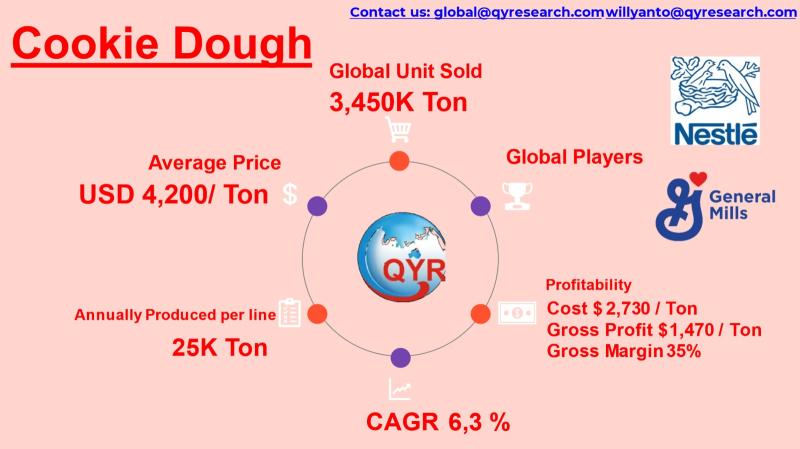
Inside the USD 14.5B Cookie Dough Boom: Asia & ASEAN Drive the Next Growth Wave
Cookie dough refers to ready-to-bake, ready-to-eat (heat-treated flour), frozen, chilled, or shelf-stable dough products used by households, foodservice, bakeries, cafés, QSR chains, and industrial bakery processors.
The industry sits at the intersection of frozen desserts, bakery ingredients, and convenience foods, driven by home baking trends, quick-service restaurants, and private label retail expansion.
Growth is supported by:
rising demand for convenience snacks
growth of frozen retail chains
increasing foodservice pre-mix adoption
premium flavors and indulgence culture
Asia &…
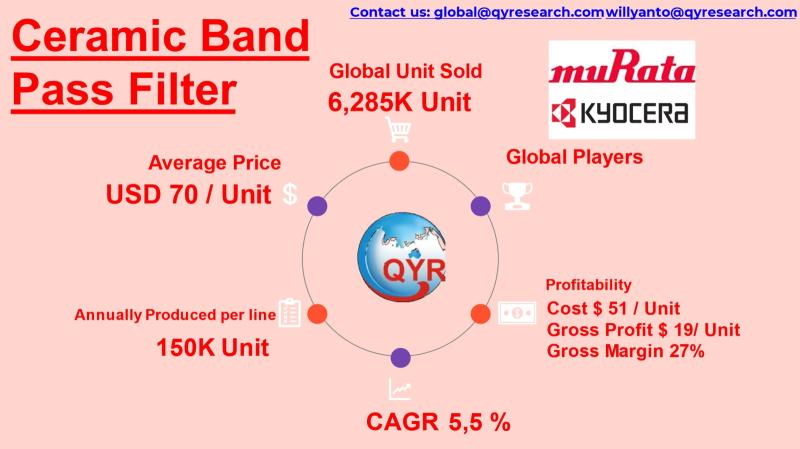
Inside the USD 440M Ceramic RF Filter Industry: ASEAN Expansion & IoT Demand
Inside the USD 440M Ceramic RF Filter Industry: ASEAN Expansion & IoT Demand
Ceramic band pass filters are compact radio-frequency (RF) components that allow a defined frequency band to pass while attenuating signals outside the range, enabling stable signal integrity in wireless, automotive, IoT, and industrial communication systems.
Built using piezoelectric ceramic resonators, they offer low insertion loss, small footprint, high selectivity, and strong thermal stability, making them widely adopted in smartphones,…
More Releases for Raman
Infrared And Raman Microscope Market Size Analysis by Application, Type, and Reg …
According to Market Research Intellect, the global Infrared And Raman Microscope market under the Internet, Communication and Technology category is expected to register notable growth from 2025 to 2032. Key drivers such as advancing technologies, changing consumer behavior, and evolving market dynamics are poised to shape the trajectory of this market throughout the forecast period.
The infrared and Raman microscope market is experiencing significant growth, driven by advancements in spectroscopy and…
Desktop Raman Spectrometers Market Size Analysis by Application, Type, and Regio …
USA, New Jersey- According to Market Research Intellect, the global Desktop Raman Spectrometers market in the Internet, Communication and Technology category is projected to witness significant growth from 2025 to 2032. Market dynamics, technological advancements, and evolving consumer demand are expected to drive expansion during this period.
Increasing applications in pharmaceuticals, biotechnology, material science, and forensic investigation are driving notable expansion in the desktop Raman spectrometer market. As sectors give…
Raman Spectroscopy Market Size 2024 to 2031.
Market Overview and Report Coverage
Raman Spectroscopy is a non-destructive analytical technique used in various industries such as healthcare, pharmaceuticals, and materials science to provide detailed information about the molecular structure of a sample. It involves the scattering of light by molecules, resulting in shifts in their energy levels that can be analyzed to identify the composition of the sample.
The future outlook for the Raman Spectroscopy Market looks promising,…
Global Confocal Raman Microscopes Market Research Report 2019
Market Research Report Store offers a latest published report on Confocal Raman Microscopes Market Analysis and Forecast 2019-2025 delivering key insights and providing a competitive advantage to clients through a detailed report.
Horiba was the global largest manufacturer in the Confocal Raman microscopy industry, accounted for maximal market share about 35% in the global market, followed by Thermo Fisher , WITec, Renishaw, and Bruker. Those top 5 companies accounted for a…
AFM-Raman Market Size, Share, Development by 2024
Global Info Research offers a latest published report on AFM-Raman Market Analysis and Forecast 2019-2025 delivering key insights and providing a competitive advantage to clients through a detailed report. This report focuses on the key global AFM-Raman players, to define, describe and analyze the value, market share, market competition landscape, SWOT analysis and development plans in next few years.
To analyze the AFM-Raman with respect to individual growth trends, future prospects,…
Raman Spectroscopy Market Competitive Analysis 2018 to 2021
Global Raman Spectroscopy Market 2018 to 2021 presents associate in-depth assessment of the Raman Spectroscopy together with sanctionative technologies, key trends, market drivers, challenges, standardization, regulative landscape, readying models, operator case studies, opportunities, future roadmap, price chain, scheme player profiles and methods. The report conjointly presents forecasts for Raman Spectroscopy investments from 2018 until 2021.
According to the report, one of the major drivers for this market is Increased focus on…
