Press release
The Data Centre Dilemma Market Data Centre Power & Sustainability - A survey of the implications of the increase of Data Centre Power in 20 key Metro city markets
About the DCP The Data Centre Dilemma – Power & Sustainability report:The new report Data Centre Dilemma Market analyses 20 key Metro city Markets in Europe and Asia.
It examines the impact of Data Centres on power infrastructure in the key metros and developments in sustainability including the use of renewable power and the impact of technology & the requirements needed to meet net zero.
Within the Data Centre facility power density has increased over time. DCP calculates that the average power density IT load in Europe has increased from 1.3 kW per m2 of utilised space (in mid-2016) up to 1.6 kW per m2 over the 5 year period to mid-2021. The growth in average power density has been accelerated by the growth in Hyperscale computing requirements and the increase in cloud services. However, pure Hyperscale facilities have a higher level of power density with 2 kW and above per m2. The level of power density average is set to increase as Data Centre facilities become more efficient and older stock is upgraded or replaced.
Get a Free Sample Copy of The Data Centre Dilemma Market Research Report at https://www.reportsnreports.com/contacts/requestsample.aspx?name=5081041
Plus, The report provides a 4-year Data Centre Power forecast for key metro city markets in Europe and Asia.
Geographical coverage
• Amsterdam (Netherlands)
• Beijing (China)
• Berlin (Germany)
• Dublin (Ireland)
• Frankfurt (Germany)
• Jakarta (Indonesia)
• Johannesburg (South Africa)
• Kuala Lumpur (Asia-Pacific)
• London and Slough (UK)
• Madrid (Spain)
• Marseille (France)
• Milan (Italy)
• Osaka (Japan)
• Paris (France)
• Shanghai (China)
• Singapore
• Stockholm (Sweden)
• Sydney (Australia)
• Tokyo (Japan)
Table of Contents:
A list of Figures – The Data Centre Dilemma
Methodology – The Data Centre Dilemma
Executive Summary – The Data Centre Dilemma
Introduction – The Data Centre Dilemma: rising power requirements & the quest for sustainability
Get 25% Discount on this Research Report at https://www.reportsnreports.com/contacts/discount.aspx?name=5081041
Data Centre & power requirements
The competing uses for power
The balance between power supply & power demands
The importance of Data Centre power
The impact of Data Centre power requirements on future Data Centres
Section 1 – The increase in Data Centre requirements & the impact on power infrastructure
Introduction
The increase in Data Centre power usage – real & perceived
Power usage within the Data Centre facility
The impact of Data Centre power usage on the power grid
The growth in renewable power
The impact of power sustainability
Key Point Summary
Section 2 – Examples of the impact of Data Centres on power infrastructure
Introduction
Examples of Data Centres in selected city Metro & power infrastructure
Amsterdam
Dublin
Frankfurt
London
Madrid
Paris
Singapore
Stockholm
Key Point Summary
Section 3 – Data Centres and power sustainability & renewable power
Introduction
The key elements of power sustainability
The adoption of renewable power worldwide
Data Centre Providers & the use of sustainability
Data Centre Providers & the use of renewable power
The perception of Data Centres power usage worldwide
How should Data Centre Providers respond to the power challenge?
Key Point Summary
Section 4 – The trends & forecasts for the Data Centre Dilemma: Rising power requirements & the quest for sustainability
Introduction
The increase in Data Centre power needs – a forecast by key Metro markets
The competition between Data Centre power needs and other requirements
The growth in Data Centre sustainability – how achievable
The key trends for new Data Centre developments
Key Point Summary
Appendix One – The companies included in the Data Centre Dilemma: Rising power requirements & the quest for sustainability
Direct Purchase of this Research Report at https://www.reportsnreports.com/purchase.aspx?name=5081041
List of Figures:
Figure 1 – A table showing the currency exchange rates used in the report converted into USD $1
Figure 2 – A chart showing the 5 key European city areas (Amsterdam, Dublin, Frankfurt, Paris & London) Data Centre Power capacity (in MW) as of the end of 2021
Figure 3 – A chart showing the number of Data Centre facilities by the FLAP+D (Frankfurt, London, Amsterdam, Paris + Dublin) markets (and as a percentage of the country’s total)
Figure 4 – A table showing the percentage of Data Centre facilities per FLAP+D market and as a percentage of the Country Market total
Figure 5 – A table showing some of the key Hyperscale Data Centre facilities located in the Dublin area
Figure 6 – A table showing the increase in average power density in kW per m2 in the UK, USA, Germany & Singapore from the end of 2016 to the end of 2021
Figure 7 – A schematic showing the use of the PUE (Price Usage Effectiveness) metric
Figure 8 – A table showing the growth in Data Centre Power by each key city Metro market forecast from the end of 2021 to the end of 2025 in MW (including Amsterdam, Berlin, Frankfurt, Mumbai, Singapore, Stockholm & Tokyo)
Figure 9 – A map showing the Haarlemmermeer municipal area
Figure 10 – A map showing the Amsterdam municipal area
Figure 11 – A map showing the key Dutch Data Centre locations including Agriport
Figure 12 – A chart showing a forecast for Data Centre power in the Amsterdam city Metro area from the end of 2021 to the end of 2025 in MW pa
Figure 13 – A map showing the Dublin municipal area
Figure 14 – A chart showing the total Irish Electricity Forecast in TWh from 2020 to 2029 (EirGrid)
Figure 15 – A chart showing the forecast for Irish Data Centre power demand from 2019 to 2029 (low, median & high scenarios)
Figure 16 – A chart showing a forecast for Data Centre power in the Dublin city Metro area from the end of 2021 to the end of 2025 in MW pa
Figure 17 – A map showing the Frankfurt am Main municipal area
Figure 18 – A chart showing forecast Data Centre power for the Frankfurt Metro area from the end of 2021 to the end of 2025 in MW pa
Figure 19 – A map showing the London & inner M25 Metro area
Figure 20 – A chart showing a forecast for Data Centre power for the London & Slough Metro areas from the end of 2021 to the end of 2025 in MW pa
Figure 21 – A table showing the planned Data Centre facilities under development in the London & Slough city Metro areas
Figure 22 – A map showing the Madrid Metro city area
Figure 23 – A chart showing the forecast Data Centre power for the Madrid Metro area from the end of 2021 to the end of 2025 in MW pa
Figure 24 – A map showing the Paris Metro city area
Figure 25 – A chart showing a forecast for Data Centre power in the Paris Metro area from the end of 2021 to the end of 2025 in MW pa
Figure 26 – A map showing the Singapore island
Figure 27 – A chart showing a Data Centre Power forecast in Singapore from the end of 2021 to the end of 2025 in MW pa
Figure 28 – A map showing the Stockholm Metro city area
Figure 29 – A chart showing a forecast for Data Centre power in the Stockholm Metro city area from the end of 2021 to the end of 2025 in MW pa
Figure 30 – A table showing the Greenpeace/North China Electric Power University survey of the use of renewable power by 15 Chinese internet providers
Figure 31 – A picture showing the proposed Caransa Group Data Centre campus at Amsterdam Westpoort
Figure 32 – A chart showing forecast Amsterdam Metro area Data Centre power from the end of 2021 to the end of 2025 in MW pa
Figure 33 – A chart showing forecast Berlin Metro area Data Centre power from the end of 2021 to the end of 2025 in MW pa
Figure 34 – A chart showing forecast Dublin Metro area Data Centre power from the end of 2021 to the end of 2025 in MW pa
Figure 35 – A chart showing forecast Frankfurt Metro area Data Centre power from the end of 2021 to the end of 2025 in MW pa
Figure 36 – A chart showing forecast London & Slough Metro area Data Centre power from the end of 2021 to the end of 2025 in MW pa
Figure 37 – A chart showing forecast Madrid Metro area Data Centre power from the end of 2021 to the end of 2025 in MW pa
Figure 38 – A chart showing forecast Marseille Metro area Data Centre power from the end of 2021 to the end of 2025 in MW pa
Figure 39 – A chart showing forecast Milan Metro area Data Centre power from the end of 2021 to the end of 2025 in MW pa
Figure 40 – A chart showing forecast Mumbai Metro area Data Centre power from the end of 2021 to the end of 2025 in MW pa
Figure 41 – A chart showing forecast Paris Metro area Data Centre power from the end of 2021 to the end of 2025 in MW pa
Figure 42 – A chart showing forecast Stockholm Metro area Data Centre power from the end of 2021 to the end of 2025 in MW pa
Figure 43 – A chart showing forecast Johannesburg Metro area Data Centre power from the end of 2021 to the end of 2025 in MW pa
Figure 44 – A chart showing forecast Beijing Metro area Data Centre power from the end of 2021 to the end of 2025 in MW pa
Figure 45 – A chart showing forecast Hong Kong Metro area Data Centre power from the end of 2021 to the end of 2025 in MW pa
Figure 46 – A chart showing forecast Jakarta Metro area Data Centre power from the end of 2021 to the end of 2025 in MW pa
Figure 47 – A chart showing forecast Kuala Lumpar Metro area Data Centre power from the end of 2021 to the end of 2025 in MW pa
Figure 48 – A chart showing forecast Osaka Metro area Data Centre power from the end of 2021 to the end of 2025 in MW pa
Figure 49 – A chart showing forecast Shanghai Metro area Data Centre power from the end of 2021 to the end of 2025 in MW pa
Figure 50 – A chart showing forecast Singapore Metro area Data Centre power from the end of 2021 to the end of 2025 in MW pa
Figure 51 – A chart showing forecast Sydney Metro area Data Centre power from the end of 2021 to the end of 2025 in MW pa
Figure 52 – A chart showing forecast Tokyo Metro area Data Centre power from the end of 2021 to the end of 2025 in MW pa
Figure 53 – A summary table showing the combined forecast City Metro area increase in Data Centre power from the end of 2021 to the end of 2025 in MW pa
Figure 54 – A summary chart showing the combined forecast City Metro area increase in Data Centre power from the end of 2021 to the end of 2025 in MW pa
Figure 55 – A table showing a list of the Data Centre companies mentioned in the report
+ 1 888 391 5441
sales@reportsandreports.com
ReportsnReports.com is your single source for all market research needs. Our database includes 500,000+ market research reports from over 95 leading global publishers & in-depth market research studies of over 5000 micro markets.
This release was published on openPR.
Permanent link to this press release:
Copy
Please set a link in the press area of your homepage to this press release on openPR. openPR disclaims liability for any content contained in this release.
You can edit or delete your press release The Data Centre Dilemma Market Data Centre Power & Sustainability - A survey of the implications of the increase of Data Centre Power in 20 key Metro city markets here
News-ID: 2470846 • Views: …
More Releases from ReportsnReports

DeviceCon Series 2024 - UK Edition | MarketsandMarkets
Future Forward: Redefining Healthcare with Cutting-Edge Devices
Welcome to DeviceCon Series 2024 - Where Innovation Meets Impact!
Join us on March 21-22 at Millennium Gloucester Hotel, 4-18 Harrington Gardens, London SW7 4LH for a groundbreaking convergence of knowledge, ideas, and technology. MarketsandMarkets proudly presents the DeviceCon Series, an extraordinary blend of four conferences that promise to redefine the landscape of innovation in medical and diagnostic devices.
Register Now @ https://events.marketsandmarkets.com/devicecon-series-uk-edition-2024/register
MarketsandMarkets presents…

5th Annual MarketsandMarkets Infectious Disease and Molecular Diagnostics Confer …
London, March 7, 2024 - MarketsandMarkets is thrilled to announce the eagerly awaited 5th Annual Infectious Disease and Molecular Diagnostics Conference, scheduled to take place on March 21st - 22nd, 2024, at the prestigious Millennium Gloucester Hotel, located at 4-18 Harrington Gardens, London SW7 4LH.
This conference promises to be a groundbreaking event, showcasing the latest trends and insights in diagnosis, as well as unveiling cutting-edge technologies that are revolutionizing the…

Infection Control, Sterilization & Decontamination Conference |21st - 22nd March …
MarketsandMarkets is pleased to announce its 8th Annual Infection Control, Sterilisation, and Decontamination in Healthcare Conference, which will take place March 21-22, 2024, in London, UK. With the increased risk of infection due to improper sterilisation and decontamination practices, the safety of patients and healthcare workers is of paramount importance nowadays.
Enquire Now @ https://events.marketsandmarkets.com/infection-control-sterilization-and-decontamination-conference/
This conference aims to bring together all the stakeholders to discuss the obstacles in achieving…
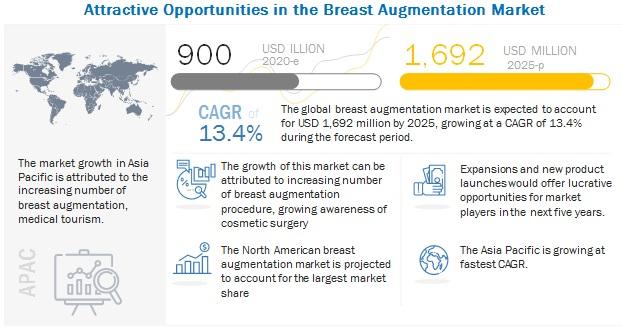
Breast Augmentation Market Key Players, Demands, Cost, Size, Procedure, Shape, S …
The global Breast Augmentation Market in terms of revenue was estimated to be worth $900 million in 2020 and is poised to reach $1,692 million by 2025, growing at a CAGR of 13.4% from 2020 to 2025. The new research study consists of an industry trend analysis of the market. The new research study consists of industry trends, pricing analysis, patent analysis, conference and webinar materials, key stakeholders, and buying…
More Releases for Data
Data Catalog Market: Serving Data Consumers
Data Catalog Market size was valued at US$ 801.10 Mn. in 2022 and the total revenue is expected to grow at a CAGR of 23.2% from 2023 to 2029, reaching nearly US$ 3451.16 Mn.
Data Catalog Market Report Scope and Research Methodology
The Data Catalog Market is poised to reach a valuation of US$ 3451.16 million by 2029. A data catalog serves as an organized inventory of an organization's data assets, leveraging…
Big Data Security: Increasing Data Volume and Data Velocity
Big data security is a term used to describe the security of data that is too large or complex to be managed using traditional security methods. Big data security is a growing concern for organizations as the amount of data generated continues to increase. There are a number of challenges associated with securing big data, including the need to store and process data in a secure manner, the need to…
HOW TO TRANSFORM BIG DATA TO SMART DATA USING DATA ENGINEERING?
We are at the cross-roads of a universe that is composed of actors, entities and use-cases; along with the associated data relationships across zillions of business scenarios. Organizations must derive the most out of data, and modern AI platforms can help businesses in this direction. These help ideally turn Big Data into plug-and-play pieces of information that are being widely known as Smart Data.
Specialized components backed up by AI and…
Test Data Management (TDM) Market - test data profiling, test data planning, tes …
The report categorizes the global Test Data Management (TDM) market by top players/brands, region, type, end user, market status, competition landscape, market share, growth rate, future trends, market drivers, opportunities and challenges, sales channels and distributors.
This report studies the global market size of Test Data Management (TDM) in key regions like North America, Europe, Asia Pacific, Central & South America and Middle East & Africa, focuses on the consumption…
Data Prep Market Report 2018: Segmentation by Platform (Self-Service Data Prep, …
Global Data Prep market research report provides company profile for Alteryx, Inc. (U.S.), Informatica (U.S.), International Business Corporation (U.S.), TIBCO Software, Inc. (U.S.), Microsoft Corporation (U.S.), SAS Institute (U.S.), Datawatch Corporation (U.S.), Tableau Software, Inc. (U.S.) and Others.
This market study includes data about consumer perspective, comprehensive analysis, statistics, market share, company performances (Stocks), historical analysis 2012 to 2017, market forecast 2018 to 2025 in terms of volume, revenue, YOY…
Long Term Data Retention Solutions Market - The Increasing Demand For Big Data W …
Data retention is a technique to store the database of the organization for the future. An organization may retain data for several different reasons. One of the reasons is to act in accordance with state and federal regulations, i.e. information that may be considered old or irrelevant for internal use may need to be retained to comply with the laws of a particular jurisdiction or industry. Another reason is to…
