Press release
Global Managed Services Market with COVID-19 Impact Analysis, Key Players, Size, Share, Demands, Growth and Forecasts to 2026
The global Managed Services market size is expected to grow at a Compound Annual Growth Rate (CAGR) of 7.9% during the forecast period, to reach USD 354.8 billion by 2026 from USD 242.9 billion in 2021. SMEs seek to adopt more managed services as the IT spending among SMEs is predicted to have a significant increase. Especially in Europe, according to a study, the CAGR for IT spend by SMEs in Europe, the Middle East, and Africa (EMEA) between 2018 and 2023 is expected to be 3.8%, compared with 2.7% for the market overall, these accounted for 35.8% of IT spending in EMEA in 2019. The rise in IT spending by SMEs is expected to fuel the demand for MSPs, as they adopt cloud, automate services, and explore advanced digital technologies. These technologies have made the provision of managed services to smaller businesses much more cost-effective and efficient.Get a Free Sample Copy of this Global Managed Services Market Research Report at https://www.reportsnreports.com/contacts/requestsample.aspx?name=4679142
SMEs are more at risk of cybercrime than enterprises. According to the Verizon 2019 Data Breach Investigations Report (DBIR), 43% of cyberattacks target small businesses. SMEs face significant budget constraints and need to maintain compliance and data protection laws. Another study shows that nearly 65%, 50%, 47%, and 30% of the enterprise consider the desire to reduce CAPEX and other costs, increase efficiency, overcome internal skills shortages, and address security concerns, respectively, are the drivers for managed services adoption among SMEs. Hence, they are reaching out to MSPs to tackle these challenges.
According to the Datto study, only 3 out of 10 SMEs in the UK, the Netherlands, Germany, France, and Australia are outsourcing some or all of their IT needs; thus, there is a huge untapped potential in the SMEs segment.
The managed IT infrastructure and Data Center segment is expected to hold a larger market size during the forecast period.
Enterprises are adopting digital technologies, such as cloud computing, mobility, IoT, Big data, and predictive analytics, at a high rate across the world. These disruptive technologies are driving the digital revolution by breaking the barriers between the physical and digital worlds. These advancements empower almost all the verticals, including IT and telecom, healthcare and life sciences, retail and consumer goods, BFSI, manufacturing, among others, in terms of improved performance, faster time to market, and increased customer experience. However, managing an IT environment is a major concern for CIOs. Most IT enterprises are dedicating most of their time in the cycles of a plan, building, running, and maintaining IT with untrained IT employees. The lack of IT skilled professionals is the major challenge faced by CIOs. MSPs can address this issue and provide cost-effective solutions while also keeping the security aspect in mind. Managed data center and IT infrastructure services are further divided into managed print services, managed disaster recovery, server management, storage and backup, technical support and maintenance, and others (application & middleware management and database management).
The Banking, financial services, and insurance vertical expected to hold the largest market share in 2020
BFSI enterprises need highly complex IT infrastructure to maintain and manage data from trading instruments to record-keeping, as well as reporting and calculations. Apart from this, there are multiple stringent regulations and compliance that BFSI enterprises are supposed to comply with. Enterprises are highly charged for violation of these regulations. Hence, to avoid fines, enterprises require managed services. This is creating opportunities for MSPs. Financial transactions involve exchanging information with customers or internally; IT services are essential to their success. Hence, BFSI enterprises need MSPs to help provide services for ultra-low latency trading, market data, hosting, and infrastructure connectivity, and risk management solutions. Data encryption and secure backup are highly demanded by these enterprises, along with a full range of Backup and Disaster Recovery (BDR) solutions to meet federal compliance regulations. MSPs specializing in BDR for financial services help these businesses protect sensitive information, mitigate downtime, and promote overall business continuity. Managed network, managed security, and managed IT infrastructure are the most popular managed services across the BFSI vertical.
Get 25% Discount on this Research Report at https://www.reportsnreports.com/contacts/discount.aspx?name=4679142
North America to hold the largest market size and Asia Pacific (APAC) to grow at a higher rate during the forecast period
APAC is one of the fastest-growing regions in terms of technology adoption, and the demand for digitization is driven by various initiatives carried out by different governments and large enterprises in the region. Countries such as China, Japan, Australia, Singapore, India, and Indonesia are leading this technology adoption, which includes embracing new-age technologies such as AI, edge, IoT, analytics, and cloud. The region houses a large number of enterprises related to manufacturing, energy and utilities, transportation and logistics, chemicals, and aerospace, which is further expected to drive the demand for managed services. Rapid advancements in telecommunications, cloud computing, and IoT have led several organizations to adopt cloud-based strategies.
In the process of determining and verifying the market size for several segments and subsegments gathered through secondary research, extensive primary interviews were conducted with the key people. The breakup of the profiles of the primary participants as follows:
• By Company Type: Tier I: 40%, Tier II: 25%, and Tier III: 35%
• By Designation: C-Level: 25%, D-Level: 37%, and Others: 38%
• By Region: North America: 42%, Europe: 24%, APAC: 18%, and RoW: 16%
The report profiles the following key vendors:
• IBM (US)
• Fujitsu (Japan)
• Atos (France)
• Cisco (US)
• DXC (US)
• TCS (India)
• Rackspace (US)
• AT&T (US)
• Verizon (US)
• Dimension Data (South Africa)
• Infosys (India)
• HCL (India)
• Ericssion (Sweden)
• GTT Communications (US)
• NTT Data (Japan)
• Happiest Minds (India)
• Huawei (China)
• Nokia Networks (Finland)
• CenturyLink (US)
• Wipro (India)
• Cognizant (US)
• Capgemini (France)
• BT (UK)
• Deloitte (UK)
• Secureworks (US)
• Alert Logic(US)
• BAE Systems (UK)
• Trustwave (US)
• Hughes (US)
• MeTtel (US)
• Microland (India)
• Optanix (US)
• Essintial (US)
• Intact Tech (US)
• 1-Net (Singapore)
• Ascend technologies (US)
• SecureKloud (India)
• Aunalytics (US)
• AC3 (Australia)
• Cloud Specialists (Australia)
• Corsica Technologies (US)
• Empist (US)
The report segments the global managed services market by Service Type, managed security service, managed network service, managed IT infrastructure and data center service, managed communication and collaboration service, managed mobility service, and managed information service. By the deployment model, the managed services market has been segmented into cloud and on-premises. Based on organization size, the market has been classified into Small and Medium-sized Enterprises (SMEs) and large enterprises. By vertical, the managed services market has been classified into BFSI; Manufacturing; Healthcare and Lifesciences; IT and Telecom; Government and Public Sector; Energy and Utilities; Retail and Consumer Goods; Media and Entertainment and others. By region, the market has been segmented into North America, Europe, APAC, MEA, and Latin America.
Direct Purchase of this Research Report at https://www.reportsnreports.com/purchase.aspx?name=4679142
Research Coverage
Key Benefits of Buying the Report
The managed services market report will help the market leaders/new entrants in the managed services market with information on the closest approximations of the revenue numbers for the overall managed services market and the sub segments. The report will help stakeholders understand the competitive landscape and gain more insights to better position their businesses and to plan suitable go-to-market strategies. The report also helps stakeholders understand the pulse of the market and provides them with information on key market drivers, restraints, challenges, and opportunities.
Table Of Contents:
1 Introduction
1.1 Introduction To Covid-19
1.2 Covid-19 Health Assessment
Figure 1 Covid-19: Global Propagation
Figure 2 Covid-19 Propagation: Select Countries
1.3 Covid-19 Economic Assessment
Figure 3 Revised Gross Domestic Product Forecasts For Select G20 Countries In 2020
1.3.1 Covid-19 Economic Impact—Scenario Assessment
Figure 4 Criteria Impacting The Global Economy
Figure 5 Scenarios In Terms Of Recovery Of Global Economy
1.4 Objectives Of The Study
1.5 Market Definition
1.5.1 Inclusions And Exclusions
1.6 Market Scope
1.6.1 Market Segmentation
1.6.2 Regions Covered
1.6.3 Periodization Considered For The Study
1.7 Currency Considered
Table 1 Usd Exchange Rates, 2018–2020
1.8 Stakeholders
1.9 Summary Of Changes
2 Research Methodology
2.1 Research Data
Figure 6 Managed Services Market: Research Design
2.1.1 Secondary Data
2.1.2 Primary Data
2.1.2.1 Breakup Of Primary Profiles
Figure 7 Breakup Of Primary Interviews: By Company Type, Designation, And Region
Table 2 Primary Respondents: Managed Services Market
2.1.2.2 Key Industry Insights
2.2 Market Breakup And Data Triangulation
Figure 8 Data Triangulation
2.3 Market Size Estimation
Figure 9 Managed Services Market: Top-Down And Bottom-Up Approaches
Figure 10 Market Size Estimation Methodology: Approach 1 (Supply Side): Revenue Of Managed Services From Vendors
Figure 11 Market Size Estimation Methodology: Bottom-Up Approach (Supply Side): Collective Revenue Of Managed Service Vendors
Figure 12 Market Size Estimation Methodology: (Supply Side): Illustration Of Vendor Revenue Estimation
Figure 13 Market Size Estimation Methodology: Approach 2 (Demand Side): Revenue Generated From Managed Service Types (1/2)
2.4 Market Forecast
Table 3 Factor Analysis
2.5 Company Evaluation Matrix Methodology
Figure 14 Company Evaluation Matrix: Criteria Weightage
2.6 Startup/Sme Evaluation Matrix Methodology
Figure 15 Startup/Sme Evaluation Matrix: Criteria Weightage
2.7 Research Assumptions
Table 4 Research Assumptions: Market
2.8 Limitations Of The Study
3 Executive Summary
Figure 16 Managed Services Market: Global Snapshot
Figure 17 High Growth Segments In The Market
Figure 18 The Managed Data Center And It Infrastructure Segment Projected To Account For The Largest Market Size During The Forecast Period
Figure 19 On-Premise Deployment Projected To Account For A Larger Market Size During Forecast Period
Figure 20 Top Verticals In The Market, 2019–2026 (Usd Million)
Figure 21 Market: Regional Snapshot
4 Premium Insights
4.1 Attractive Growth Opportunities In The Managed Services Market
Figure 22 Focusing On Core Business And Increasing Return On Investment Are Driving The Adoption Of Managed Services
4.2 Market, By Service Type
Figure 23 Managed Data Center And It Infrastructure Segment To Account For The Largest Share During The Forecast Period
4.3 Market, By Deployment Type
Figure 24 On-Premise Segment To Account For A Larger Share In 2021
4.4 Market, By Organization Size
Figure 25 Large Enterprises Segment To Account For A Larger Share In 2021
4.5 Market, By Vertical
Figure 26 Bfsi Vertical Projected To Account For The Largest Market Share During The Forecast Period
4.6 Managed Services Market: Regional Scenario
Figure 27 Apac To Emerge As The Best Market For Investments In The Next Five Years
For More Details Inquire at https://www.reportsnreports.com/contacts/inquirybeforebuy.aspx?name=4679142
5 Market Overview And Industry Trends
5.1 Introduction
5.2 Market Dynamics
Figure 28 Drivers, Restraints, Opportunities, And Challenges
5.2.1 Drivers
5.2.1.1 Lack Of Skilled It Professionals
5.2.1.2 Growth In Adjacent Markets Such As Cloud Computing
5.2.1.3 Rise In Demand For Secure It Infrastructure During The Covid-19 Pandemic
5.2.1.4 Organizations Embrace As-A-Service Capabilities
5.2.1.5 Cost And Risk Reduction
5.2.2 Restraints
5.2.2.1 Increase In Regulations And Compliances
5.2.2.2 Concerns Over Privacy And Data Security
5.2.3 Opportunities
5.2.3.1 Surge In Adoption Of Cloud
5.2.3.2 Changing Work Environment
5.2.3.3 Increase In Dependency Of Smes On Managed Services
5.2.4 Challenges
5.2.4.1 Increase In Security Concerns
5.2.4.2 Lack Of Sales And Marketing Staff, Training, And Cybersecurity To Severely Affect The Growth Of Managed Service Providers
5.3 Supply Chain Analysis
Figure 29 Managed Services Market: Supply Chain
Table 5 Supply Chain
5.4 Ecosystem
Table 6 Market: Ecosystem
5.5 Patent Analysis
Figure 30 Number Of Patents Published In Last 10 Years
Figure 31 Usd: Top Five Patent Owners
Table 7 Us: Top 10 Patent Owners
5.6 Managed Services: Impact Of Covid-19
Figure 32 Impact Of Covid-19
5.7 Covid-19-Driven Market Dynamics
5.7.1 Drivers And Opportunities
5.7.2 Restraints And Challenges
5.8 Use Cases
5.8.1 Use Case 1: Rackspace
5.8.2 Use Case 2: Tcs
5.8.3 Use Case 3: Infosys
5.8.4 Use Case 4: Fujitsu
5.8.5 Use Case 5: Dxc
5.8.6 Use Case 6: Capgemini
5.9 Porter’s Five Forces Analysis
Figure 33 Managed Services Market: Porter’s Five Forces Analysis
Table 8 Market: Porter’s Five Forces Analysis
5.9.1 Threat Of New Entrants
5.9.2 Threat Of Substitutes
5.9.3 Bargaining Power Of Suppliers
5.9.4 Bargaining Power Of Buyers
5.9.5 Degree Of Competition
5.10 Technological Analysis
5.10.1 Big Data And Analytics
5.10.2 Cloud Computing
5.10.3 Artificial Intelligence
5.10.4 Machine Learning
5.11 Regulations
5.11.1 North America
5.11.2 Europe
5.11.3 Apac
5.11.4 Middle East & Africa
5.11.5 Latin America
5.12 Pricing Analysis
Table 9 Pricing Analysis Of Managed Service Vendors
5.13 Revenue Shift: Yc/Ycc Shift
Figure 34 Market: Yc/Ycc Shift
6 Managed Services Market, By Service Type
6.1 Introduction
Figure 35 Managed Data Center And It Infrastructure Services Segment To Hold The Largest Market Size During The Forecast Period
6.1.1 Market Drivers, By Service Type
6.1.2 Covid-19 Impact On The Market, By Service Type
Table 10 Market Size, By Service Type, 2016–2020 (Usd Million)
Table 11 Managed Services Market Size, By Service Type, 2021–2026 (Usd Million)
Table 12 Managed Security Services Market Size, By Region, 2016–2020 (Usd Million)
Table 13 Managed Security Services Market Size, By Region, 2021–2026 (Usd Million)
Table 14 Managed Network Services Market Size, By Region, 2016–2020 (Usd Million)
Table 15 Managed Network Services Market Size, By Region, 2021–2026 (Usd Million)
Table 16 Managed Data Center And It Infrastructure Services Market Size, By Region, 2016–2020 (Usd Million)
Table 17 Managed Data Center And It Infrastructure Services Market Size, By Region, 2021–2026 (Usd Million)
Table 18 Managed Communication And Collaboration Services Market Size, By Region, 2016–2020 (Usd Million)
Table 19 Managed Communication And Collaboration Services Market Size, By Region, 2021–2026 (Usd Million)
Table 20 Managed Mobility Services Market Size, By Region, 2016–2020 (Usd Million)
Table 21 Managed Mobility Services Market Size, By Region, 2021–2026 (Usd Million)
Table 22 Managed Information Services Market Size, By Region, 2016–2020 (Usd Million)
Table 23 Managed Information Services Market Size, By Region, 2021–2026 (Usd Million)
7 Managed Services Market, By Managed Security Services
7.1 Introduction
Figure 36 Managed Identity And Access Management Segment Is Projected To Grow At The Highest Cagr During The Forecast Period
7.1.1 Managed Security Services Market Drivers
7.1.2 Covid-19 Impact On The Managed Security Services Market
Table 24 Managed Security Services Market Size, By Type, 2016–2020 (Usd Million)
Table 25 Managed Security Services Market Size, By Type, 2021–2026 (Usd Million)
7.2 Managed Identity And Access Management
Table 26 Managed Identity And Access Management Market Size, By Region, 2016–2020 (Usd Million)
Table 27 Managed Identity And Access Management Market Size, By Region, 2021–2026 (Usd Million)
7.3 Managed Antivirus/Antimalware
Table 28 Managed Antivirus/Antimalware Market Size, By Region, 2016–2020 (Usd Million)
Table 29 Managed Antivirus/Antimalware Market Size, By Region, 2021–2026 (Usd Million)
7.4 Managed Firewall
Table 30 Managed Firewall Services Market Size, By Region, 2016–2020 (Usd Million)
Table 31 Managed Firewall Services Market Size, By Region, 2021–2026 (Usd Million)
7.5 Managed Risk And Compliance Management
Table 32 Managed Risk And Compliance Management Services Market Size, By Region, 2016–2020 (Usd Million)
Table 33 Managed Risk And Compliance Management Services Market Size, By Region, 2021–2026 (Usd Million)
7.6 Managed Vulnerability Management
Table 34 Managed Vulnerability Management Services Market Size, By Region, 2016–2020 (Usd Million)
Table 35 Managed Vulnerability Management Services Market Size, By Region, 2021–2026 (Usd Million)
7.7 Managed Security Information And Event Management
Table 36 Managed Security Information And Event Management Services Market Size, By Region, 2016–2020 (Usd Million)
Table 37 Managed Security Information And Event Management Services Market Size, By Region, 2021–2026 (Usd Million)
7.8 Managed Intrusion Detection Systems/Intrusion Prevention Systems
Table 38 Managed Intrusion Detection Systems/Intrusion Prevention Systems Market Size, By Region, 2016–2020 (Usd Million)
Table 39 Managed Intrusion Detection Systems/Intrusion Prevention Systems Market Size, By Region, 2021–2026 (Usd Million)
7.9 Managed Unified Threat Management
Table 40 Managed Unified Threat Management Services Market Size, By Region, 2016–2020 (Usd Million)
Table 41 Managed Unified Threat Management Services Market Size, By Region, 2021–2026 (Usd Million)
7.10 Managed Encryption
Table 42 Managed Encryption Services Market Size, By Region, 2016–2020 (Usd Million)
Table 43 Managed Encryption Services Market Size, By Region, 2021–2026 (Usd Million)
7.11 Other Managed Security Services
Table 44 Other Managed Security Services Market Size, By Region, 2016–2020 (Usd Million)
Table 45 Other Managed Security Services Market Size, By Region, 2021–2026 (Usd Million)
8 Managed Services Market, By Managed Network Services
8.1 Introduction
Figure 37 The Managed Network Security Segment To Grow At The Highest Cagr During The Forecast Period
8.1.1 Managed Network Services Market Drivers
8.1.2 Covid-19 Impact On The Managed Network Services Market
Table 46 Managed Network Services Market Size, By Type, 2016–2020 (Usd Million)
Table 47 Managed Network Services Market Size, By Type, 2021–2026 (Usd Million)
8.2 Managed Local Area Network
Table 48 Managed Local Area Network Services Market Size, By Region, 2016–2020 (Usd Million)
Table 49 Managed Local Area Network Services Market Size, By Region, 2021–2026 (Usd Million)
8.3 Managed Wireless Fidelity
Table 50 Managed Wireless Fidelity Services Market Size, By Region, 2016–2020 (Usd Million)
Table 51 Managed Wireless Fidelity Services Market Size, By Region, 2021–2026 (Usd Million)
8.4 Managed Virtual Private Network
Table 52 Managed Virtual Private Network Services Market Size, By Region, 2016–2020 (Usd Million)
Table 53 Managed Virtual Private Network Services Market Size, By Region, 2021–2026 (Usd Million)
8.5 Managed Wide Area Network
Table 54 Managed Wide Area Network Services Market Size, By Region, 2016–2020 (Usd Million)
Table 55 Managed Wide Area Network Services Market Size, By Region, 2021–2026 (Usd Million)
8.6 Network Monitoring
Table 56 Managed Network Monitoring Services Market Size, By Region, 2016–2020 (Usd Million)
Table 57 Managed Network Monitoring Services Market Size, By Region, 2021–2026 (Usd Million)
8.7 Managed Network Security
Table 58 Managed Network Security Services Market Size, By Region, 2016–2020 (Usd Million)
Table 59 Managed Network Security Services Market Size, By Region, 2021–2026 (Usd Million)
9 Managed Services Market, By Managed It Infrastructure And Data Center Service
9.1 Introduction
Figure 38 The Server Management Segment Is Projected To Grow At The Highest Cagr During The Forecast Period
9.1.1 Managed Data Center And It Infrastructure Services Market Drivers
9.1.2 Covid-19 Impact On The Managed Data Center And It Infrastructure Services Market
Table 60 Managed Data Center And It Infrastructure Services Market Size, By Type, 2016–2020 (Usd Million)
Table 61 Managed Data Center And It Infrastructure Services Market Size, By Type, 2021–2026 (Usd Million)
9.2 Storage Management
Table 62 Storage Management Services Market Size, By Region, 2016–2020 (Usd Million)
Table 63 Storage Management Services Market Size, By Region, 2021–2026 (Usd Million)
9.3 Server Management
Table 64 Server Management Services Market Size, By Region, 2016–2020 (Usd Million)
Table 65 Server Management Services Market Size, By Region, 2021–2026 (Usd Million)
9.4 Managed Print Services
Table 66 Managed Print Services Market Size, By Region, 2016–2020 (Usd Million)
Table 67 Managed Print Services Market Size, By Region, 2021–2026 (Usd Million)
9.5 Other Managed Data Center And It Infrastructure Services
Table 68 Other Managed Data Center And It Infrastructure Services Market Size, By Region, 2016–2020 (Usd Million)
Table 69 Other Managed Data Center And It Infrastructure Services Market Size, By Region, 2021–2026 (Usd Million)
10 Managed Services Market, By Managed Communication And Collaboration Services
10.1 Introduction
Figure 39 The Managed Voice Over Internet Protocol Segment Is Projected To Grow At The Highest Cagr During The Forecast Period
10.1.1 Managed Communication And Collaboration Services Market Drivers
10.1.2 Covid-19 Impact On The Managed Communication And Collaboration Services Market
Table 70 Managed Communication And Collaboration Services Market Size, By Type, 2016–2020 (Usd Million)
Table 71 Managed Communication And Collaboration Services Market Size, By Type, 2021–2026 (Usd Million)
10.2 Managed Voice Over Internet Protocol (Voip)
Table 72 Managed Voice Over Internet Protocol Services Market Size, By Region, 2016–2020 (Usd Million)
Table 73 Managed Voice Over Internet Protocol Services Market Size, By Region, 2021–2026 (Usd Million)
10.3 Managed Unified Communication As A Service (Ucaas)
Table 74 Managed Unified Communication-As-A-Service Market Size, By Region, 2016–2020 (Usd Million)
Table 75 Managed Unified Communication-As-A-Service Market Size, By Region, 2021–2026 (Usd Million)
10.4 Other Managed Communication And Collaboration Services
Table 76 Other Managed Communication And Collaboration Services Market Size, By Region, 2016–2020 (Usd Million)
Table 77 Other Managed Communication And Collaboration Services Market Size, By Region, 2021–2026 (Usd Million)
11 Managed Services Market, By Managed Mobility Services
11.1 Introduction
Figure 40 The Application Management Services Segment Is Projected To Grow At A Higher Cagr During The Forecast Period
11.1.1 Managed Mobility Services Market Drivers
11.1.2 Covid-19 Impact On The Managed Mobility Services Market
Table 78 Managed Mobility Services Market Size, By Type, 2016–2020 (Usd Million)
Table 79 Managed Mobility Services Market Size, By Type, 2021–2026 (Usd Million)
11.2 Device Life Cycle Management
Table 80 Device Life Cycle Management Services Market Size, By Region, 2016–2020 (Usd Million)
Table 81 Device Life Cycle Management Services Market Size, By Region, 2021–2026 (Usd Million)
11.3 Application Management
Table 82 Application Management Services Market Size, By Region, 2016–2020 (Usd Million)
Table 83 Application Management Services Market Size, By Region, 2021–2026 (Usd Million)
12 Managed Services Market, By Managed Information Services
12.1 Introduction
Figure 41 The Business Process Management Segment Is Projected To Grow At A Higher Cagr During The Forecast Period
12.1.1 Managed Information Services Market Drivers
12.1.2 Covid-19 Impact On The Managed Information Services Market
Table 84 Managed Information Services Market Size, By Type, 2016–2020 (Usd Million)
Table 85 Managed Information Services Market Size, By Type, 2021–2026 (Usd Million)
12.2 Business Process Management
Table 86 Business Process Management Services Market Size, By Region, 2016–2020 (Usd Million)
Table 87 Business Process Management Services Market Size, By Region, 2021–2026 (Usd Million)
12.3 Managed Operational Support Systems/Business Support Systems
Table 88 Managed Operational Support Systems/Business Support Systems Market Size, By Region, 2016–2020 (Usd Million)
Table 89 Managed Operational Support Systems/Business Support Systems Market Size, By Region, 2021–2026 (Usd Million)
13 Managed Services Market, By Organization Size
13.1 Introduction
Figure 42 The Small And Medium-Sized Enterprises Segment Is Projected To Grow At A Higher Cagr During The Forecast Period
13.1.1 Market Drivers, By Organization Size
13.1.2 Covid-19 Impact On The Market, By Organization Size
Table 90 Managed Services Market Size, By Organization Size, 2016–2020 (Usd Million)
Table 91 Market Size, By Organization Size, 2021–2026 (Usd Million)
13.2 Large Enterprises
Table 92 Market Size In Large Enterprises, By Region, 2016–2020 (Usd Million)
Table 93 Market Size In Large Enterprises, By Region, 2021–2026 (Usd Million)
13.3 Small And Medium-Sized Enterprises
Table 94 Market Size In Small And Medium-Sized Enterprises, By Region, 2016–2020 (Usd Million)
Table 95 Market Size In Small And Medium-Sized Enterprises, By Region, 2021–2026 (Usd Million)
14 Managed Services Market, By Deployment Type
14.1 Introduction
Figure 43 The Cloud Segment To Grow At A Higher Cagr During The Forecast Period
14.1.1 Market Drivers, By Deployment Type
14.1.2 Covid-19 Impact On The Market, By Deployment Type
Table 96 Market Size, By Deployment Type, 2016–2020 (Usd Million)
Table 97 Market Size, By Deployment Type, 2021–2026 (Usd Million)
14.2 On-Premise
Table 98 On-Premise Market Size, By Region, 2016–2020 (Usd Million)
Table 99 On-Premise Market Size, By Region, 2021–2026 (Usd Million)
14.3 Cloud
Table 100 Cloud Market Size, By Region, 2016–2020 (Usd Million)
Table 101 Cloud Market Size, By Region, 2021–2026 (Usd Million)
15 Managed Services Market, By Vertical
15.1 Introduction
Figure 44 The Healthcare And Life Sciences Segment To Grow The Highest Cagr During The Forecast Period
15.1.1 Market Drivers, By Vertical
15.1.2 Covid-19 Impact On The Market, By Vertical
Table 102 Market Size, By Vertical, 2016–2020 (Usd Million)
Table 103 Market Size, By Vertical, 2021–2026 (Usd Million)
15.2 Banking, Financial Services, And Insurance
Table 104 Market Size In Banking, Financial Services And Insurance, By Region, 2016–2020 (Usd Million)
Table 105 Market Size In Banking, Financial Services And Insurance, By Region, 2021–2026 (Usd Million)
15.3 It And Telecom
Table 106 Market Size In It And Telecom, By Region, 2016–2020 (Usd Million)
Table 107 Market Size In It And Telecom, By Region, 2021–2026 (Usd Million)
15.4 Manufacturing
Table 108 Market Size In Manufacturing, By Region, 2016–2020 (Usd Million)
Table 109 Market Size In Manufacturing, By Region, 2021–2026 (Usd Million)
15.5 Retail And Consumer Goods
Table 110 Managed Services Market Size In Retail And Consumer Goods, By Region, 2016–2020 (Usd Million)
Table 111 Market Size In Retail And Consumer Goods, By Region, 2021–2026 (Usd Million)
15.6 Healthcare And Life Sciences
Table 112 Market Size In Healthcare And Life Sciences, By Region, 2016–2020 (Usd Million)
Table 113 Market Size In Healthcare And Life Sciences, By Region, 2021–2026 (Usd Million)
15.7 Government And Public Sector
Table 114 Market Size In Government And Public Sector, By Region, 2016–2020 (Usd Million)
Table 115 Market Size In Government And Public Sector, By Region, 2021–2026 (Usd Million)
15.8 Energy And Utilities
Table 116 Market Size In Energy And Utilities, By Region, 2016–2020 (Usd Million)
Table 117 Market Size In Energy And Utilities, By Region, 2021–2026 (Usd Million)
15.9 Media And Entertainment
Table 118 Market Size In Media And Entertainment, By Region, 2016–2020 (Usd Million)
Table 119 Market Size In Media And Entertainment, By Region, 2021–2026 (Usd Million)
15.10 Other Verticals
Table 120 Market Size In Other Verticals, By Region, 2016–2020 (Usd Million)
Table 121 Market Size In Other Verticals, By Region, 2021–2026 (Usd Million)
16 Managed Services Market, By Region
16.1 Introduction
Figure 45 Apac To Exhibit The Highest Growth Rate During The Forecast Period
Table 122 Market Size, By Region, 2016–2020 (Usd Million)
Table 123 Market Size, By Region, 2021–2026 (Usd Million)
16.2 North America
16.2.1 North America: Market Drivers
16.2.2 North America: Covid-19 Impact On The Market
Figure 46 North America: Market Snapshot
Table 124 North America: Market Size, By Service Type, 2016–2020 (Usd Million)
Table 125 North America: Managed Services Market Size, By Service Type, 2021–2026 (Usd Million)
Table 126 North America: Managed Security Services Market Size, By Type, 2016–2020 (Usd Million)
Table 127 North America: Managed Security Services Market Size, By Type, 2021–2026 (Usd Million)
Table 128 North America: Managed Network Services Market Size, By Type, 2016–2020 (Usd Million)
Table 129 North America: Managed Network Services Market Size, By Type, 2021–2026 (Usd Million)
Table 130 North America: Managed Data Center And It Infrastructure Services Market Size, By Type, 2016–2020 (Usd Million)
Table 131 North America: Managed Data Center And It Infrastructure Services Market Size, By Type, 2021–2026 (Usd Million)
Table 132 North America: Managed Communication And Collaboration Services Market Size, By Type, 2016–2020 (Usd Million)
Table 133 North America: Managed Communication And Collaboration Services Market Size, By Type, 2021–2026 (Usd Million)
Table 134 North America: Managed Mobility Services Market Size, By Type, 2016–2020 (Usd Million)
Table 135 North America: Managed Mobility Services Market Size, By Type, 2021–2026 (Usd Million)
Table 136 North America: Managed Information Services Market Size, By Type, 2016–2020 (Usd Million)
Table 137 North America: Managed Information Services Market Size, By Type, 2021–2026 (Usd Million)
Table 138 North America: Managed Services Market Size, By Organization Size, 2016–2020 (Usd Million)
Table 139 North America: Market Size, By Organization Size, 2021–2026 (Usd Million)
Table 140 North America: Market Size, By Deployment Type, 2016–2020 (Usd Million)
Table 141 North America: Market Size, By Deployment Type, 2021–2026 (Usd Million)
Table 142 North America: Market Size, By Vertical, 2016–2020 (Usd Million)
Table 143 North America: Market Size, By Vertical, 2021–2026 (Usd Million)
Table 144 North America: Market Size, By Country, 2016–2020 (Usd Million)
Table 145 North America: Market Size, By Country, 2021–2026 (Usd Million)
16.2.3 Us
16.2.4 Canada
16.3 Europe
16.3.1 Europe: Managed Services Market Drivers
16.3.2 Europe: Covid-19 Impact On The Market
Table 146 Europe: Market Size, By Service Type, 2016–2020 (Usd Million)
Table 147 Europe: Market Size, By Service Type, 2021–2026 (Usd Million)
Table 148 Europe: Managed Security Services Market Size, By Type, 2016–2020 (Usd Million)
Table 149 Europe: Managed Security Services Market Size, By Type, 2021–2026 (Usd Million)
Table 150 Europe: Managed Network Services Market Size, By Type, 2016–2020 (Usd Million)
Table 151 Europe: Managed Network Services Market Size, By Type, 2021–2026 (Usd Million)
Table 152 Europe: Managed Data Center And It Infrastructure Services Market Size, By Type, 2016–2020 (Usd Million)
Table 153 Europe: Managed Data Center And It Infrastructure Services Market Size, By Type, 2021–2026 (Usd Million)
Table 154 Europe: Managed Communication And Collaboration Services Market Size, By Type, 2016–2020 (Usd Million)
Table 155 Europe: Managed Communication And Collaboration Services Market Size, By Type, 2021–2026 (Usd Million)
Table 156 Europe: Managed Mobility Services Market Size, By Type, 2016–2020 (Usd Million)
Table 157 Europe: Managed Mobility Services Market Size, By Type, 2021–2026 (Usd Million)
Table 158 Europe: Managed Information Services Market Size, By Type, 2016–2020 (Usd Million)
Table 159 Europe: Managed Information Services Market Size, By Type, 2021–2026 (Usd Million)
Table 160 Europe: Managed Services Market Size, By Organization Size, 2016–2020 (Usd Million)
Table 161 Europe: Market Size, By Organization Size, 2021–2026 (Usd Million)
Table 162 Europe: Market Size, By Deployment Type, 2016–2020 (Usd Million)
Table 163 Europe: Market Size, By Deployment Type, 2021–2026 (Usd Million)
Table 164 Europe: Market Size, By Vertical, 2016–2020 (Usd Million)
Table 165 Europe: Market Size, By Vertical, 2021–2026 (Usd Million)
Table 166 Europe: Market Size, By Country, 2016–2020 (Usd Million)
Table 167 Europe: Market Size, By Country, 2021–2026 (Usd Million)
16.3.3 Uk
16.3.4 Germany
16.3.5 Rest Of Europe
16.4 Asia Pacific (Apac)
16.4.1 Apac: Managed Services Market Drivers
16.4.2 Apac: Covid-19 Impact On The Market
Figure 47 Apac: Market Snapshot
Table 168 Apac: Market Size, By Service Type, 2016–2020 (Usd Million)
Table 169 Apac: Market Size, By Service Type, 2021–2026 (Usd Million)
Table 170 Apac: Managed Security Services Market Size, By Type, 2016–2020 (Usd Million)
Table 171 Apac: Managed Security Services Market Size, By Type, 2021–2026 (Usd Million)
Table 172 Apac: Managed Network Services Market Size, By Type, 2016–2020 (Usd Million)
Table 173 Apac: Managed Network Services Market Size, By Type, 2021–2026 (Usd Million)
Table 174 Apac: Managed Data Center And It Infrastructure Services Market Size, By Type, 2016–2020 (Usd Million)
Table 175 Apac: Managed Data Center And It Infrastructure Services Market Size, By Type, 2021–2026 (Usd Million)
Table 176 Apac: Managed Communication And Collaboration Services Market Size, 2016–2020 (Usd Million)
Table 177 Apac: Managed Communication And Collaboration Services Market Size, By Type, 2021–2026 (Usd Million)
Table 178 Apac: Managed Mobility Services Market Size, By Type, 2016–2020 (Usd Million)
Table 179 Apac: Managed Mobility Services Market Size, By Type, 2021–2026 (Usd Million)
Table 180 Apac: Managed Information Services Market Size, By Type, 2016–2020 (Usd Million)
Table 181 Apac: Managed Information Services Market Size, By Type, 2021–2026 (Usd Million)
Table 182 Apac: Managed Services Market Size, By Organization Size, 2016–2020 (Usd Million)
Table 183 Apac: Market Size, By Organization Size, 2021–2026 (Usd Million)
Table 184 Apac: Market Size, By Deployment Type, 2016–2020 (Usd Million)
Table 185 Apac: Market Size, By Deployment Type, 2021–2026 (Usd Million)
Table 186 Apac: Market Size, By Vertical, 2016–2020 (Usd Million)
Table 187 Apac: Market Size, By Vertical, 2021–2026 (Usd Million)
Table 188 Apac: Market Size, By Country, 2016–2020 (Usd Million)
Table 189 Apac: Market Size, By Country, 2021–2026 (Usd Million)
16.4.3 China
16.4.4 Japan
16.4.5 Rest Of Apac
16.5 Middle East & Africa (Mea)
16.5.1 Mea: Market Drivers
16.5.2 Mea: Covid-19 Impact On The Market
Table 190 Mea: Market Size, By Service Type, 2016–2020 (Usd Million)
Table 191 Mea: Managed Services Market Size, By Service Type, 2021–2026 (Usd Million)
Table 192 Mea: Managed Security Services Market Size, By Type, 2016–2020 (Usd Million)
Table 193 Mea: Managed Security Services Market Size, By Type, 2021–2026 (Usd Million)
Table 194 Mea: Managed Network Services Market Size, By Type, 2016–2020 (Usd Million)
Table 195 Mea: Managed Network Services Market Size, By Type, 2021–2026 (Usd Million)
Table 196 Mea: Managed Data Center And It Infrastructure Services Market Size, By Type, 2016–2020 (Usd Million)
Table 197 Mea: Managed Data Center And It Infrastructure Services Market Size, By Type, 2021–2026 (Usd Million)
Table 198 Mea: Managed Communication And Collaboration Services Market Size, By Type, 2016–2020 (Usd Million)
Table 199 Mea: Managed Communication And Collaboration Services Market Size, By Type, 2021–2026 (Usd Million)
Table 200 Mea: Managed Mobility Services Market Size, By Type, 2016–2020 (Usd Million)
Table 201 Mea: Managed Mobility Services Market Size, By Type, 2021–2026 (Usd Million)
Table 202 Mea: Managed Information Services Market Size, By Type, 2016–2020 (Usd Million)
Table 203 Mea: Managed Information Services Market Size, By Type, 2021–2026 (Usd Million)
Table 204 Mea: Managed Services Market Size, By Organization Size, 2016–2020 (Usd Million)
Table 205 Mea: Market Size, By Organization Size, 2021–2026 (Usd Million)
Table 206 Mea: Market Size, By Deployment Type, 2016–2020 (Usd Million)
Table 207 Mea: Market Size, By Deployment Type, 2021–2026 (Usd Million)
Table 208 Mea: Market Size, By Vertical, 2016–2020 (Usd Million)
Table 209 Mea: Market Size, By Vertical, 2021–2026 (Usd Million)
Table 210 Mea: Market Size, By Country, 2016–2020 (Usd Million)
Table 211 Mea: Market Size, By Country, 2021–2026 (Usd Million)
16.5.3 Kingdom Of Saudi Arabia
16.5.4 Rest Of Mea
16.6 Latin America
16.6.1 Latin America: Market Drivers
16.6.2 Latin America: Covid-19 Impact On The Market
Table 212 Latin America: Market Size, By Service Type, 2016–2020 (Usd Million)
Table 213 Latin America: Managed Services Market Size, By Service Type, 2021–2026 (Usd Million)
Table 214 Latin America: Managed Security Services Market Size, By Type, 2016–2020 (Usd Million)
Table 215 Latin America: Managed Security Services Market Size, By Type, 2021–2026 (Usd Million)
Table 216 Latin America: Managed Network Services Market Size, By Type, 2016–2020 (Usd Million)
Table 217 Latin America: Managed Network Services Market Size, By Type, 2021–2026 (Usd Million)
Table 218 Latin America: Managed Data Center And It Infrastructure Services Market Size, By Type, 2016–2020 (Usd Million)
Table 219 Latin America: Managed Data Center And It Infrastructure Services Market Size, By Type, 2021–2026 (Usd Million)
Table 220 Latin America: Managed Communication And Collaboration Services Market Size, By Type, 2016–2020 (Usd Million)
Table 221 Latin America: Managed Communication And Collaboration Services Market Size, By Type, 2021–2026 (Usd Million)
Table 222 Latin America: Managed Mobility Services Market Size, By Type, 2016–2020 (Usd Million)
Table 223 Latin America: Managed Mobility Services Market Size, By Type, 2021–2026 (Usd Million)
Table 224 Latin America: Managed Information Services Market Size, By Type, 2016–2020 (Usd Million)
Table 225 Latin America: Managed Information Services Market Size, By Type, 2021–2026 (Usd Million)
Table 226 Latin America: Managed Services Market Size, By Organization Size, 2016–2020 (Usd Million)
Table 227 Latin America: Market Size, By Organization Size, 2021–2026 (Usd Million)
Table 228 Latin America: Market Size, By Deployment Type, 2016–2020 (Usd Million)
Table 229 Latin America: Market Size, By Deployment Type, 2021–2026 (Usd Million)
Table 230 Latin America: Market Size, By Vertical, 2016–2020 (Usd Million)
Table 231 Latin America: Market Size, By Vertical, 2021–2026 (Usd Million)
Table 232 Latin America: Market Size, By Country, 2016–2020 (Usd Million)
Table 233 Latin America: Market Size, By Country, 2021–2026 (Usd Million)
16.6.3 Brazil
16.6.4 Mexico
16.6.5 Rest Of Latin America
17 Competitive Landscape
17.1 Introduction
17.2 Market Evaluation Framework
Figure 48 Market Evaluation Framework, 2019–2021
17.3 Market Ranking
Figure 49 Top Five Players In The Managed Services Market, 2021
17.4 Market Share Analysis
Table 234 Market: Degree Of Competition
Figure 50 Market Share Analysis Of Companies In The Market
17.5 Historical Revenue Analysis Of Top Vendors
Figure 51 Historical Revenue Analysis, 2016–2020
17.6 Company Evaluation Matrix
17.6.1 Stars
17.6.2 Emerging Leaders
17.6.3 Pervasive Vendors
17.6.4 Participants
Table 235 Global Company Footprint
Table 236 Company Vertical Footprint (1/2)
Table 237 Company Vertical Footprint (2/2)
Table 238 Company Region Footprint
Table 239 Company Service Footprint
Figure 52 Global Company Evaluation Matrix, Managed Services Market
17.7 Competitive Scenario
Table 240 Managed Services: New Service Launches, June 2021–November 2019
Table 241 Managed Services: Deals, June 2021–January 2019
18 Company Profile
(Business Overview, Services Offered, Recent Developments & Mnm View)*
18.1 Key Players
18.1.1 Ibm
Table 242 Ibm: Business Overview
Figure 53 Ibm: Company Snapshot
Table 243 Ibm: Managed Services Market: New Launches
Table 244 Ibm: Market: Deals
18.1.2 Fujitsu
Table 245 Fujitsu: Business Overview
Figure 54 Fujitsu: Company Snapshot
Table 246 Fujitsu: Managed Services: New Launches
Table 247 Fujitsu: Managed Services: Deals
18.1.4 Atos
Table 251 Atos: Business Overview
Figure 56 Atos: Company Snapshot
Table 252 Atos: Managed Services: New Launches
Table 253 Atos: Managed Services: Deals
18.1.5 Cisco
Table 254 Cisco: Business Overview
Figure 57 Cisco: Company Snapshot
Table 255 Cisco: Managed Services: New Launches
Table 256 Cisco: Managed Services: Deals
18.1.6 Dxc
Table 257 Dxc: Business Overview
Figure 58 Dxc: Company Snapshot
Table 258 Dxc: Managed Services: New Launches
Table 259 Dxc: Managed Services: Deals
18.1.7 Tcs
Table 260 Tcs: Business Overview
Figure 59 Tcs: Company Snapshot
Table 261 Tcs: Managed Services: New Launches
Table 262 Tcs: Managed Services: Deals
18.1.8 Rackspace
Table 263 Rackspace: Business Overview
Figure 60 Rackspace: Company Snapshot
Table 264 Rackspace: Managed Services: New Launches
Table 265 Rackspace: Managed Services: Deals
18.1.9 At&T
Table 266 At&T: Business Overview
Figure 61 At&T: Company Snapshot
Table 267 At&T: Managed Services: New Launches
Table 268 At&T: Managed Services: Deals
18.1.10 Verizon
Table 269 Verizon: Business Overview
Figure 62 Verizon: Company Snapshot
Table 270 Verizon: Managed Services: New Launches
Table 271 Verizon: Managed Services: Deals
*Details On Business Overview, Services Offered, Recent Developments & Mnm View Might Not Be Captured In Case Of Unlisted Companies.
18.2 Other Players
18.2.1 Dimension Data
18.2.2 Infosys
18.2.3 Hcl
18.2.4 Ericssion
18.2.5 Gtt Communications
18.2.6 Ntt Data
18.2.7 Happiest Minds
18.2.8 Huawei
18.2.9 Nokia Networks
18.2.10 Centurylink
18.2.11 Wipro
18.2.12 Cognizant
18.2.13 Capgemini
18.2.14 Bt
18.2.15 Deloitte
18.2.16 Secureworks
18.2.17 Alert Logic
18.2.18 Bae Systems
18.2.19 Trustwave
18.2.20 Hughes
18.2.21 Mettel
18.2.22 Microland
18.2.23 Optanix
18.2.24 Essintial
18.2.25 Intact Tech
18.2.26 1-Net
18.2.27 Ascend Technologies
18.2.28 Securekloud
18.2.29 Aunalytics
18.2.30 Ac3
18.2.31 Cloud Specialists
18.2.32 Corsica Technologies
18.2.33 Empist
ReportsnReports.com is your single source for all market research needs. Our database includes 500,000+ market research reports from over 95 leading global publishers & in-depth market research studies of over 5000 micro markets.
+ 1 888 391 5441 sales@reportsandreports.com
This release was published on openPR.
Permanent link to this press release:
Copy
Please set a link in the press area of your homepage to this press release on openPR. openPR disclaims liability for any content contained in this release.
You can edit or delete your press release Global Managed Services Market with COVID-19 Impact Analysis, Key Players, Size, Share, Demands, Growth and Forecasts to 2026 here
News-ID: 2338785 • Views: …
More Releases from ReportsnReports

DeviceCon Series 2024 - UK Edition | MarketsandMarkets
Future Forward: Redefining Healthcare with Cutting-Edge Devices
Welcome to DeviceCon Series 2024 - Where Innovation Meets Impact!
Join us on March 21-22 at Millennium Gloucester Hotel, 4-18 Harrington Gardens, London SW7 4LH for a groundbreaking convergence of knowledge, ideas, and technology. MarketsandMarkets proudly presents the DeviceCon Series, an extraordinary blend of four conferences that promise to redefine the landscape of innovation in medical and diagnostic devices.
Register Now @ https://events.marketsandmarkets.com/devicecon-series-uk-edition-2024/register
MarketsandMarkets presents…

5th Annual MarketsandMarkets Infectious Disease and Molecular Diagnostics Confer …
London, March 7, 2024 - MarketsandMarkets is thrilled to announce the eagerly awaited 5th Annual Infectious Disease and Molecular Diagnostics Conference, scheduled to take place on March 21st - 22nd, 2024, at the prestigious Millennium Gloucester Hotel, located at 4-18 Harrington Gardens, London SW7 4LH.
This conference promises to be a groundbreaking event, showcasing the latest trends and insights in diagnosis, as well as unveiling cutting-edge technologies that are revolutionizing the…

Infection Control, Sterilization & Decontamination Conference |21st - 22nd March …
MarketsandMarkets is pleased to announce its 8th Annual Infection Control, Sterilisation, and Decontamination in Healthcare Conference, which will take place March 21-22, 2024, in London, UK. With the increased risk of infection due to improper sterilisation and decontamination practices, the safety of patients and healthcare workers is of paramount importance nowadays.
Enquire Now @ https://events.marketsandmarkets.com/infection-control-sterilization-and-decontamination-conference/
This conference aims to bring together all the stakeholders to discuss the obstacles in achieving…
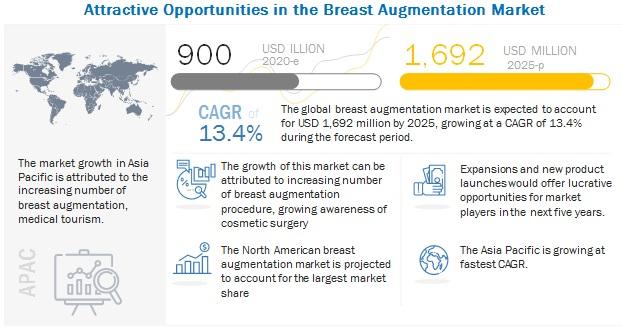
Breast Augmentation Market Key Players, Demands, Cost, Size, Procedure, Shape, S …
The global Breast Augmentation Market in terms of revenue was estimated to be worth $900 million in 2020 and is poised to reach $1,692 million by 2025, growing at a CAGR of 13.4% from 2020 to 2025. The new research study consists of an industry trend analysis of the market. The new research study consists of industry trends, pricing analysis, patent analysis, conference and webinar materials, key stakeholders, and buying…
More Releases for Table
Bedside Table With Over-Bed Table Market Size and Forecast
𝐔𝐒𝐀, 𝐍𝐞𝐰 𝐉𝐞𝐫𝐬𝐞𝐲- The global Bedside Table With Over-Bed Table Market is expected to record a CAGR of XX.X% from 2024 to 2031 In 2024, the market size is projected to reach a valuation of USD XX.X Billion. By 2031 the valuation is anticipated to reach USD XX.X Billion.
The global market for bedside tables with over-bed tables is experiencing significant growth due to the rising demand for multifunctional furniture. These…
Table Linen Market to Witness Revolutionary Growth by 2030 | IKEA, URQUILDLINEN, …
Global "Table Linen Market" Research report is an in-depth study of the market Analysis. Along with the most recent patterns and figures that uncovers a wide examination of the market offer. This report provides exhaustive coverage on geographical segmentation, latest demand scope, growth rate analysis with industry revenue and CAGR status. While emphasizing the key driving and restraining forces for this market, the report also offers a complete study of…
Table Tennis Table Market: Competitive Dynamics & Global Outlook 2024
LP INFORMATION offers a latest published report on Table Tennis Table Market Analysis and Forecast 2019-2025 delivering key insights and providing a competitive advantage to clients through a detailed report.
According to this study, over the next five years the Table Tennis Table market will register a xx% CAGR in terms of revenue, the global market size will reach US$ xx million by 2024, from US$ xx million in 2019.…
Table Linen Market Forecast 2017-2022: IKEA, URQUILDLINEN, Premier Table Linens, …
Global Table Linen Market Research Report
A market study ” Global Table Linen Market ” examines the performance of the Table Linen market 2017. It encloses an in-depth Research of the Table Linen market state and the competitive landscape globally. This report analyzes the potential of Table Linen market in the present and the future prospects from various angles in detail.
Inquiry For Sample Report, Click Here: http://bit.ly/2s0g8nd
The Global Table Linen Market…
Global and Chinese Table Tennis Table Market Demand Growth Report 2017
Research carried out a market study on the Table Tennis Table market. The report titled, “Table Tennis Table ”, is an in-depth analysis of the Table Tennis Table market and offers important insights related to the market such as market share, size and growth. The presented study discusses the current trends, opportunities and the challenges in the Table Tennis Table market. Key statistics, growth prospects and the current status…
Billiard Table Manufacturer, Pool Table Supplies
Chevillotte Billiards manufactures the highest standard quality billiards table in the world. Our manufacturing facility has been making billiard table and it's accessories since the 1860's and earned a lots of name and respects in the billiards industry. We manufacture our billiards products as per the requirements of the clients and also assist customized solutions to them. Our range is designed as per the latest market trends and is ideal…
