Press release
Smart Buildings Market Global Key Players Analysis- 75F (US), ABB (Switzerland), Aquicore (US), Bosch (US), BuildingIQ (US), Cisco (US), CopperTree Analytics (Canada), ENTOUCH (US), Hitachi (Japan), Honeywell (US), Huawei (China), IBM (US), Igor (US), Int
The smart buildings market is projected to grow from USD 66.3 billion in 2020 to USD 108.9 billion by 2025, at a Compound Annual Growth Rate (CAGR) of 10.5% during the forecast period. Rising adoption of IoT-enabled building management system, rising awareness of space utilization, increased industry standards and regulations, and increase demand for energy efficient system.Rising adoption of IoT-enabled building management system and raising awareness of space utilization to drive the growth of the market across the globe. However, the lack of cooperation among standard bodies and uniform technology among smart building solutions and high cost of implementation is expected to restrict the growth of the market across the globe.
The major vendors covered in the Smart buildings market include 75F (US), ABB (Switzerland), Aquicore (US), Bosch (US), BuildingIQ (US), Cisco (US), CopperTree Analytics (Canada), ENTOUCH (US), Hitachi (Japan), Honeywell (US), Huawei (China), IBM (US), Igor (US), Intel (US), Johnson Controls (Ireland), KMC Controls (US), Legrand (France), Mode:Green (US), PTC (US), Schneider Electric (Germany), Siemens (Germany), Softdel (US), Spaceti (Czechia), Telit (UK), and Verdigris Technologies (US).
Get a Free Sample Copy of this Research Report at https://www.reportsnreports.com/contacts/requestsample.aspx?name=267717
Based on solution type, the energy management segment is expected to grow with the fastest growth rate during the forecast period
The energy management segment is projected to grow with the most rapid growth rate in 2020 to 2025. Energy management solutions for smart building help to reduce and monitor the energy consumption of the building. Keeping operational expenses low is a continuous challenge for owners and managers of multistory buildings, schools, or building complexes. Some of the infrastructure available for managing energy in buildings is designed for large systems and not for managers with smaller budgets, resulting in high costs of adoption and integration.
Based on building type, the commercial building segment is expected to lead the Smart buildings market in 2020.
The commercial building segment is expected to lead the smart buildings market in 2020. Energy performance of commercial buildings is a significant challenge for the commercial sector as these buildings consume higher energy and also generate more waste in the form of carbon and other solid wastes. Therefore, appropriate and tailor-made solutions are needed for optimized energy performance to reduce building energy consumption without compromising comfort or security.
The Asia Pacific (APAC) smart buildings market is projected to grow at the highest CAGR during the forecast period.
The APAC smart buildings market is projected to grow at the highest CAGR during the forecast period. The growth of the market in Asia Pacific can be attributed to innovative building technologies are getting traction in the APAC region due to presence of various smart buildings market vendors to use such technology for gaining competitive advantage. Multiple governments in this region have started promoting smart building practices due to rising environmental concerns and the growing need for energy savings. For instance, China has invested heavily into over 2,500 green building projects, and Singapore has decided to aim for 80% cent of its buildings to be certified as Green, under its Green Mark scheme by 2030.
In-depth interviews were conducted with Chief Executive Officers (CEOs), marketing directors, innovation and technology directors, and executives from various key organizations operating in the Smart buildings market.
Get 20% Discount on this Research Report at https://www.reportsnreports.com/contacts/discount.aspx?name=267717
The breakup of the profiles of the primary participants is given below:
• By Company Type: Tier 1 – 62%, Tier 2 – 23%, and Tier 3 – 15%
• By Designation: C-level – 38%, Directors – 30%, and Others – 32%
• By Region: North America – 40%, Europe – 15%, Asia Pacific – 35%, Middle East and Africa – 5%, Latin America – 5%
Research coverage
The market study covers the Smart buildings market across different segments. It aims at estimating the market size and the growth potential of this market across different segments based on component ( solutions and services), building type, and region. The study also includes an in-depth competitive analysis of the key market players, along with their company profiles, key observations related to product and business offerings, recent developments, and key market strategies.
Key benefits of buying the report
The report will help the market leaders/new entrants with information on the closest approximations of the revenue numbers for the global digital payment market and its sub segments. This report will help stakeholders understand the competitive landscape and gain more insights to position their businesses better and to plan suitable go-to-market strategies. Moreover, the report will provide insights for stakeholders to understand the pulse of the market and provide them with information on key market drivers, restraints, challenges, and opportunities.
Table Of Contents
1 Introduction
1.1 Introduction To Covid-19
1.2 Covid-19 Health Assessment
Figure 1 Covid-19: Global Propagation
Figure 2 Covid-19 Propagation: Select Countries
1.3 Covid-19 Economic Assessment
Figure 3 Revised Gross Domestic Product Forecasts For Select G20 Countries In 2020
1.3.1 Covid-19 Economic Impact—Scenario Assessment
Figure 4 Criteria Impacting Global Economy
Figure 5 Scenarios In Terms Of Recovery Of Global Economy
1.4 Objectives Of The Study
1.5 Market Definition
1.5.1 Inclusions And Exclusions
1.6 Market Scope
1.6.1 Market Segmentation
1.6.2 Regions Covered
1.6.3 Years Considered For The Study
1.7 Currency Considered
Table 1 United States Dollar Exchange Rate, 2017–2019
1.8 Stakeholders
1.9 Summary Of Changes
Direct Purchase of this Research Report at https://www.reportsnreports.com/purchase.aspx?name=267717
2 Research Methodology
2.1 Research Data
Figure 6 Smart Buildings Market: Research Design
2.1.1 Secondary Data
2.1.2 Primary Data
2.1.2.1 Breakup Of Primary Profiles
Table 2 Primary Interviews
2.1.2.2 Key Industry Insights
2.2 Market Breakup And Data Triangulation
Figure 7 Data Triangulation
2.3 Market Size Estimation
2.3.1 Top-Down Approach
Figure 8 Smart Buildings Market Size Estimation: Top-Down Approach (Share Of Smart Buildings Market Of Overall Smart Cities Market)
2.3.2 Bottom-Up Approach
Figure 9 Market Size Estimation: Bottom-Up Approach - Supply-Side Analysis
2.4 Market Forecast
Table 3 Factor Analysis
2.5 Assumptions For The Study
2.6 Limitations Of The Study
3 Executive Summary
Figure 10 Smart Buildings Market, 2017–2025 (Usd Million)
Figure 11 Top Three Leading Segments In Market In 2020
Figure 12 Market, Regional And Country-Wise Shares, 2020
4 Premium Insights
4.1 Attractive Opportunities In Smart Buildings Market
Figure 13 Rising Adoption Of Iot-Enabled Building Management Systems To Drive Market Growth
4.2 Market, By Component
Figure 14 Solutions Segment To Lead Market Growth In 2020
4.3 Market, By Solution
Figure 15 Safety And Security Management Segment To Hold Highest Market Share During Forecast Period
4.4 Market, By Service
Figure 16 Implementation Segment To Hold Highest Market Share During Forecast Period
4.5 Smart Buildings Market, By Building Type
Figure 17 Commercial Segment To Lead Market Growth During 2020–2025
4.6 Market, By Region
Figure 18 Asia Pacific To Grow At Fastest Growth Rate During Forecast Period
4.7 Market, By Country
Figure 19 China And Japan To Account For High Growth During Forecast Period
5 Market Overview And Industry Trends
5.1 Introduction
5.2 Market Dynamics
Figure 20 Drivers, Restraints, Opportunities, And Challenges: Smart Buildings Market
5.2.1 Drivers
5.2.1.1 Rising Adoption Of Iot-Enabled Bms
Figure 21 Growth In Iot Deployments Worldwide For Commercial Real Estate, 2015—2020
5.2.1.2 Increasing Awareness Of Space Utilization
Figure 22 Average Office Vacancy Rate Across Office/Admin Space
5.2.1.3 Increased Industry Standards And Regulations
5.2.1.4 Increased Demand For Energy-Efficient Systems
5.2.2 Restraints
5.2.2.1 Lack Of Cooperation Among Standard Bodies
5.2.2.2 High Cost Of Implementation
5.2.3 Opportunities
5.2.3.1 Emergence Of The 5g Technology
5.2.3.2 Rise In The Smart City Trend
5.2.3.3 Government Initiatives And Incentives
5.2.4 Challenges
5.2.4.1 Lack Of Technology Alignment And Skilled Professionals
5.2.4.2 Rise In Privacy And Security Concerns Due To Iot-Enabled Devices
5.3 Covid-19 Market Outlook For Smart Building Market
Table 4 Smart Buildings Market: Analysis Of Drivers And Opportunities In The Covid-19 Era
Table 5 Smart Buildings Solutions: Analysis Of Challenges And Restraints In The Covid-19 Era
5.3.1 Cumulative Growth Analysis
Table 6 Market: Cumulative Growth Analysis
5.4 Market: Ecosystem
Figure 23 Smart Buildings Ecosystem
5.5 Market: Value Chain
Figure 24 Smart Buildings Value Chain
5.6 Smart Buildings Market: Regulations
5.6.1 Bacnet—Data Communication Protocol For Building Automation And Control Networks
5.6.2 Knx
5.6.3 Digital Addressable Lighting Interface
5.6.4 General Data Protection Regulation
5.6.5 Modbus
5.6.6 Cloud Standard Customer Council
5.7 Smart Buildings Market: Patent Analysis
Table 7 Smart/Intelligent Building Patent Applications
Figure 25 Smart/Intelligent Building-Related Patents, By Country, 2017—2020
Figure 26 Smart Home Patents As To Year Of Application, 2006—2020
Figure 27 Top 15 Smart Home Patent Applicants
5.8 Smart Buildings Market: Average Selling Price
Table 8 Smart Building Solution/Software Pricing Analysis
5.9 Market: Porter’s Five Forces
Figure 28 Porter’s Five Forces Analysis Of Market
5.10 Case Studies
5.11 Impact Of Disruptive Technologies
5.11.1 Internet Of Things
5.11.2 Artificial Intelligence And Machine Learning
5.11.3 Building Information Modeling
6 Smart Buildings Market, By Component
6.1 Introduction
Figure 29 Solutions Segment To Account For Larger Market Size During Forecast Period
Table 9 Market Size, By Component, 2017–2019 (Usd Million)
Table 10 Market Size, By Component, 2019–2025 (Usd Million)
6.2 Solutions
6.2.1 Solutions: Market Drivers
6.2.2 Solutions: Covid-19 Impact
Table 11 Solutions: Market Size, By Region, 2017–2019 (Usd Million)
Table 12 Solutions: Market Size, By Region, 2019–2025 (Usd Million)
Figure 30 Safety And Security Management Segment To Account For Largest Market Size During Forecast Period
Table 13 Solutions: Smart Buildings Market Size, By Type, 2017–2019 (Usd Million)
Table 14 Solutions: Market Size, By Type, 2019–2025 (Usd Million)
6.2.3 Building Infrastructure Management
Table 15 Building Infrastructure Management: Market Size, By Region, 2017–2019 (Usd Million)
Table 16 Building Infrastructure Management: Market Size, By Region, 2019–2025 (Usd Million)
Table 17 Building Infrastructure Management: Market Size, By Type, 2017–2019 (Usd Million)
Table 18 Building Infrastructure Management: Smart Buildings Market Size, By Type, 2019–2025 (Usd Million)
6.2.3.1 Parking Management System
Table 19 Parking Management System Market Size, By Region, 2017–2019 (Usd Million)
Table 20 Parking Management System Market Size, By Region, 2019–2025 (Usd Million)
6.2.3.2 Smart Water Management System
Table 21 Smart Water Management System Market Size, By Region, 2017–2019 (Usd Million)
Table 22 Smart Water Management System Market Size, By Region, 2019–2025 (Usd Million)
6.2.3.3 Elevators And Escalators Management System
Table 23 Elevators And Escalators Management Market Size, By Region, 2017–2019 (Usd Million)
Table 24 Elevators And Escalators Management Market Size, By Region, 2019–2025 (Usd Million)
6.2.4 Safety And Security Management
Table 25 Safety And Security Management: Smart Buildings Market Size, By Region, 2017–2019 (Usd Million)
Table 26 Safety And Security Management Market Size, By Region, 2019–2025 (Usd Million)
Table 27 Safety And Security Management: Market Size, By Type, 2017–2019 (Usd Million)
Table 28 Safety And Security Management: Market Size, By Type, 2019–2025 (Usd Million)
6.2.4.1 Access Control System
Table 29 Access Control System Market Size, By Region, 2017–2019 (Usd Million)
Table 30 Access Control System Market Size, By Region, 2019–2025 (Usd Million)
6.2.4.2 Video Surveillance System
Table 31 Video Surveillance System Market Size, By Region, 2017–2019 (Usd Million)
Table 32 Video Surveillance System Market Size, By Region, 2019–2025 (Usd Million)
6.2.4.3 Fire And Life Safety System
Table 33 Fire And Life Safety System Market Size, By Region, 2017–2019 (Usd Million)
Table 34 Fire And Life Safety System Market Size, By Region, 2019–2025 (Usd Million)
6.2.5 Energy Management
Table 35 Energy Management: Smart Buildings Market Size, By Region, 2017–2019 (Usd Million)
Table 36 Energy Management: Market Size, By Region, 2019–2025 (Usd Million)
Table 37 Energy Management: Market Size, By Type, 2017–2019 (Usd Million)
Table 38 Energy Management: Market Size, By Type, 2019–2025 (Usd Million)
6.2.5.1 Hvac Control System
Table 39 Hvac Control System Market Size, By Region, 2017–2019 (Usd Million)
Table 40 Hvac Control System Market Size, By Region, 2019–2025 (Usd Million)
6.2.5.2 Lighting Management System
Table 41 Lighting Management System Market Size, By Region, 2017–2019 (Usd Million)
Table 42 Lighting Management System Market Size, By Region, 2019–2025 (Usd Million)
6.2.6 Network Management
Table 43 Network Management: Smart Buildings Market Size, By Region, 2017–2019 (Usd Million)
Table 44 Network Management: Market Size, By Region, 2019–2025 (Usd Million)
6.2.7 Integrated Workplace Management System
Table 45 Integrated Workplace Management System: Market Size, By Region, 2017–2019 (Usd Million)
Table 46 Integrated Workplace Management System: Market Size, By Region, 2019–2025 (Usd Million)
6.3 Services
6.3.1 Services: Smart Buildings Market Drivers
6.3.2 Services: Covid-19 Impact
Table 47 Services: Market Size, By Region, 2017–2019 (Usd Million)
Table 48 Services: Market Size, By Region, 2019–2025 (Usd Million)
Figure 31 Implementation Segment To Account For Largest Market Size During Forecast Period
Table 49 Services: Market Size, By Type, 2017–2019 (Usd Million)
Table 50 Services: Market Size, By Type, 2019–2025 (Usd Million)
6.3.3 Consulting
Table 51 Consulting: Market Size, By Region, 2017–2019 (Usd Million)
Table 52 Consulting: Market Size, By Region, 2019–2025 (Usd Million)
6.3.4 Implementation
Table 53 Implementation: Smart Buildings Market Size, By Region, 2017–2019 (Usd Million)
Table 54 Implementation: Market Size, By Region, 2019–2025 (Usd Million)
6.3.5 Support And Maintenance
Table 55 Support And Maintenance: Market Size, By Region, 2017–2019 (Usd Million)
Table 56 Support And Maintenance: Market Size, By Region, 2019–2025 (Usd Million)
7 Smart Buildings Market, By Building Type
7.1 Introduction
Figure 32 Commercial Segment To Account For Largest Market Size During Forecast Period
Table 57 Market Size, By Building Type, 2017–2019 (Usd Million)
Table 58 Market Size, By Building Type, 2019–2025 (Usd Million)
7.2 Residential
7.2.1 Residential: Market Drivers
7.2.2 Residential: Covid-19 Impact
Table 59 Residential: Market Size, By Region, 2017–2019 (Usd Million)
Table 60 Residential: Market Size, By Region, 2019–2025 (Usd Million)
7.3 Commercial
7.3.1 Commercial: Smart Buildings Market Drivers
7.3.2 Commercial: Covid-19 Impact
Table 61 Commercial: Market Size, By Region, 2017–2019 (Usd)
Table 62 Commercial: Market Size, By Region, 2019–2025 (Usd Million)
7.4 Industrial
7.4.1 Industrial: Market Drivers
7.4.2 Industrial: Covid-19 Impact
Table 63 Industrial: Market Size, By Region, 2017–2019 (Usd Million)
Table 64 Industrial: Market Size, By Region, 2019–2025 (Usd Million)
8 Smart Buildings Market, By Region
8.1 Introduction
Figure 33 Asia Pacific To Exhibit Highest Cagr In Market During Forecast Period
Figure 34 North America To Hold Largest Market Size During Forecast Period
Table 65 Market Size, By Region, 2017–2019 (Usd Million)
Table 66 Market Size, By Region, 2019–2025 (Usd Million)
8.2 North America
8.2.1 North America: Market Drivers
8.2.2 North America: Covid-19 Impact
Figure 35 North America: Market Snapshot
Table 67 North America: Smart Buildings Market Size, By Component, 2017–2019 (Usd Million)
Table 68 North America: Market Size, By Component, 2019–2025 (Usd Million)
Table 69 North America: Market Size, By Solution, 2017–2019 (Usd Million)
Table 70 North America: Market Size, By Solution, 2019–2025 (Usd Million)
Table 71 North America: Market Size, By Building Infrastructure Management, 2017–2019 (Usd Million)
Table 72 North America: Market Size, By Building Infrastructure Management, 2019–2025 (Usd Million)
Table 73 North America: Market Size, By Safety And Security Management, 2017–2019 (Usd Million)
Table 74 North America: Market Size, By Safety And Security Management, 2019–2025 (Usd Million)
Table 75 North America: Smart Buildings Market Size, By Energy Management, 2017–2019 (Usd Million)
Table 76 North America: Market Size, By Energy Management, 2019–2025 (Usd Million)
Table 77 North America: Market Size, By Service, 2017–2019 (Usd Million)
Table 78 North America: Market Size, By Service, 2019–2025 (Usd Million)
Table 79 North America: Market Size, By Building Type, 2017–2019 (Usd Million)
Table 80 North America: Market Size, By Building Type, 2019–2025 (Usd Million)
Table 81 North America: Market Size, By Country, 2017–2019 (Usd Million)
Table 82 North America: Market Size, By Country, 2019–2025 (Usd Million)
8.2.3 United States
Table 83 United States: Smart Buildings Market Size, By Component, 2017–2019 (Usd Million)
Table 84 United States: Market Size, By Component, 2019–2025 (Usd Million)
Table 85 United States: Market Size, By Solution, 2017–2019 (Usd Million)
Table 86 United States: Market Size, By Solution, 2019–2025 (Usd Million)
Table 87 United States: Market Size, By Service, 2017–2019 (Usd Million)
Table 88 United States: Market Size, By Service, 2019–2025 (Usd Million)
Table 89 United States: Market Size, By Building Type, 2017–2019 (Usd Million)
Table 90 United States: Market Size, By Building Type, 2019–2025 (Usd Million)
8.2.4 Canada
Table 91 Canada: Smart Buildings Market Size, By Component, 2017–2019 (Usd Million)
Table 92 Canada: Market Size, By Component, 2019–2025 (Usd Million)
Table 93 Canada: Market Size, By Solution, 2017–2019 (Usd Million)
Table 94 Canada: Market Size, By Solution, 2019–2025 (Usd Million)
Table 95 Canada: Market Size, By Service, 2017–2019 (Usd Million)
Table 96 Canada: Market Size, By Service, 2019–2025 (Usd Million)
Table 97 Canada: Market Size, By Building Type, 2017–2019 (Usd Million)
Table 98 Canada: Market Size, By Building Type, 2019–2025 (Usd Million)
8.3 Europe
8.3.1 Europe: Smart Buildings Market Drivers
8.3.2 Europe: Covid-19 Impact
Table 99 Europe: Market Size, By Component, 2017–2019 (Usd Million)
Table 100 Europe: Market Size, By Component, 2019–2025 (Usd Million)
Table 101 Europe: Market Size, By Solution, 2017–2019 (Usd Million)
Table 102 Europe: Market Size, By Solution, 2019–2025 (Usd Million)
Table 103 Europe: Market Size, By Building Infrastructure Management, 2017–2019 (Usd Million)
Table 104 Europe: Market Size, By Building Infrastructure Management, 2019–2025 (Usd Million)
Table 105 Europe: Market Size, By Safety And Security Management, 2017–2019 (Usd Million)
Table 106 Europe: Market Size, By Safety And Security Management, 2019–2025 (Usd Million)
Table 107 Europe: Smart Buildings Market Size, By Energy Management, 2017–2019 (Usd Million)
Table 108 Europe: Market Size, By Energy Management, 2019–2025 (Usd Million)
Table 109 Europe: Market Size, By Service, 2017–2019 (Usd Million)
Table 110 Europe: Market Size, By Service, 2019–2025 (Usd Million)
Table 111 Europe: Market Size, By Building Type, 2017–2019 (Usd Million)
Table 112 Europe: Market Size, By Building Type, 2019–2025 (Usd Million)
Table 113 Europe: Market Size, By Country, 2017–2019 (Usd Million)
Table 114 Europe: Market Size, By Country, 2019–2025 (Usd Million)
8.3.3 United Kingdom
Table 115 United Kingdom: Smart Buildings Market Size, By Component, 2017–2019 (Usd Million)
Table 116 United Kingdom: Market Size, By Component, 2019–2025 (Usd Million)
Table 117 United Kingdom: Market Size, By Solution, 2017–2019 (Usd Million)
Table 118 United Kingdom: Market Size, By Solution, 2019–2025 (Usd Million)
Table 119 United Kingdom: Market Size, By Service, 2017–2019 (Usd Million)
Table 120 United Kingdom: Market Size, By Service, 2019–2025 (Usd Million)
Table 121 United Kingdom: Market Size, By Building Type, 2017–2019 (Usd Million)
Table 122 United Kingdom: Market Size, By Building Type, 2019–2025 (Usd Million)
8.3.4 Germany
Table 123 Germany: Smart Buildings Market Size, By Component, 2017–2019 (Usd Million)
Table 124 Germany: Market Size, By Component, 2019–2025 (Usd Million)
Table 125 Germany: Market Size, By Solution, 2017–2019 (Usd Million)
Table 126 Germany: Market Size, By Solution, 2019–2025 (Usd Million)
Table 127 Germany: Market Size, By Service, 2017–2019 (Usd Million)
Table 128 Germany: Market Size, By Service, 2019–2025 (Usd Million)
Table 129 Germany: Market Size, By Building Type, 2017–2019 (Usd Million)
Table 130 Germany: Market Size, By Building Type, 2019–2025 (Usd Million)
8.3.5 Rest Of Europe
8.4 Asia Pacific
8.4.1 Asia Pacific: Smart Buildings Market Drivers
8.4.2 Asia Pacific: Covid-19 Impact
Figure 36 Asia Pacific: Market Snapshot
Table 131 Asia Pacific: Market Size, By Component, 2017–2019 (Usd Million)
Table 132 Asia Pacific: Market Size, By Component, 2019–2025 (Usd Million)
Table 133 Asia Pacific: Market Size, By Solution, 2017–2019 (Usd Million)
Table 134 Asia Pacific: Market Size, By Solution, 2019–2025 (Usd Million)
Table 135 Asia Pacific: Market Size, By Building Infrastructure Management, 2017–2019 (Usd Million)
Table 136 Asia Pacific: Market Size, By Building Infrastructure Management, 2019–2025 (Usd Million)
Table 137 Asia Pacific: Market Size, By Safety And Security Management, 2017–2019 (Usd Million)
Table 138 Asia Pacific: Smart Buildings Market Size, By Safety And Security Management, 2019–2025 (Usd Million)
Table 139 Asia Pacific: Market Size, By Energy Management, 2017–2019 (Usd Million)
Table 140 Asia Pacific: Market Size, By Energy Management, 2019–2025 (Usd Million)
Table 141 Asia Pacific: Market Size, By Service, 2017–2019 (Usd Million)
Table 142 Asia Pacific: Market Size, By Service, 2019–2025 (Usd Million)
Table 143 Asia Pacific: Market Size, By Building Type, 2017–2019 (Usd Million)
Table 144 Asia Pacific: Market Size, By Building Type, 2019–2025 (Usd Million)
Table 145 Asia Pacific: Market Size, By Country, 2017–2019 (Usd Million)
Table 146 Asia Pacific: Market Size, By Country, 2019–2025 (Usd Million)
8.4.3 China
8.4.4 Japan
8.4.5 Australia
8.4.6 Rest Of Asia Pacific
8.5 Middle East And Africa
8.5.1 Middle East And Africa: Smart Buildings Market Drivers
8.5.2 Middle East And Africa: Covid-19 Impact
Table 147 Middle East And Africa: Market Size, By Component, 2017–2019 (Usd Million)
Table 148 Middle East And Africa: Market Size, By Component, 2019–2025 (Usd Million)
Table 149 Middle East And Africa: Market Size, By Solution, 2017–2019 (Usd Million)
Table 150 Middle East And Africa: Market Size, By Solution, 2019–2025 (Usd Million)
Table 151 Middle East And Africa: Market Size, By Building Infrastructure Management, 2017–2019 (Usd Million)
Table 152 Middle East And Africa: Market Size, By Building Infrastructure Management, 2019–2025 (Usd Million)
Table 153 Middle East And Africa: Market Size, By Safety And Security Management, 2017–2019 (Usd Million)
Table 154 Middle East And Africa: Market Size, By Safety And Security Management, 2019–2025 (Usd Million)
Table 155 Middle East And Africa: Smart Buildings Market Size, By Energy Management, 2017–2019 (Usd Million)
Table 156 Middle East And Africa: Market Size, By Energy Management, 2019–2025 (Usd Million)
Table 157 Middle East And Africa: Market Size, By Service, 2017–2019 (Usd Million)
Table 158 Middle East And Africa: Market Size, By Service, 2019–2025 (Usd Million)
Table 159 Middle East And Africa: Market Size, By Building Type, 2017–2019 (Usd Million)
Table 160 Middle East And Africa: Market Size, By Building Type, 2019–2025 (Usd Million)
Table 161 Middle East And Africa: Market Size, By Country, 2017–2019 (Usd Million)
Table 162 Middle East And Africa: Market Size, By Country, 2019–2025 (Usd Million)
8.5.3 Kingdom Of Saudi Arabia
8.5.4 United Arab Emirates
8.5.5 Rest Of Middle East And Africa
8.6 Latin America
8.6.1 Latin America: Smart Buildings Market Drivers
8.6.2 Latin America: Covid-19 Impact
Table 163 Latin America: Market Size, By Component, 2017–2019 (Usd Million)
Table 164 Latin America: Market Size, By Component, 2019–2025 (Usd Million)
Table 165 Latin America: Market Size, By Solution, 2017–2019 (Usd Million)
Table 166 Latin America: Market Size, By Solution, 2019–2025 (Usd Million)
Table 167 Latin America: Market Size, By Building Infrastructure Management, 2017–2019 (Usd Million)
Table 168 Latin America: Market Size, By Building Infrastructure Management, 2019–2025 (Usd Million)
Table 169 Latin America: Market Size, By Safety And Security Management, 2017–2019 (Usd Million)
Table 170 Latin America: Market Size, By Safety And Security Management, 2019–2025 (Usd Million)
Table 171 Latin America: Smart Buildings Market Size, By Energy Management, 2017–2019 (Usd Million)
Table 172 Latin America: Market Size, By Energy Management, 2019–2025 (Usd Million)
Table 173 Latin America: Market Size, By Service, 2017–2019 (Usd Million)
Table 174 Latin America: Market Size, By Service, 2019–2025 (Usd Million)
Table 175 Latin America: Market Size, By Building Type, 2017–2019 (Usd Million)
Table 176 Latin America: Market Size, By Building Type, 2019–2025 (Usd Million)
Table 177 Latin America: Market Size, By Country, 2017–2019 (Usd Million)
Table 178 Latin America: Market Size, By Country, 2019–2025 (Usd Million)
8.6.3 Brazil
8.6.4 Mexico
8.6.5 Rest Of Latin America
9 Competitive Landscape
9.1 Overview
9.2 Market Evaluation Framework
Figure 37 Market Evaluation Framework, 2018–2020
9.3 Key Market Developments
9.3.1 New Product Launches And Product Enhancements
Table 179 New Product Launches And Product Enhancements, 2018–2020
9.3.2 Partnerships, Collaborations, And Agreements
Table 180 Partnerships, Collaborations, And Agreements, 2018–2020
9.3.3 Mergers And Acquisitions
Table 181 Mergers And Acquisitions, 2018–2020
9.3.4 Business Expansions
Table 182 Business Expansions, 2019–2020
9.4 Revenue Analysis Of Top Market Players
Figure 38 Revenue Analysis Of Smart Buildings Market
9.5 Historical Revenue Analysis
Figure 39 Historical Three-Year Revenue Analysis Of Leading Players
9.6 Company Evaluation Matrix
9.6.1 Company Evaluation Matrix Methodology And Definitions
Figure 40 Company Evaluation Matrix: Criteria Weightage
9.6.2 Star
9.6.3 Emerging Leaders
9.6.4 Pervasive
9.6.5 Participants
Figure 41 Market (Global), Company Evaluation Matrix, 2020
Figure 42 Product Portfolio Analysis Of Top Players In The Market
Figure 43 Business Strategy Excellence Analysis Of Top Players In The Smart Buildings Market
9.7 Ranking Of Key Players
Figure 44 Ranking Of Key Players In Smart Buildings Market, 2020
9.8 Startup/Sme Evaluation Matrix Methodology And Definitions
Figure 45 Startup/Sme Evaluation Matrix: Criteria Weightage
9.8.1 Progressive Companies
9.8.2 Responsive Companies
9.8.3 Dynamic Companies
9.8.4 Starting Blocks
Figure 46 Smart Buildings Market (Global): Startup/ Sme Evaluation Matrix, 2020
10 Company Profiles
10.1 Introduction
(Business Overview, Solutions And Services Offered, Recent Developments, Response To Covid-19 & Mnm View)*
10.2 Cisco
Figure 47 Cisco: Company Snapshot
10.3 Honeywell
Figure 48 Honeywell: Company Snapshot
10.4 Johnson Controls
Figure 49 Johnson Controls: Company Snapshot
10.5 Siemens
Figure 50 Siemens: Company Snapshot
10.6 Ibm
Figure 51 Ibm: Company Snapshot
10.7 Hitachi
Figure 52 Hitachi: Company Snapshot
10.8 Schneider Electric
Figure 53 Schneider Electric: Company Snapshot
10.9 Intel
Figure 54 Intel: Company Snapshot
10.10 Huawei
Figure 55 Huawei: Company Snapshot
10.11 Abb
Figure 56 Abb: Company Snapshot
10.12 Legrand
Figure 57 Legrand: Company Snapshot
10.13 Bosch
Figure 58 Bosch: Company Snapshot
10.14 Telit
Figure 59 Telit: Company Snapshot
10.15 Ptc
Figure 60 Ptc: Company Snapshot
10.16 Kmc Controls
10.17 Verdigris Technologies
10.18 Acquicore
10.19 75f
10.20 Buildingiq
10.21 Entouch
10.22 Softdel
10.23 Mode:Green
10.24 Coppertree Analytics
10.25 Spaceti
10.26 Igor
*Details On Business Overview, Solutions And Services Offered, Recent Developments, Response To Covid-19 & Mnm View Might Not Be Captured In Case Of Unlisted Companies.
11 Adjacent/Related Markets
11.1 Smart Cities Market
11.1.1 Market Definition
11.1.2 Market Overview
11.1.3 Smart Cities Market, By Focus Area
Table 183 Smart Cities Market Size, By Focus Area, 2016–2019 (Usd Billion)
Table 184 Smart Cities Market Size, By Focus Area, 2019–2025 (Usd Billion)
11.1.4 Smart Transportation Market, By Component
Table 185 Smart Transportation Market Size, By Component, 2016–2019 (Usd Billion)
Table 186 Smart Transportation Market Size, By Component, 2019–2025 (Usd Billion)
Table 187 Smart Transportation Market Size, By Solution, 2016–2019 (Usd Billion)
Table 188 Smart Transportation Market Size, By Solution, 2019–2025 (Usd Billion)
Table 189 Smart Transportation Market Size, By Service, 2016–2019 (Usd Billion)
Table 190 Smart Transportation Market Size, By Service, 2019–2025 (Usd Billion)
11.1.5 Smart Transportation Market, By Type
Table 191 Smart Transportation Market Size, By Type, 2016–2019 (Usd Billion)
Table 192 Smart Transportation Market Size, By Type, 2019–2025 (Usd Billion)
11.1.6 Smart Buildings Market, By Solution
Table 193 Market Size, By Solution, 2016–2019 (Usd Billion)
Table 194 Market Size, By Solution, 2019–2025 (Usd Billion)
11.1.7 Market, By Service
Table 195 Market Size, By Service, 2016–2019 (Usd Billion)
Table 196 Smart Buildings Market Size, By Service, 2019–2025 (Usd Billion)
11.1.8 Smart Utilities Market, By Component
Table 197 Smart Utilities Market Size, By Component, 2016–2019 (Usd Billion)
Table 198 Smart Utilities Market Size, By Component, 2019–2025 (Usd Billion)
Table 199 Smart Utilities Market Size, By Solution, 2016–2019 (Usd Billion)
Table 200 Smart Utilities Market Size, By Solution, 2019–2025 (Usd Billion)
Table 201 Smart Utilities Market Size, By Service, 2016–2019 (Usd Billion)
Table 202 Smart Utilities Market Size, By Service, 2019–2025 (Usd Billion)
11.1.9 Smart Utilities Market, By Type
Table 203 Smart Utilities Market Size, By Type, 2016–2019 (Usd Billion)
Table 204 Smart Utilities Market Size, By Type, 2019–2025 (Usd Billion)
11.1.10 Smart Citizen Services Market, By Type
Table 205 Smart Citizen Services Market Size, By Type, 2016–2019 (Usd Billion)
Table 206 Smart Citizen Services Market Size, By Type, 2019–2025 (Usd Billion)
11.1.11 Smart Cities Market, By Region
Table 207 Smart Cities Market, By Region, 2016–2019 (Usd Billion)
Table 208 Smart Cities Market, By Region, 2019–2025 (Usd Billion)
11.2 Facility Management Market
11.2.1 Market Definition
11.2.2 Market Overview
11.2.3 Facility Management Market, By Offering
Table 209 Facility Management Market Size, By Offering, 2016–2019 (Usd Million)
Table 210 Facility Management Market Size, By Offering, 2019–2025 (Usd Million)
Table 211 Facility Management Market Size, By Solution, 2016–2019 (Usd Million)
Table 212 Facility Management Market Size, By Solution, 2019–2025 (Usd Million)
Table 213 Facility Management Market Size, By Service, 2016–2019 (Usd Million)
Table 214 Facility Management Market Size, By Service, 2019–2025 (Usd Million)
11.2.4 Facility Management Market, By Deployment Type
Table 215 Facility Management Market Size, By Deployment Type, 2016–2019 (Usd Million)
Table 216 Facility Management Market Size, By Deployment Type, 2019–2025 (Usd Million)
11.2.5 Facility Management Market, By Organization Size
Table 217 Facility Management Market Size, By Organization Size, 2016–2019 (Usd Million)
Table 218 Facility Management Market Size, By Organization Size, 2019–2025 (Usd Million)
11.2.6 Facility Management Market, By Vertical
Table 219 Facility Management Market Size, By Vertical, 2016–2019 (Usd Million)
Table 220 Facility Management Market Size, By Vertical, 2019–2025 (Usd Million)
11.2.7 Facility Management Market, By Region
Table 221 Facility Management Market Size, By Region, 2016–2019 (Usd Million)
Table 222 Facility Management Market Size, By Region, 2019–2025 (Usd Million)
11.3 Building Automation System Market
11.3.1 Market Definition
11.3.2 Market Overview
11.3.3 Building Automation System Market, By Communication Technology
Table 223 Building Automation System Market For Facility Management Systems, By Communication Technology, 2016–2024 (Usd Billion)
11.3.4 Building Automation System Market, By Offering
Table 224 Building Automation System Market Size, By Offering, 2016–2024 (Usd Billion)
11.3.5 Building Automation System Market, By Application
Table 225 Building Automation System Market Size, By Application, 2016–2024 (Usd Billion)
Table 226 Building Automation System Market For Residential Application, By Offering, 2016–2024 (Usd Billion)
Table 227 Building Automation System Market For Commercial Application, By Offering, 2016–2024 (Usd Billion)
Table 228 Building Automation System Market For Industrial Application, By Offering, 2016–2024 (Usd Billion)
11.3.6 Building Automation System Market, By Region
Table 229 Building Automation System Market Size, By Region, 2016–2024 (Usd Billion)
11.4 Building Analytics Market
11.4.1 Market Definition
11.4.2 Market Overview
11.4.3 Building Analytics Market, By Application
Table 230 Building Analytics Market Size, By Application, 2016–2023 (Usd Million)
11.4.4 Building Analytics Market, By Component
Table 231 Building Analytics Market Size, By Component, 2016–2023 (Usd Million)
Table 232 Building Analytics Market Size, By Service, 2016–2023 (Usd Million)
11.4.5 Building Analytics Market, By Deployment Mode
Table 233 Building Analytics Market Size, By Deployment Mode, 2016–2023 (Usd Million)
11.4.6 Building Analytics Market, By Building Type
Table 234 Building Analytics Market Size, By Building Type, 2016–2023 (Usd Million)
11.4.7 Building Analytics Market, By Region
Table 235 Building Analytics Market Size, By Region, 2016–2023 (Usd Million)
ReportsnReports.com is your single source for all market research needs. Our database includes 500,000+ market research reports from over 95 leading global publishers & in-depth market research studies of over 5000 micro markets.
+ 1 888 391 5441
sales@reportsandreports.com
This release was published on openPR.
Permanent link to this press release:
Copy
Please set a link in the press area of your homepage to this press release on openPR. openPR disclaims liability for any content contained in this release.
You can edit or delete your press release Smart Buildings Market Global Key Players Analysis- 75F (US), ABB (Switzerland), Aquicore (US), Bosch (US), BuildingIQ (US), Cisco (US), CopperTree Analytics (Canada), ENTOUCH (US), Hitachi (Japan), Honeywell (US), Huawei (China), IBM (US), Igor (US), Int here
News-ID: 2303609 • Views: …
More Releases from ReportsnReports

DeviceCon Series 2024 - UK Edition | MarketsandMarkets
Future Forward: Redefining Healthcare with Cutting-Edge Devices
Welcome to DeviceCon Series 2024 - Where Innovation Meets Impact!
Join us on March 21-22 at Millennium Gloucester Hotel, 4-18 Harrington Gardens, London SW7 4LH for a groundbreaking convergence of knowledge, ideas, and technology. MarketsandMarkets proudly presents the DeviceCon Series, an extraordinary blend of four conferences that promise to redefine the landscape of innovation in medical and diagnostic devices.
Register Now @ https://events.marketsandmarkets.com/devicecon-series-uk-edition-2024/register
MarketsandMarkets presents…

5th Annual MarketsandMarkets Infectious Disease and Molecular Diagnostics Confer …
London, March 7, 2024 - MarketsandMarkets is thrilled to announce the eagerly awaited 5th Annual Infectious Disease and Molecular Diagnostics Conference, scheduled to take place on March 21st - 22nd, 2024, at the prestigious Millennium Gloucester Hotel, located at 4-18 Harrington Gardens, London SW7 4LH.
This conference promises to be a groundbreaking event, showcasing the latest trends and insights in diagnosis, as well as unveiling cutting-edge technologies that are revolutionizing the…

Infection Control, Sterilization & Decontamination Conference |21st - 22nd March …
MarketsandMarkets is pleased to announce its 8th Annual Infection Control, Sterilisation, and Decontamination in Healthcare Conference, which will take place March 21-22, 2024, in London, UK. With the increased risk of infection due to improper sterilisation and decontamination practices, the safety of patients and healthcare workers is of paramount importance nowadays.
Enquire Now @ https://events.marketsandmarkets.com/infection-control-sterilization-and-decontamination-conference/
This conference aims to bring together all the stakeholders to discuss the obstacles in achieving…
Breast Augmentation Market Key Players, Demands, Cost, Size, Procedure, Shape, S …
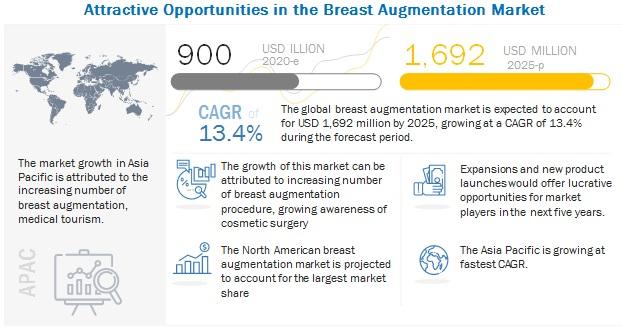
The global Breast Augmentation Market in terms of revenue was estimated to be worth $900 million in 2020 and is poised to reach $1,692 million by 2025, growing at a CAGR of 13.4% from 2020 to 2025. The new research study consists of an industry trend analysis of the market. The new research study consists of industry trends, pricing analysis, patent analysis, conference and webinar materials, key stakeholders, and buying…
More Releases for Mark
MARK WAHLBERG INSTANT EARWORMS!
A jingle for Mark Wahlberg and Wahlburgers ( link below ). Host and enthusiastic Wahlburgers fan DeeDee from CRAZY JOURNEYS with DeeDee is putting out an open invitation to Mark Wahlberg himself - to join her for a fun, fresh photo retake at one of his legendary Wahlburgers locations.
Why? Because every great journey deserves a great snapshot- and the magic of an awesome burger.
DeeDee, whose content on YouTube has…
INTERVIEW: MARK JAMES SCOTT
I sat down with Brand Consultant, Designer & Creative Director Mark James Scott who is making an Impact in the Hip Hop World, in both the UK and the US. We talked working with Artists from The Game and Music Mogul Diddy, to his own Music and more..
BY SASHA JENKINS
WHAT SETS YOU APART FROM OTHERS IN YOUR FIELD?
I didn't study Design. I studied Psychology for 6 years and gained my Masters…
Impressionist landscape artist - Mark Briscoe
I am Mark Briscoe, Bristish artist well established in the field of Chinoiserie furniture decoration and restoration of antique lacquer. But the techniques for fine art easel painting in the wonderful manner of the old masters is something which I have been exploring in great earnest over the last two years as a long cherished desire. And while I cannot claim to have come anywhere near their heights, I have…
Mark de Clive-Lowe
On Thursday, May 3rd, 2012 internationally known musician Mark de Clive-Lowe (MdCL), will take the stage at The Beehive, located in Boston, MA, for a special performance of his revolutionary sound. Be there from 9:30PM to 1:00AM as MdCL plays impromptu remixes created from scratch, on the spot using drum machines, keyboards and special effects. He will start with a jazz-oriented set and crank up the intensity with his signature…
Trade Mark Act
Neoinfo Solutions Pvt. LTD is an IT based company with its main office located in Jaipur(rajasthan). Our expertise lies in the domain of Website Designing development portal development,maintenance software consulting, designing development , implimentation, training and maitenance.In the journey of achieving our combined business and social goals we have kept in mind and have always strictly followed all our data security policies to ensure that all informations of our clients…
Trade mark Act
Neoinfo Solutions Pvt. LTD is an IT based company with its main office located in Jaipur(rajasthan). Our expertise lies in the domain of Website Designing development portal development,maintenance software consulting, designing development , implimentation, training and maitenance.In the journey of achieving our combined business and social goals we have kept in mind and have always strictly followed all our data security policies to ensure that all informations of our clients…
