Press release
Cash Logistics Market to Reach $30,707.7 Million | By Top Leading Companies: The Brinks Company, Cash Logistics Security AG, CMS Info Systems Ltd., G4S plc., Garda World Security Corporation, Global Security Logistics Co, GSLS, Lemuir Group, Loomis, and P
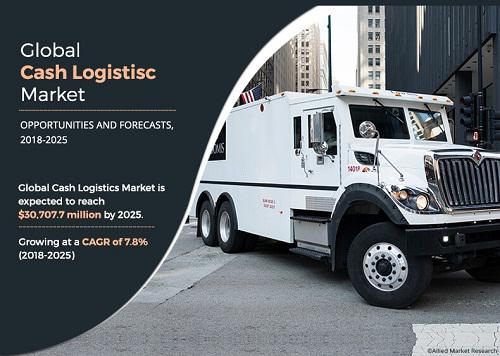
Cash Logistics Market by Service (Cash management, Cash-in-transit, and ATM Services), and End User (Financial Institutions, Retailers, Government Agencies, and Others): Global Opportunity Analysis and Industry Forecast, 2018–2025." The report offers detailed analyses of the market dynamics, top investment pockets, market size & forecasts, and competitive landscape. According to the report, the global cash logistics market garnered $16.5 billion in 2017, and is expected to reach $30.7 billion by 2025, registering a CAGR of 7.8% from 2018 to 2025.Download PDF Report Sample @ https://www.alliedmarketresearch.com/request-sample/2458?utm_source=OPR
Based on service, the cash-in-transit segment dominated the global cash logistics market in 2017, in terms of revenue. In addition, based on end-user, the financial institutions segment is expected to lead the market throughout the forecast period. Presently, LAMEA is the highest revenue contributor, and is expected to garner highest revenue in the global market during the forecast period, followed by North America, Europe, and Asia-Pacific.
Increase in cash transactions, surge in presence of ATMs, and growth in demand for safe & vault for managing cash drive the growth of the global cash logistics market. However, increase in adoption of digital payments and rise in cash-in-transit robberies restrain the market growth. On the other hand, increase in demand for cash from emerging economies and surge in manufacturing of fully automated cash-in-transit vehicles would create new opportunities to the market.
Cash-in-transit service segment contributed more than two-fifths of the total market revenue in 2017 and is expected to maintain its dominance by 2025. This is attributed to the increasing adoption of new technologies by market players to foster safety and security of cash-in-transit vehicles. However, cash management service is expected to register the highest CAGR of 9.4% from 2018 to 2025, owing to incorporation of innovative cash management services by leading banks to handle cash and offer convenience to clients. The report also analyzes ATM services segment.
Financial institutions segment held the major share in 2017, accounting for more than two-fifths of the total market revenue and is projected to maintain its dominance throughout the forecast period. This is due to the increasing adoption of cash logistics solutions among financial institutions on account of advantages such as optimal cash flow, improved transparency, and customization of solutions among others. However, the other end user segment, which comprises individuals, private firms, and others, would grow at the fastest CAGR of 9.0% from 2018 to 2025, owing to surge in cash flow and increase in demand for safe and vault for cash management.
Get Customized Report @ https://www.alliedmarketresearch.com/request-for-customization/2458?utm_source=OPR
Asia-Pacific is expected to grow at the highest CAGR of 10.3% from 2018 to 2025, owing to expansion of banking facilities in emerging economies such as India, China, and others and increase in cash circulation. However, LAMEA accounted for nearly three-tenths of the total market share in 2017 and would maintain its lion's share through 2025 due to increase in demand for cash flow and high security threat for transportation of cash.
The key players analyzed in the report include The Brink's Company, CMS Info Systems Ltd., Cash Logistics Security AG, Garda World Security Corporation, G4S Plc., GSLS, Lemuir Group, Global Security Logistics Co., Loomis, and Prosegur Cash, S.A.
Analyst Review:
Cash logistics companies provide services related to cash transportation, cash handling, and ATM related services. Services such as cash-in-transit, cash management, and ATM replenishment, are mainly provided by the companies. Cash logistics companies need to follow security and transportation legislation, as they are considered as logistics companies in the private security industry. In some countries, cash logistics have separate legislations that can impose restriction and requirement on use of vehicle type, crew members, firearms, and others. Cash logistics solutions help financial institutions to track cash ordering information about variety of sources such as ATMs, Central Bank, commercial customers, and others.
Circulation of cash, rise in demand for safe and vault for cash management, and increase in deployment of ATMs are the key factors that fuel the growth of the global cash logistics market. However, increase in cash-in-transit vehicle robberies and rise in adoption of digital money hinder the market growth.
Among the analyzed geographical regions, currently, LAMEA is the highest revenue contributor, and is expected to maintain the lead during the forecast period, followed by Europe, North America, and Asia-Pacific.
LIST OF TABLES
TABLE 01. GLOBAL CASH LOGISTICS MARKET, BY SERVICES, 2017-2025($MILLION)
TABLE 02. CASH LOGISTICS MARKET REVENUE FOR CASH MANAGEMENT, BY REGION 2017-2025 ($MILLION)
TABLE 03. CASH LOGISTICS MARKET REVENUE FOR CASH-IN-TRANSIT, BY REGION 2017-2025 ($MILLION)
TABLE 04. CASH LOGISTICS MARKET REVENUE FOR ATM SERVICES, BY REGION 20172025 ($MILLION)
TABLE 05. GLOBAL CASH LOGISTICS MARKET, BY END-USER, 2017-2025($MILLION)
TABLE 06. CASH LOGISTICS MARKET REVENUE FOR FINANCIAL INSTITUTIONS, BY REGION 2017-2025 ($MILLION)
TABLE 07. CASH LOGISTICS MARKET REVENUE FOR NLP, BY REGION 2017-2025 ($MILLION)
TABLE 08. CASH LOGISTICS MARKET REVENUE FOR GOVERNMENT AGENCIES, BY REGION 20172025 ($MILLION)
TABLE 09. CASH LOGISTICS MARKET REVENUE FOR OTHERS, BY REGION 20172025 ($MILLION)
TABLE 10. NORTH AMERICAN CASH LOGISTICS MARKET, BY SERVICES, 20172025 ($MILLION)
TABLE 11. NORTH AMERICAN CASH LOGISTICS MARKET, BY END-USER, 20172025 ($MILLION)
TABLE 12. U. S. CASH LOGISTICS MARKET, BY SERVICES, 20172025 ($MILLION)
TABLE 13. U. S. CASH LOGISTICS MARKET, BY END-USER, 20172025 ($MILLION)
TABLE 14. CANADA CASH LOGISTICS MARKET, BY SERVICES, 20172025 ($MILLION)
TABLE 15. CANADA CASH LOGISTICS MARKET, BY END-USER, 20172025 ($MILLION)
TABLE 16. MEXICO CASH LOGISTICS MARKET, BY SERVICES, 20172025 ($MILLION)
TABLE 17. MEXICO CASH LOGISTICS MARKET, BY END-USER, 20172025 ($MILLION)
TABLE 18. EUROPEAN CASH LOGISTICS MARKET, BY SERVICES, 20172025 ($MILLION)
TABLE 19. EUROPEAN CASH LOGISTICS MARKET, BY END-USER, 20172025 ($MILLION)
TABLE 20. UK CASH LOGISTICS MARKET, BY SERVICES, 20172025 ($MILLION)
TABLE 21. UK CASH LOGISTICS MARKET, BY END-USER, 20172025 ($MILLION)
TABLE 22. GERMANY CASH LOGISTICS MARKET, BY SERVICES, 20172025 ($MILLION)
TABLE 23. GERMANY CASH LOGISTICS MARKET, BY END-USER, 20172025 ($MILLION)
TABLE 24. FRANCE CASH LOGISTICS MARKET, BY SERVICES, 20172025 ($MILLION)
TABLE 25. FRANCE CASH LOGISTICS MARKET, BY END-USER, 20172025 ($MILLION)
TABLE 26. ITALY CASH LOGISTICS MARKET, BY SERVICES, 20172025 ($MILLION)
TABLE 27. ITALY CASH LOGISTICS MARKET, BY END-USER, 20172025 ($MILLION)
TABLE 28. SPAIN CASH LOGISTICS MARKET, BY SERVICES, 20172025 ($MILLION)
TABLE 29. SPAIN CASH LOGISTICS MARKET, BY END-USER, 20172025 ($MILLION)
TABLE 30. REST OF EUROPE CASH LOGISTICS MARKET, BY SERVICES, 20172025 ($MILLION)
TABLE 31. REST OF EUROPE CASH LOGISTICS MARKET, BY END-USER, 20172025 ($MILLION)
TABLE 32. ASIA-PACIFIC CASH LOGISTICS MARKET, BY SERVICES, 20172025 ($MILLION)
TABLE 33. ASIA-PACIFIC CASH LOGISTICS MARKET, BY END-USER, 20172025 ($MILLION)
TABLE 34. CHINA CASH LOGISTICS MARKET, BY SERVICES, 20172025 ($MILLION)
TABLE 35. CHINA CASH LOGISTICS MARKET, BY END-USER, 20172025 ($MILLION)
TABLE 36. JAPAN CASH LOGISTICS MARKET, BY SERVICES, 20172025 ($MILLION)
TABLE 37. JAPAN CASH LOGISTICS MARKET, BY END-USER, 20172025 ($MILLION)
TABLE 38. INDIA CASH LOGISTICS MARKET, BY SERVICES, 20172025 ($MILLION)
TABLE 39. INDIA CASH LOGISTICS MARKET, BY END-USER, 20172025 ($MILLION)
TABLE 40. AUSTRALIA CASH LOGISTICS MARKET, BY SERVICES, 20172025 ($MILLION)
TABLE 41. AUSTRALIA CASH LOGISTICS MARKET, BY END-USER, 20172025 ($MILLION)
TABLE 42. SOUTH KOREA CASH LOGISTICS MARKET, BY SERVICES, 20172025 ($MILLION)
TABLE 43. AUSTRALIA CASH LOGISTICS MARKET, BY END-USER, 20172025 ($MILLION)
TABLE 44. REST OF ASIA-PACIFIC CASH LOGISTICS MARKET, BY PRODUCT, 20172025 ($MILLION)
TABLE 45. REST OF ASIA-PACIFIC CASH LOGISTICS MARKET, BY END-USER, 20172025 ($MILLION)
TABLE 46. LAMEA CASH LOGISTICS MARKET, BY SERVICES, 20172025 ($MILLION)
TABLE 47. LAMEA CASH LOGISTICS MARKET, BY END-USER, 20172025 ($MILLION)
TABLE 48. LATIN AMERICA CASH LOGISTICS MARKET, BY SERVICES, 20172025 ($MILLION)
TABLE 49. LATIN AMERICA CASH LOGISTICS MARKET, BY END-USER, 20172025 ($MILLION)
TABLE 50. MIDDLE EAST CASH LOGISTICS MARKET, BY SERVICES, 20172025 ($MILLION)
TABLE 51. MIDDLE EAST CASH LOGISTICS MARKET, BY END-USER, 20172025 ($MILLION)
TABLE 52. AFRICA CASH LOGISTICS MARKET, BY SERVICES, 20172025 ($MILLION)
TABLE 53. AFRICA CASH LOGISTICS MARKET, BY END-USER, 20172025 ($MILLION)
TABLE 54. THE BRINKS COMPANY: COMPANY SNAPSHOT
TABLE 55. THE BRINKS COMPANY: OPERATING SEGMENTS
TABLE 56. THE BRINKS COMPANY: PRODUCT PORTFOLIO
TABLE 57. CASH LOGISTICS SECURITY AG: COMPANY SNAPSHOT
TABLE 58. CASH LOGISTICS SECURITY AG: PRODUCT PORTFOLIO
TABLE 59. CMS INFO SYSTEMS LTD: COMPANY SNAPSHOT
TABLE 60. CMS INFO SYSTEMS LTD: PRODUCT CATEGORY
TABLE 61. CMS INFO SYSTEMS LTD: PRODUCT PORTFOLIO
TABLE 62. G4S PLC: COMPANY SNAPSHOT
TABLE 63. G4S PLC: PRODUCT PORTFOLIO
TABLE 64. GARDA WORLD SECURITY CORPORATION: COMPANY SNAPSHOT
TABLE 65. GARDA WORLD SECURITY CORPORATION: PRODUCT CATEGORIES
TABLE 66. GARDA WORLD SECURITY CORPORATION: PRODUCT PORTFOLIO
TABLE 67. GLOBAL SECURITY LOGISTICS CO: COMPANY SNAPSHOT
TABLE 68. GLOBAL SECURITY LOGISTICS CO: PRODUCT CATEGORIES
TABLE 69. GLOBAL SECURITY LOGISTICS CO: PRODUCT PORTFOLIO
TABLE 70. GSLS: COMPANY SNAPSHOT
TABLE 71. GSLS: PRODUCT PORTFOLIO
TABLE 72. LEMUIR GROUP: COMPANY SNAPSHOT
TABLE 73. LEMUIR GROUP: PRODUCT PORTFOLIO
TABLE 74. LOOMIS: COMPANY SNAPSHOT
TABLE 75. LOOMIS: PRODUCT PORTFOLIO
TABLE 76. PROSEGUR CASH, S.A: COMPANY SNAPSHOT
TABLE 77. PROSEGUR CASH, S.A: PRODUCT CATEGORIES
Access Full Summery @ https://www.alliedmarketresearch.com/cash-logistics-market?utm_source=OPR
About Us
Allied Market Research (AMR) is a full-service market research and business-consulting wing of Allied Analytics LLP based in Portland, Oregon. Allied Market Research provides global enterprises as well as medium and small businesses with unmatched quality of "Market Research Reports" and "Business Intelligence Solutions.” AMR has a targeted view to provide business insights and consulting to assist its clients to make strategic business decisions and achieve sustainable growth in their respective market domain.
We are in professional corporate relations with various companies and this helps us in digging out market data that helps us generate accurate research data tables and confirms utmost accuracy in our market forecasting. Each and every data presented in the reports published by us is extracted through primary interviews with top officials from leading companies of domain concerned. Our secondary data procurement methodology includes deep online and offline research and discussion with knowledgeable professionals and analysts in the industry.
Contact:
David Correa
5933 NE Win Sivers Drive
#205, Portland, OR 97220
United States
Toll Free (USA/Canada):
+1-800-792-5285, +1-503-894-6022, +1-503-446-1141
UK: +44-845-528-1300
Hong Kong: +852-301-84916
India (Pune): +91-20-66346060
Fax: +1?855?550-5975
help@alliedmarketresearch.com
Web: https://www.alliedmarketresearch.com
This release was published on openPR.
Permanent link to this press release:
Copy
Please set a link in the press area of your homepage to this press release on openPR. openPR disclaims liability for any content contained in this release.
You can edit or delete your press release Cash Logistics Market to Reach $30,707.7 Million | By Top Leading Companies: The Brinks Company, Cash Logistics Security AG, CMS Info Systems Ltd., G4S plc., Garda World Security Corporation, Global Security Logistics Co, GSLS, Lemuir Group, Loomis, and P here
News-ID: 1608022 • Views: …
More Releases from Allied Market Research

Emerging Technologies in Structural Steel Tube Market in Glob: Innovations and F …
According to the report, "the structural steel tube market" was valued at $105.3 billion in 2023, and is estimated to reach $167.5 billion by 2033, growing at a CAGR of 4.8% from 2024 to 2033.
Allied Market Research published a report, titled, "Structural Steel Tube Market By Type (Hot-Rolled Steel and Cold-Rolled Steel), Material (Stainless Steel Tube, Carbon Steel Tube, Alloy Steel Tube, and Others), Sales Type (Direct,…

Costume Jewelry Market Size Worth USD 86.8 billion by 2033 | Growth Rate (CAGR) …
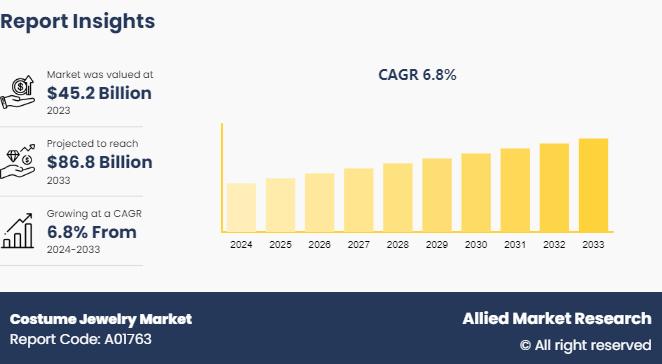
According to a new report published by Allied Market Research, titled, "costume jewelry market" was valued at $45.2 billion in 2023, and is projected to reach $86.8 billion by 2033, growing at a CAGR of 6.8% from 2024 to 2033.
Get Sample PDF Of This Report: https://www.alliedmarketresearch.com/request-sample/2093
Costume jewelry refers to decorative pieces made of inexpensive materials such as base metals, glass, plastic, or synthetic stones, often adorned with…

Monoisopropanolamine Market: A Comprehensive Analysis of Trends, Growth and Oppo …
The global Monoisopropanolamine (MIPA) Market was pegged at $82.2 million in 2020, and is expected to reach $140.8 million by 2030, growing at a CAGR of 5.6% from 2021 to 2030.
Allied Market Research recently published a report, titled, Monoisopropanolamine (MIPA) Market by End-use Industry (Chemical Industry, Personal Care, Agrochemical, Pharmaceuticals, Metalworking, and Others): Global Opportunity Analysis and Industry Forecast, 2021-2030".
Download Sample Report with Statistical Info: https://www.alliedmarketresearch.com/request-sample/16048…

Treadmill Market Navigating Business with CAGR of 5.1% with Revenue of $5,932.0 …
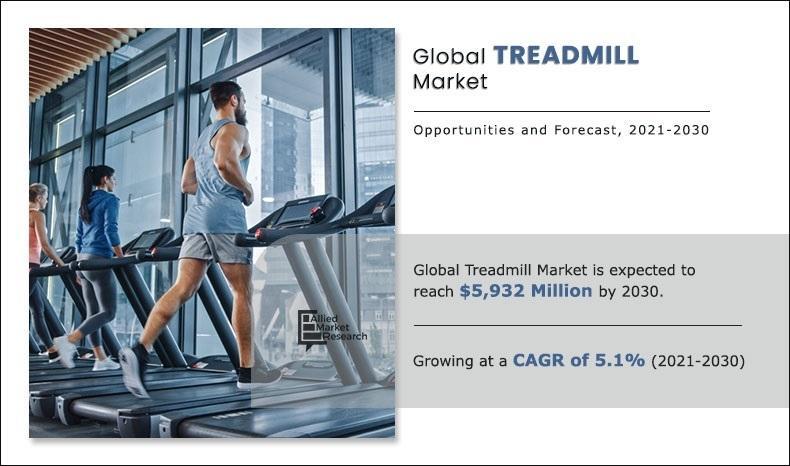
The global treadmill market size was valued at $3,284.8 million in 2020, and is projected to reach $5,932.0 million by 2030, registering a CAGR of 5.1%.
Request The Sample PDF Of This Report @ https://www.alliedmarketresearch.com/request-sample/4286
Treadmill is widely used for physical fitness equipment for weight management and improving body stamina & muscular strength. Mostly used treadmills are motorized or electronic, owing to advance features offered to users. Rise in…
More Releases for TABLE
Bedside Table With Over-Bed Table Market Size and Forecast
𝐔𝐒𝐀, 𝐍𝐞𝐰 𝐉𝐞𝐫𝐬𝐞𝐲- The global Bedside Table With Over-Bed Table Market is expected to record a CAGR of XX.X% from 2024 to 2031 In 2024, the market size is projected to reach a valuation of USD XX.X Billion. By 2031 the valuation is anticipated to reach USD XX.X Billion.
The global market for bedside tables with over-bed tables is experiencing significant growth due to the rising demand for multifunctional furniture. These…
Table Linen Market to Witness Revolutionary Growth by 2030 | IKEA, URQUILDLINEN, …
Global "Table Linen Market" Research report is an in-depth study of the market Analysis. Along with the most recent patterns and figures that uncovers a wide examination of the market offer. This report provides exhaustive coverage on geographical segmentation, latest demand scope, growth rate analysis with industry revenue and CAGR status. While emphasizing the key driving and restraining forces for this market, the report also offers a complete study of…
Table Tennis Table Market: Competitive Dynamics & Global Outlook 2024
LP INFORMATION offers a latest published report on Table Tennis Table Market Analysis and Forecast 2019-2025 delivering key insights and providing a competitive advantage to clients through a detailed report.
According to this study, over the next five years the Table Tennis Table market will register a xx% CAGR in terms of revenue, the global market size will reach US$ xx million by 2024, from US$ xx million in 2019.…
Table Linen Market Forecast 2017-2022: IKEA, URQUILDLINEN, Premier Table Linens, …
Global Table Linen Market Research Report
A market study ” Global Table Linen Market ” examines the performance of the Table Linen market 2017. It encloses an in-depth Research of the Table Linen market state and the competitive landscape globally. This report analyzes the potential of Table Linen market in the present and the future prospects from various angles in detail.
Inquiry For Sample Report, Click Here: http://bit.ly/2s0g8nd
The Global Table Linen Market…
Global and Chinese Table Tennis Table Market Demand Growth Report 2017
Research carried out a market study on the Table Tennis Table market. The report titled, “Table Tennis Table ”, is an in-depth analysis of the Table Tennis Table market and offers important insights related to the market such as market share, size and growth. The presented study discusses the current trends, opportunities and the challenges in the Table Tennis Table market. Key statistics, growth prospects and the current status…
Billiard Table Manufacturer, Pool Table Supplies
Chevillotte Billiards manufactures the highest standard quality billiards table in the world. Our manufacturing facility has been making billiard table and it's accessories since the 1860's and earned a lots of name and respects in the billiards industry. We manufacture our billiards products as per the requirements of the clients and also assist customized solutions to them. Our range is designed as per the latest market trends and is ideal…
