Press release
Antibiotics Market Expected to Reach $50,374 Million, Growth Analysis By Abbott Laboratories, Allergan Plc., F.Hoffmann-La Roche Ltd., GlaxoSmithKline Plc, Merck & Co. Inc., Mylan N.V., Novartis International AG, Pfizer Inc.
Antibiotics Market
Download PDF Report Sample @ https://www.alliedmarketresearch.com/request-sample/5072?utm_source=OPR
Antibiotic is a medication used to either inhibit or prevent bacterial infections referred as bactericidal and bacteriostatic antibiotics, respectively. Various types of antibiotics such as penicillin, cephalosporin, carbapenem, and monobactam are available in pharmacies and hospitals that are used to treat infectious diseases.
The antibiotics market is expected to exhibit significant growth during the forecast period, due to rise in demand for new generation antibiotics that can resolve the issue of antimicrobial resistance. In addition, development of novel approaches for new antibiotics for treating bacterial infections and increase in number of clinical trials supplement the growth of the antibiotics market. However, development of antibiotic resistance, driven by misuse of antibiotics, and time taken for the regulatory approval restrain the market growth. On the contrary, the discovery of advanced prospect molecules and introduction of novel combination therapies to treat antibiotic-resistant microbial infections are expected to provide new opportunities for market players in the near future.
Based on class, the global antibiotics market is categorized into beta lactam & beta lactamase inhibitors, quinolones, macrolides, and others. The quinolones segment is anticipated to exhibit the highest CAGR during forecast period, due to upsurge in demand for broad-spectrum, bactericidal activity; new generation quinolones; enhanced oral bioavailability; superior tissue penetration; and improved safety & tolerability.
By route of administration, the market is classified into oral, intravenous, and others. The intravenous segment was the major revenue contributor in 2017, and is projected to continue this trend during the forecast period, due to increase in incidence of severe infections. Moreover, as intravenous antibiotics are administered in higher concentrations, they reach in the tissues faster as compared to oral antibiotics.
Get Customized Report @ https://www.alliedmarketresearch.com/request-for-customization/5072?utm_source=OPR
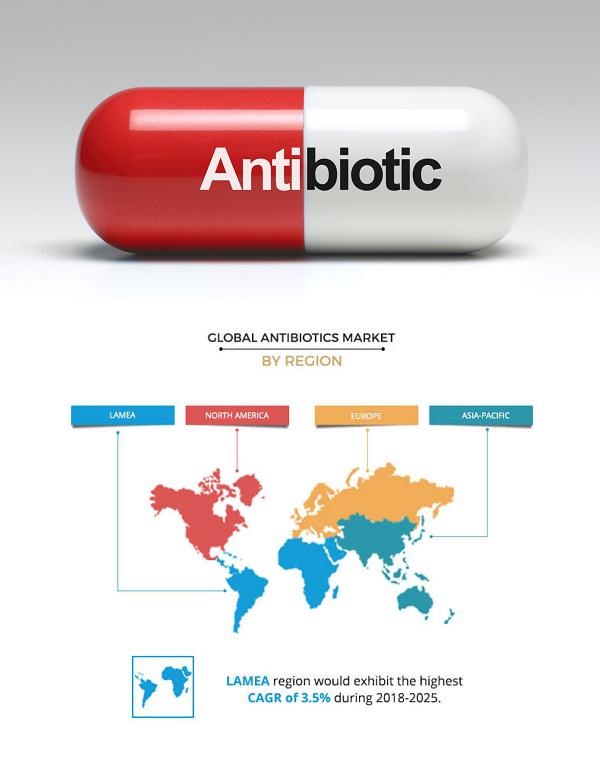
Asia-Pacific is expected to remain dominant throughout the forecast period attributable to increased antibiotics consumption, their easy availability, and rise in sale of over-the-counter drugs. However, LAMEA is expected to experience the highest growth rate during the forecast period, majorly due to no obligations on antibiotics use in this region.
The report provides a comprehensive analysis of the key players operating in the global antibiotics market, namely, Abbott Laboratories, Allergan Plc., F.Hoffmann-La Roche Ltd., GlaxoSmithKline Plc, Merck & Co. Inc., Mylan N.V., Novartis International AG (Sandoz), Pfizer Inc., Sanofi, and Teva Pharmaceutical Industries Ltd.
The other players in the value chain include Aurobindo Pharma, Bayer HealthCare, Eli Lilly, Lupin Pharmaceuticals, Sun Pharmaceutical, Shionogi, and others.
LIST OF TABLES
TABLE 01. GLOBAL ANTIBIOTICS MARKET, BY CLASS, 20172025 ($MILLION)
TABLE 02. BETA LACTAM AND BETA LACTAMASE INHIBITORS ANTIBIOTICS MARKET, BY TYPE, 20172025 ($MILLION)
TABLE 03. ANTIBIOTICS MARKET FOR BETA LACTAM AND BETA LACTAMASE INHIBITORS, BY REGION, 20172025 ($MILLION)
TABLE 04. ANTIBIOTICS MARKET FOR QUINOLONES, BY REGION, 20172025 ($MILLION)
TABLE 05. ANTIBITOTICS MARKET FOR MACROLIDES, BY REGION, 20172025 ($MILLION)
TABLE 06. ANTIBIOTICS MARKET FOR OTHERS, BY REGION, 20172025 ($MILLION)
TABLE 07. GLOBAL ANTIBIOTICS MARKET, BY DRUG ORIGIN, 20172025 ($MILLION)
TABLE 08. ANTIBIOTICS MARKET FOR NATURAL, BY REGION, 20172025 ($MILLION)
TABLE 09. ANTIBIOTICS MARKET FOR SEMISYNTHETIC, BY REGION, 20172025 ($MILLION)
TABLE 10. ANTIBIOTICS MARKET FOR SYNTHETIC, BY REGION, 20172025 ($MILLION)
TABLE 11. GLOBAL ANTIBIOTICS MARKET, BY SPECTRUM OF ACTIVITY, 20172025 ($MILLION)
TABLE 12. ANTIBIOTICS MARKET FOR BROAD-SPECTRUM ANTIBIOTIC, BY REGION, 20172025 ($MILLION)
TABLE 13. ANTIBIOTICS MARKET FOR NARROW-SPECTRUM ANTIBIOTIC, BY REGION, 20172025 ($MILLION)
TABLE 14. GLOBAL ANTIBIOTICS MARKET, BY ROUTE OF ADMINISTRATION, 20172025 ($MILLION)
TABLE 15. ANTIBIOTICS MARKET FOR ORAL, BY REGION, 20172025 ($MILLION)
TABLE 16. ANTIBIOTICS MARKET FOR INTRAVENOUS, BY REGION, 20172025 ($MILLION)
TABLE 17. ANTIBIOTICS MARKET FOR OTHERS, BY REGION, 20172025 ($MILLION)
TABLE 18. GLOBAL ANTIBIOTICS MARKET REVENUE, BY REGION, 20172025 ($MILLION)
TABLE 19. NORTH AMERICA ANTIBIOTICS MARKET, BY COUNTRY, 2017-2025 ($MILLION)
TABLE 20. U.S. ANTIBIOTICS MARKET, BY CLASS, 2017-2025 ($MILLION)
TABLE 21. U.S. ANTIBIOTICS MARKET, BY DRUG ORIGIN, 2017-2025 ($MILLION)
TABLE 22. U.S. ANTIBIOTICS MARKET, BY SPECTRUM OF ACTIVITY, 2017-2025 ($MILLION)
TABLE 23. U.S. ANTIBIOTICS MARKET, BY ROUTE OF ADMINISTRATION, 2017-2025 ($MILLION)
TABLE 24. CANADA ANTIBIOTICS MARKET, BY CLASS, 2017-2025 ($MILLION)
TABLE 25. CANADA ANTIBIOTICS MARKET, BY DRUG ORIGIN, 2017-2025 ($MILLION)
TABLE 26. CANADA ANTIBIOTICS MARKET, BY SPECTRUM OF ACTIVITY, 2017-2025 ($MILLION)
TABLE 27. CANADA ANTIBIOTICS MARKET, BY ROUTE OF ADMINISTRATION, 2017-2025 ($MILLION)
TABLE 28. MEXICO ANTIBIOTICS MARKET, BY CLASS, 2017-2025 ($MILLION)
TABLE 29. MEXICO ANTIBIOTICS MARKET, BY DRUG ORIGIN, 2017-2025 ($MILLION)
TABLE 30. MEXICO ANTIBIOTICS MARKET, BY SPECTRUM OF ACTIVITY, 2017-2025 ($MILLION)
TABLE 31. MEXICO ANTIBIOTICS MARKET, BY ROUTE OF ADMINISTRATION, 2017-2025 ($MILLION)
TABLE 32. NORTH AMERICA ANTIBIOTICS MARKET, BY CLASS, 2017-2025 ($MILLION)
TABLE 33. NORTH AMERICA ANTIBIOTICS MARKET, BY DRUG ORIGIN, 2017-2025 ($MILLION)
TABLE 34. NORTH AMERICA ANTIBIOTICS MARKET, BY SPECTRUM OF ACTIVITY, 2017-2025 ($MILLION)
TABLE 35. NORTH AMERICA ANTIBIOTICS MARKET, BY ROUTE OF ADMINISTRATION, 2017-2025 ($MILLION)
TABLE 36. EUROPE ANTIBIOTICS MARKET, BY COUNTRY, 2017-2025 ($MILLION)
TABLE 37. GERMANY ANTIBIOTICS MARKET, BY CLASS, 2017-2025 ($MILLION)
TABLE 38. GERMANY ANTIBIOTICS MARKET, BY DRUG ORIGIN, 2017-2025 ($MILLION)
TABLE 39. GERMANY ANTIBIOTICS MARKET, BY SPECTRUM OF ACTIVITY, 2017-2025 ($MILLION)
TABLE 40. GERMANY ANTIBIOTICS MARKET, BY ROUTE OF ADMINISTRATION, 2017-2025 ($MILLION)
TABLE 41. FRANCE ANTIBIOTICS MARKET, BY CLASS, 2017-2025 ($MILLION)
TABLE 42. FRANCE ANTIBIOTICS MARKET, BY DRUG ORIGIN, 2017-2025 ($MILLION)
TABLE 43. FRANCE ANTIBIOTICS MARKET, BY SPECTRUM OF ACTIVITY, 2017-2025 ($MILLION)
TABLE 44. FRANCE ANTIBIOTICS MARKET, BY ROUTE OF ADMINISTRATION, 2017-2025 ($MILLION)
TABLE 45. SPAIN ANTIBIOTICS MARKET, BY CLASS, 2017-2025 ($MILLION)
TABLE 46. SPAIN ANTIBIOTICS MARKET, BY DRUG ORIGIN, 2017-2025 ($MILLION)
TABLE 47. SPAIN ANTIBIOTICS MARKET, BY SPECTRUM OF ACTIVITY, 2017-2025 ($MILLION)
TABLE 48. SPAIN ANTIBIOTICS MARKET, BY ROUTE OF ADMINISTRATION, 2017-2025 ($MILLION)
TABLE 49. ITALY ANTIBIOTICS MARKET, BY CLASS, 2017-2025 ($MILLION)
TABLE 50. ITALY ANTIBIOTICS MARKET, BY DRUG ORIGIN, 2017-2025 ($MILLION)
TABLE 51. ITALY ANTIBIOTICS MARKET, BY SPECTRUM OF ACTIVITY, 2017-2025 ($MILLION)
TABLE 52. ITALY ANTIBIOTICS MARKET, BY ROUTE OF ADMINISTRATION, 2017-2025 ($MILLION)
TABLE 53. UK ANTIBIOTICS MARKET, BY CLASS, 2017-2025 ($MILLION)
TABLE 54. UK ANTIBIOTICS MARKET, BY DRUG ORIGIN, 2017-2025 ($MILLION)
TABLE 55. UK ANTIBIOTICS MARKET, BY SPECTRUM OF ACTIVITY, 2017-2025 ($MILLION)
TABLE 56. UK ANTIBIOTICS MARKET, BY ROUTE OF ADMINISTRATION, 2017-2025 ($MILLION)
TABLE 57. REST OF EUROPE ANTIBIOTICS MARKET, BY CLASS, 2017-2025 ($MILLION)
TABLE 58. REST OF EUROPE ANTIBIOTICS MARKET, BY DRUG ORIGIN, 2017-2025 ($MILLION)
TABLE 59. REST OF EUROPE ANTIBIOTICS MARKET, BY SPECTRUM OF ACTIVITY, 2017-2025 ($MILLION)
TABLE 60. REST OF EUROPE ANTIBIOTICS MARKET, BY ROUTE OF ADMINISTRATION, 2017-2025 ($MILLION)
TABLE 61. EUROPE ANTIBIOTICS MARKET, BY CLASS, 2017-2025 ($MILLION)
TABLE 62. EUROPE ANTIBIOTICS MARKET, BY DRUG ORIGIN, 2017-2025 ($MILLION)
TABLE 63. EUROPE ANTIBIOTICS MARKET, BY SPECTRUM OF ACTIVITY, 2017-2025 ($MILLION)
TABLE 64. EUROPE ANTIBIOTICS MARKET, BY ROUTE OF ADMINISTRATION, 2017-2025 ($MILLION)
TABLE 65. ASIA-PACIFIC ANTIBIOTICS MARKET, BY COUNTRY, 2017-2025 ($MILLION)
TABLE 66. AUSTRALIA ANTIBIOTICS MARKET, BY CLASS, 2017-2025 ($MILLION)
TABLE 67. AUSTRALIA ANTIBIOTICS MARKET, BY DRUG ORIGIN, 2017-2025 ($MILLION)
TABLE 68. AUSTRALIA ANTIBIOTICS MARKET, BY SPECTRUM OF ACTIVITY, 2017-2025 ($MILLION)
TABLE 69. AUSTRALIA ANTIBIOTICS MARKET, BY ROUTE OF ADMINISTRATION, 2017-2025 ($MILLION)
TABLE 70. JAPAN ANTIBIOTICS MARKET, BY CLASS, 2017-2025 ($MILLION)
TABLE 71. JAPAN ANTIBIOTICS MARKET, BY DRUG ORIGIN, 2017-2025 ($MILLION)
TABLE 72. JAPAN ANTIBIOTICS MARKET, BY SPECTRUM OF ACTIVITY, 2017-2025 ($MILLION)
TABLE 73. JAPAN ANTIBIOTICS MARKET, BY ROUTE OF ADMINISTRATION, 2017-2025 ($MILLION)
TABLE 74. INDIA ANTIBIOTICS MARKET, BY CLASS, 2017-2025 ($MILLION)
TABLE 75. INDIA ANTIBIOTICS MARKET, BY DRUG ORIGIN, 2017-2025 ($MILLION)
TABLE 76. INDIA ANTIBIOTICS MARKET, BY SPECTRUM OF ACTIVITY, 2017-2025 ($MILLION)
TABLE 77. INDIA ANTIBIOTICS MARKET, BY ROUTE OF ADMINISTRATION, 2017-2025 ($MILLION)
TABLE 78. CHINA ANTIBIOTICS MARKET, BY CLASS, 2017-2025 ($MILLION)
TABLE 79. CHINA ANTIBIOTICS MARKET, BY DRUG ORIGIN, 2017-2025 ($MILLION)
TABLE 80. CHINA ANTIBIOTICS MARKET, BY SPECTRUM OF ACTIVITY, 2017-2025 ($MILLION)
TABLE 81. CHINA ANTIBIOTICS MARKET, BY ROUTE OF ADMINISTRATION, 2017-2025 ($MILLION)
TABLE 82. REST OF ASIA-PACIFIC ANTIBIOTICS MARKET, BY CLASS, 2017-2025 ($MILLION)
TABLE 83. REST OF ASIA-PACIFIC ANTIBIOTICS MARKET, BY DRUG ORIGIN, 2017-2025 ($MILLION)
TABLE 84. REST OF ASIA-PACIFIC ANTIBIOTICS MARKET, BY SPECTRUM OF ACTIVITY, 2017-2025 ($MILLION)
TABLE 85. REST OF ASIA-PACIFIC ANTIBIOTICS MARKET, BY ROUTE OF ADMINISTRATION, 2017-2025 ($MILLION)
TABLE 86. ASIA-PACIFIC ANTIBIOTICS MARKET, BY CLASS, 2017-2025 ($MILLION)
TABLE 87. ASIA-PACIFIC ANTIBIOTICS MARKET, BY DRUG ORIGIN, 2017-2025 ($MILLION)
TABLE 88. ASIA-PACIFIC ANTIBIOTICS MARKET, BY SPECTRUM OF ACTIVITY, 2017-2025 ($MILLION)
TABLE 89. ASIA-PACIFIC ANTIBIOTICS MARKET, BY ROUTE OF ADMINISTRATION, 2017-2025 ($MILLION)
TABLE 90. LAMEA ANTIBIOTICS MARKET, BY COUNTRY, 2017-2025 ($MILLION)
TABLE 91. BRAZIL ANTIBIOTICS MARKET, BY CLASS, 2017-2025 ($MILLION)
TABLE 92. BRAZIL ANTIBIOTICS MARKET, BY DRUG ORIGIN, 2017-2025 ($MILLION)
TABLE 93. BRAZIL ANTIBIOTICS MARKET, BY SPECTRUM OF ACTIVITY, 2017-2025 ($MILLION)
TABLE 94. BRAZIL ANTIBIOTICS MARKET, BY ROUTE OF ADMINISTRATION, 2017-2025 ($MILLION)
TABLE 95. SAUDI ARABIA ANTIBIOTICS MARKET, BY CLASS, 2017-2025 ($MILLION)
TABLE 96. SAUDI ARABIA ANTIBIOTICS MARKET, BY DRUG ORIGIN, 2017-2025 ($MILLION)
TABLE 97. SAUDI ARABIA ANTIBIOTICS MARKET, BY SPECTRUM OF ACTIVITY, 2017-2025 ($MILLION)
TABLE 98. SAUDI ARABIA ANTIBIOTICS MARKET, BY ROUTE OF ADMINISTRATION, 2017-2025 ($MILLION)
TABLE 99. SOUTH AFRICA ANTIBIOTICS MARKET, BY CLASS, 2017-2025 ($MILLION)
TABLE 100. SOUTH AFRICA ANTIBIOTICS MARKET, BY DRUG ORIGIN, 2017-2025 ($MILLION)
TABLE 101. SOUTH AFRICA ANTIBIOTICS MARKET, BY SPECTRUM OF ACTIVITY, 2017-2025 ($MILLION)
TABLE 102. SOUTH AFRICA ANTIBIOTICS MARKET, BY ROUTE OF ADMINISTRATION, 2017-2025 ($MILLION)
TABLE 103. REST OF LAMEA ANTIBIOTICS MARKET, BY CLASS, 2017-2025 ($MILLION)
TABLE 104. REST OF LAMEA ANTIBIOTICS MARKET, BY DRUG ORIGIN, 2017-2025 ($MILLION)
TABLE 105. REST OF LAMEA ANTIBIOTICS MARKET, BY SPECTRUM OF ACTIVITY, 2017-2025 ($MILLION)
TABLE 106. REST OF LAMEA ANTIBIOTICS MARKET, BY ROUTE OF ADMINISTRATION, 2017-2025 ($MILLION)
TABLE 107. LAMEA ANTIBIOTICS MARKET, BY CLASS, 2017-2025 ($MILLION)
TABLE 108. LAMEA ANTIBIOTICS MARKET, BY DRUG ORIGIN, 2017-2025 ($MILLION)
TABLE 109. LAMEA ANTIBIOTICS MARKET, BY SPECTRUM OF ACTIVITY, 2017-2025 ($MILLION)
TABLE 110. LAMEA ANTIBIOTICS MARKET, BY ROUTE OF ADMINISTRATION, 2017-2025 ($MILLION)
TABLE 111. ABBOTT: COMPANY SNAPSHOT
TABLE 112. ABBOTT: OPERATING SEGMENTS
TABLE 113. ABBOTT: PRODUCT PORTFOLIO
TABLE 114. ALLERGAN: COMPANY SNAPSHOT
TABLE 115. ALLERGAN: OPERATING SEGMENTS
TABLE 116. ALLERGAN: PRODUCT PORTFOLIO
TABLE 117. ROCHE: COMPANY SNAPSHOT
TABLE 118. ROCHE: OPERATING SEGMENTS
TABLE 119. ROCHE: PRODUCT PORTFOLIO
TABLE 120. GSK: COMPANY SNAPSHOT
TABLE 121. GSK: OPERATING SEGMENTS
TABLE 122. GSK: PRODUCT PORTFOLIO
TABLE 123. MERCK: COMPANY SNAPSHOT
TABLE 124. MERCK: OPERATING SEGMENTS
TABLE 125. MERCK: PRODUCT PORTFOLIO
TABLE 126. MYLAN: COMPANY SNAPSHOT
TABLE 127. MYLAN: OPERATING SEGMENTS
TABLE 128. ALLERGAN: PRODUCT PORTFOLIO
TABLE 129. NOVARTIS AG: COMPANY SNAPSHOT
TABLE 130. NOVARTIS: OPERATING SEGMENTS
TABLE 131. NOVARTIS AG: PRODUCT PORTFOLIO
TABLE 132. PFIZER: COMPANY SNAPSHOT
TABLE 133. PFIZER: OPERATING SEGMENTS
TABLE 134. PFIZER: PRODUCT PORTFOLIO
TABLE 135. SANOFI: COMPANY SNAPSHOT
TABLE 136. SANOFI: OPERATING SEGMENTS
TABLE 137. SANOFI: PRODUCT PORTFOLIO
TABLE 138. TEVA: COMPANY SNAPSHOT
TABLE 139. TEVA: OPERATING SEGMENTS
TABLE 140. TEVA: PRODUCT PORTFOLIO
LIST OF FIGURES
FIGURE 01. ANTIBIOTICS MARKET SEGMENTATION
FIGURE 02. TOP INVESTMENT POCKETS IN THE GLOBAL ANTIBIOTICS MARKET
FIGURE 03. TOP WINNING STRATEGIES, BY YEAR, 2015-2018*
FIGURE 04. TOP WINNING STRATEGIES, BY DEVELOPMENT, 2015-2018* (%)
FIGURE 05. TOP WINNING STRATEGIES, BY COMPANY, 2015-2018*
FIGURE 06. MARKET SHARE ANALYSIS, 2017
FIGURE 07. MODERATE BARGAINING POWER OF BUYERS
FIGURE 08. HIGH BARGAINING POWER OF SUPPLIERS
FIGURE 09. HIGH THREAT OF NEW ENTRANTS
FIGURE 10. MODERATE THREAT OF SUBSTITUTION
FIGURE 11. MODERATE COMPETITIVE RIVALRY
FIGURE 12. PENICILLINS ANTIBIOTICS MARKET, 20172025 ($MILLION)
FIGURE 13. CEPHALOSPORINS ANTIBIOTICS MARKET, 20172025 ($MILLION)
FIGURE 14. CARBAPENEMS ANTIBIOTICS MARKET, 20172025 ($MILLION)
FIGURE 15. MONOBACTAMS ANTIBIOTICS MARKET, 20172025 ($MILLION)
FIGURE 16. COMPARATIVE ANALYSIS OF ANTIBIOTICS MARKET FOR BETA LACTAM AND BETA LACTAMASE INHIBITORS, BY COUNTRY, 2017 & 2025 ($MILLION)
FIGURE 17. COMPARATIVE ANALYSIS OF ANITBIOTICS MARKET FOR QUINOLONES, BY COUNTRY, 2017 & 2025 ($MILLION)
FIGURE 18. COMPARATIVE ANALYSIS OF ANTIBIOTICS MARKET FOR MACROLIDES, BY COUNTRY, 2017 & 2025 ($MILLION)
FIGURE 19. COMPARATIVE ANALYSIS OF ANITBIOTICS MARKET FOR OTHERS, BY COUNTRY, 2017 & 2025 ($MILLION)
FIGURE 20. COMPARATIVE ANALYSIS OF ANTIBIOTICS MARKET FOR NATURAL, BY COUNTRY, 2017 & 2025 ($MILLION)
FIGURE 21. COMPARATIVE ANALYSIS OF ANTIBIOTICS MARKET FOR SEMISYNTHETIC, BY COUNTRY, 2017 & 2025 ($MILLION)
FIGURE 22. COMPARATIVE ANALYSIS OF ANTIBIOTICS MARKET FOR SYNTHETIC, BY COUNTRY, 2017 & 2025 ($MILLION)
FIGURE 23. COMPARATIVE ANALYSIS OF ANTIBIOTICS MARKET FOR BROAD-SPECTRUM ANTIBIOTIC, BY COUNTRY, 2017 & 2025 ($MILLION)
FIGURE 24. COMPARATIVE ANALYSIS OF ANTIBIOTICS MARKET FOR NARROW-SPECTRUM ANTIBIOTIC, BY COUNTRY, 2017 & 2025 ($MILLION)
FIGURE 25. COMPARATIVE ANALYSIS OF ANTIBIOTICS MARKET FOR ORAL, BY COUNTRY, 2017 & 2025 ($MILLION)
FIGURE 26. COMPARATIVE ANALYSIS OF ANTIBIOTICS MARKET FOR INTRAVENOUS, BY COUNTRY, 2017 & 2025 ($MILLION)
FIGURE 27. COMPARATIVE ANALYSIS OF ANTIBIOTICS MARKET FOR OTHERS, BY COUNTRY, 2017 & 2025 ($MILLION)
FIGURE 28. ABBOTT: NET SALES, 20152017 ($MILLION)
FIGURE 29. ABBOTT: REVENUE SHARE BY SEGMENT, 2017 (%)
FIGURE 30. ABBOTT: REVENUE SHARE BY GEOGRAPHY, 2017 (%)
FIGURE 31. ALLERGAN: NET SALES, 20152017 ($MILLION)
FIGURE 32. ALLERGAN: REVENUE SHARE BY SEGMENT, 2017 (%)
FIGURE 33. ROCHE: NET SALES, 20152017 ($MILLION)
FIGURE 34. ROCHE: REVENUE SHARE BY SEGMENT, 2017 (%)
FIGURE 35. GSK: NET SALES, 20152017 ($MILLION)
FIGURE 36. GSK: REVENUE SHARE BY SEGMENT, 2017 (%)
FIGURE 37. GSK: REVENUE SHARE BY GEOGRAPHY, 2017 (%)
FIGURE 38. MERCK: NET SALES, 20152017 ($MILLION)
FIGURE 39. MERCK: REVENUE SHARE BY SEGMENT, 2017 (%)
FIGURE 40. MERCK: REVENUE SHARE BY GEOGRAPHY, 2017 (%)
FIGURE 41. MYLAN: NET SALES, 20152017 ($MILLION)
FIGURE 42. MYLAN: REVENUE SHARE BY GEOGRAPHY, 2017 (%)
FIGURE 43. NOVARTIS: NET SALES, 20152017 ($MILLION)
FIGURE 44. NOVARTIS: REVENUE SHARE BY SEGMENT, 2017 (%)
FIGURE 45. NOVARTIS: REVENUE SHARE BY GEOGRAPHY, 2017 (%)
FIGURE 46. PFIZER: NET SALES, 20152017 ($MILLION)
FIGURE 47. PFIZER: REVENUE SHARE BY SEGMENT, 2017 (%)
FIGURE 48. PFIZER: REVENUE SHARE BY GEOGRAPHY, 2017 (%)
FIGURE 49. SANOFI: NET SALES, 20152017 ($MILLION)
FIGURE 50. SANOFI: REVENUE SHARE BY SEGMENT, 2017 (%)
FIGURE 51. SANOFI: REVENUE SHARE BY GEOGRAPHY, 2017 (%)
FIGURE 52. TEVA: NET SALES, 20152017 ($MILLION)
FIGURE 53. TEVA: REVENUE SHARE BY SEGMENT, 2017 (%)
FIGURE 54. TEVA: REVENUE SHARE BY GEOGRAPHY, 2017 (%)
Access Full Summery @ https://www.alliedmarketresearch.com/antibiotics-market
About Us
Allied Market Research, a market research and advisory company of Allied Analytics LLP, provides business insights and market research reports to large as well as small & medium enterprises. The company assists its clients to strategize business policies and achieve sustainable growth in their respective market domain.
Allied Market Research provides one stop solution from the beginning of data collection to investment advice. The analysts at Allied Market Research dig out factors that help clients to understand the significance and impact of market dynamics. The company amplies client’s insight on the factors, such as strategies, future estimations, growth or fall forecasting, opportunity analysis, and consumer surveys among others. As follows, the company offers consistent business intelligent support to aid the clients to turn into prominent business firm.
Contact
David Correa
5933 NE Win Sivers Drive
#205, Portland, OR 97220
United States
Toll Free: +1-800-792-5285
UK: +44-845-528-1300
Hong Kong: +852-301-84916
India (Pune): +91-20-66346060
Fax: +1⟨855⟩550-5975
help@alliedmarketresearch.com
Web: www.alliedmarketresearch.com
This release was published on openPR.
Permanent link to this press release:
Copy
Please set a link in the press area of your homepage to this press release on openPR. openPR disclaims liability for any content contained in this release.
You can edit or delete your press release Antibiotics Market Expected to Reach $50,374 Million, Growth Analysis By Abbott Laboratories, Allergan Plc., F.Hoffmann-La Roche Ltd., GlaxoSmithKline Plc, Merck & Co. Inc., Mylan N.V., Novartis International AG, Pfizer Inc. here
News-ID: 1349421 • Views: …
More Releases from Allied Market Research

Emerging Technologies in Structural Steel Tube Market in Glob: Innovations and F …
According to the report, "the structural steel tube market" was valued at $105.3 billion in 2023, and is estimated to reach $167.5 billion by 2033, growing at a CAGR of 4.8% from 2024 to 2033.
Allied Market Research published a report, titled, "Structural Steel Tube Market By Type (Hot-Rolled Steel and Cold-Rolled Steel), Material (Stainless Steel Tube, Carbon Steel Tube, Alloy Steel Tube, and Others), Sales Type (Direct,…
Costume Jewelry Market Size Worth USD 86.8 billion by 2033 | Growth Rate (CAGR) …
According to a new report published by Allied Market Research, titled, "costume jewelry market" was valued at $45.2 billion in 2023, and is projected to reach $86.8 billion by 2033, growing at a CAGR of 6.8% from 2024 to 2033.
Get Sample PDF Of This Report: https://www.alliedmarketresearch.com/request-sample/2093
Costume jewelry refers to decorative pieces made of inexpensive materials such as base metals, glass, plastic, or synthetic stones, often adorned with…
Monoisopropanolamine Market: A Comprehensive Analysis of Trends, Growth and Oppo …
The global Monoisopropanolamine (MIPA) Market was pegged at $82.2 million in 2020, and is expected to reach $140.8 million by 2030, growing at a CAGR of 5.6% from 2021 to 2030.
Allied Market Research recently published a report, titled, Monoisopropanolamine (MIPA) Market by End-use Industry (Chemical Industry, Personal Care, Agrochemical, Pharmaceuticals, Metalworking, and Others): Global Opportunity Analysis and Industry Forecast, 2021-2030".
Download Sample Report with Statistical Info: https://www.alliedmarketresearch.com/request-sample/16048…
Treadmill Market Navigating Business with CAGR of 5.1% with Revenue of $5,932.0 …
The global treadmill market size was valued at $3,284.8 million in 2020, and is projected to reach $5,932.0 million by 2030, registering a CAGR of 5.1%.
Request The Sample PDF Of This Report @ https://www.alliedmarketresearch.com/request-sample/4286
Treadmill is widely used for physical fitness equipment for weight management and improving body stamina & muscular strength. Mostly used treadmills are motorized or electronic, owing to advance features offered to users. Rise in…
More Releases for TABLE
Bedside Table With Over-Bed Table Market Size and Forecast
𝐔𝐒𝐀, 𝐍𝐞𝐰 𝐉𝐞𝐫𝐬𝐞𝐲- The global Bedside Table With Over-Bed Table Market is expected to record a CAGR of XX.X% from 2024 to 2031 In 2024, the market size is projected to reach a valuation of USD XX.X Billion. By 2031 the valuation is anticipated to reach USD XX.X Billion.
The global market for bedside tables with over-bed tables is experiencing significant growth due to the rising demand for multifunctional furniture. These…
Table Linen Market to Witness Revolutionary Growth by 2030 | IKEA, URQUILDLINEN, …
Global "Table Linen Market" Research report is an in-depth study of the market Analysis. Along with the most recent patterns and figures that uncovers a wide examination of the market offer. This report provides exhaustive coverage on geographical segmentation, latest demand scope, growth rate analysis with industry revenue and CAGR status. While emphasizing the key driving and restraining forces for this market, the report also offers a complete study of…
Table Tennis Table Market: Competitive Dynamics & Global Outlook 2024
LP INFORMATION offers a latest published report on Table Tennis Table Market Analysis and Forecast 2019-2025 delivering key insights and providing a competitive advantage to clients through a detailed report.
According to this study, over the next five years the Table Tennis Table market will register a xx% CAGR in terms of revenue, the global market size will reach US$ xx million by 2024, from US$ xx million in 2019.…
Table Linen Market Forecast 2017-2022: IKEA, URQUILDLINEN, Premier Table Linens, …
Global Table Linen Market Research Report
A market study ” Global Table Linen Market ” examines the performance of the Table Linen market 2017. It encloses an in-depth Research of the Table Linen market state and the competitive landscape globally. This report analyzes the potential of Table Linen market in the present and the future prospects from various angles in detail.
Inquiry For Sample Report, Click Here: http://bit.ly/2s0g8nd
The Global Table Linen Market…
Global and Chinese Table Tennis Table Market Demand Growth Report 2017
Research carried out a market study on the Table Tennis Table market. The report titled, “Table Tennis Table ”, is an in-depth analysis of the Table Tennis Table market and offers important insights related to the market such as market share, size and growth. The presented study discusses the current trends, opportunities and the challenges in the Table Tennis Table market. Key statistics, growth prospects and the current status…
Billiard Table Manufacturer, Pool Table Supplies
Chevillotte Billiards manufactures the highest standard quality billiards table in the world. Our manufacturing facility has been making billiard table and it's accessories since the 1860's and earned a lots of name and respects in the billiards industry. We manufacture our billiards products as per the requirements of the clients and also assist customized solutions to them. Our range is designed as per the latest market trends and is ideal…
