Press release
Automotive Interiors Market Brief Analysis on Top Key Players Grupo Antolin, Faurecia S.A., Johnson Controls Inc., Calsonic Kansei Corp., Visteon Corporation, Lear Corporation, Delphi Automotive Plc., Hyundai Mobis Company, Ltd, Magna International Inc. a
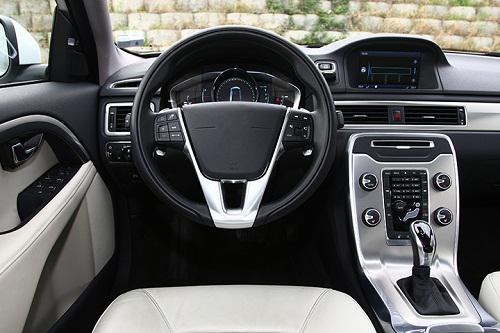
Automotive Interiors Market
Download PDF Report Sample @ https://www.alliedmarketresearch.com/request-sample/1426?utm_source=OpenPr
Automotive interiors play a critical role in influencing the buying decision of the buyer as these are indicative of the vehicle comfort and quality. Major factors that drive the growth of the market are rising income levels, growing automotive industry, and the increasing consumer demand for innovative and technologically advanced systems, for an enhanced driving experience.
In line with the increasing consumer demand of customized and technologically advanced vehicle interiors, companies in the market are constantly developing superior products with enhanced features. For instance, in April 2014, Grupo Antolin launched a new lighted headliner, aimed at making the vehicle interiors more attractive, pleasant and comfortable.
Moreover, manufacturers focus more on usage of lightweight and highly durable materials in designing of components so as to reduce the weight of vehicles. For instance, in 2014, TRW Automotive Holding introduced a new version of the inflator with an aim to reduce weight. This new airbag was 5 mm smaller in diameter, 50 mm shorter in length, and weighed about 35% less than previous generation technology. The growth of the market is affected by stringent government regulations regarding safe disposable of effluents released by automotive interior manufacturers.
The market is segmented on the basis of vehicle type, component, and geography. On the basis of vehicle type, the market is categorized into passenger car and commercial vehicle (light commercial vehicle and heavy commercial vehicle). Component wise, the market is segregated into Cockpit Module, Flooring, Door Panel, Automotive Seat, Interior Lighting and others (sun visors, headliner, overhead and acoustic system). Geographically, the market is segmented across North America, Europe, Asia-Pacific, and LAMEA. Asia-Pacific is the prominent market in the automotive interior market worldwide, followed by Europe and North America. The market in these regions has been further broken down into major countries within each region.
Get Customized Report @ https://www.alliedmarketresearch.com/request-for-customization/1426?utm_source=OpenPr
Key players that operate in the automotive interior market are Grupo Antolin, Faurecia Interior System, Johnson Controls, Calsonic Kansei Corp., Visteon, Lear Corporation, Delphi Automotive LLP, Hyundai Mobis Company, Ltd, TACHI-S CO., LTD. and IAC Group. Prominent players operating in the automotive interior market adopt strategies such as acquisition, partnership, expansion, and product launch to increase their geographical presence and strengthen their market share.
List of Figures
FIG. 1 TOP IMPACTING FACTORS
FIG. 2 TOP WINNING STRATEGIES IN THE AUTOMOTIVE INTERIORS MARKET
FIG. 3 TOP WINNING STRATEGIES (%)
FIG. 4 TOP INVESTMENT POCKETS
FIG. 5 PORTER’S FIVE FORCES ANALYSIS
FIG. 6 VALUE CHAIN OF AUTOMOTIVE INTERIORS MARKET
FIG. 7 MARKET SHARE ANALYSIS, 2015 (% COMPARISON)
FIG. 8 CAR INTERIORS EVOLUTION
FIG. 9 BLOCK DIAGRAM OF IN-CAR INFOTAINMENT SYSTEM
FIG. 10 COMPARITIVE REGIONAL MARKET SHARE ANALYSIS OF WORLD AUTOMOTIVE COCKPIT MODULE MARKET, 2015 & 2022 (% SHARE)
FIG. 11 WORLD AUTOMOTIVE COCKPIT MODULE MARKET REVENUE, 2015-2022 ($MILLION)
FIG. 12 WORLD AUTOMOTIVE COCKPIT MODULE MARKET SHARE ANALYSIS BY GEOGRAPHY, 2015-2022 (%)
FIG. 13 COMPARITIVE REGIONAL MARKET SHARE ANALYSIS OF WORLD AUTOMOTIVE INFOTAINMENT MARKET, 2015 & 2022 (% SHARE)
FIG. 14 WORLD AUTOMOTIVE INFOTAINMENT SYSTEM MARKET REVENUE, 2015-2022 ($MILLION)
FIG. 15 WORLD AUTOMOTIVE INFOTAINMENT SYSTEM MARKET REVENUE BY GEOGRAPHY, 2015-2022 (%)
FIG. 16 COMPARITIVE REGIONAL MARKET SHARE ANALYSIS OF WORLD AUTOMOTIVE INSTRUMENT CLUSTER MARKET, 2015 & 2022 (% SHARE)
FIG. 17 WORLD AUTOMOTIVE INSTRUMENT CLUSTER MARKET REVENUE, 2015-2022 ($MILLION)
FIG. 18 COMPARITIVE REGIONAL MARKET SHARE ANALYSIS OF WORLD AUTOMOTIVE TELEMATICS MARKET, 2015 & 2022 (% SHARE)
FIG. 19 WORLD AUTOMOTIVE TELEMATICS MARKET REVENUE, 2015-2022 ($MILLION)
FIG. 20 COMPARITIVE REGIONAL MARKET SHARE ANALYSIS OF WORLD AUTOMOTIVE OTHERS (AUDIO, CONNECTIVITY) MARKET, 2015 & 2022 (% SHARE)
FIG. 21 WORLD AUTOMOTIVE OTHER (AUDIO, CONNECTIVITY) MARKET REVENUE, 2015-2022 ($MILLION)
FIG. 22 COMPARITIVE REGIONAL MARKET SHARE ANALYSIS OF WORLD AUTOMOTIVE FLOORING MARKET, 2015 & 2022 (% SHARE)
FIG. 23 WORLD AUTOMOTIVE FLOORING MARKET REVENUE, 2015-2022 ($MILLION)
FIG. 24 COMPARITIVE REGIONAL MARKET SHARE ANALYSIS OF WORLD AUTOMOTIVE DOOR PANEL MARKET, 2015 & 2022 (% SHARE)
FIG. 25 WORLD AUTOMOTIVE DOOR PANEL MARKET REVENUE, 2015-2022 ($MILLION)
FIG. 26 COMPARITIVE REGIONAL MARKET SHARE ANALYSIS OF WORLD AUTOMOTIVE SEAT MARKET, 2015 & 2022 (% SHARE)
FIG. 27 WORLD AUTOMOTIVE SEAT MARKET REVENUE, 2015-2022 ($MILLION)
FIG. 28 COMPARITIVE REGIONAL MARKET SHARE ANALYSIS OF WORLD AUTOMOTIVE INTERIOR LIGHTING MARKET, 2015 & 2022 (% SHARE)
FIG. 29 WORLD AUTOMOTIVE INTERIOR LIGHTING MARKET REVENUE, 2015-2022 ($MILLION)
FIG. 30 COMPARITIVE REGIONAL MARKET SHARE ANALYSIS OF WORLD AUTOMOTIVE OTHER (SUN VISORS, HEADLINERS, ACOUSTIC SYSTEMS AND OVERHEAD SYSTEMS) MARKET, 2015 & 2022 (% SHARE)
FIG. 31 WORLD AUTOMOTIVE OTHER (SUN VISORS, HEADLINERS, ACOUSTIC SYSTEMS AND OVERHEAD SYSTEMS MARKET REVENUE, 2015-2022 ($MILLION)
FIG. 32 COMPARITIVE MARKET SHARE ANALYSIS OF WORLD AUTOMOTIVE INTERIORS MARKET BY VEHICLE TYPE, 2015 & 2022 (% SHARE)
FIG. 33 COMPARITIVE REGIONAL MARKET SHARE ANALYSIS OF WORLD AUTOMOTIVE PASSENGER CAR MARKET, 2015 & 2022 (% SHARE)
FIG. 34 WORLD AUTOMOTIVE PASSENGER CARS MARKET REVENUE, 2015-2022 ($MILLION)
FIG. 35 COMPARITIVE REGIONAL MARKET SHARE ANALYSIS OF WORLD AUTOMOTIVE LIGHT COMMERCIAL VEHICLE MARKET, 2015 & 2022 (% SHARE)
FIG. 36 WORLD AUTOMOTIVE LIGHT COMMERCIAL VEHICLE MARKET REVENUE, 2015-2022 ($MILLION)
FIG. 37 COMPARITIVE REGIONAL MARKET SHARE ANALYSIS OF WORLD AUTOMOTIVE HEAVY COMMERCIAL VEHICLE MARKET, 2015 & 2022 (%)
FIG. 38 WORLD AUTOMOTIVE HEAVY COMMERCIAL VEHICLE MARKET REVENUE, 2015-2022 ($MILLION)
FIG. 39 COMPARITIVE MARKET SHARE ANALYSIS OF WORLD AUTOMOTIVE INTERIORS MARKET BY COMPONENT TYPE, 2015 & 2022 (% SHARE)
FIG. 40 COMPARITIVE AUTOMOTIVE INTERIORS TYPE MARKET SHARE ANALYSIS OF NORTH AMERICA MARKET, 2015 & 2022 (% SHARE)
FIG. 41 CANADA AUTOMOTIVE INTERIORS MARKET, 2015-2022 ($MILLION)
FIG. 42 MEXICO AUTOMOTIVE INTERIORS MARKET, 2015-2022 ($MILLION)
FIG. 43 UNITED STATES AUTOMOTIVE INTERIORS MARKET, 2015-2022 ($MILLION)
FIG. 44 COMPARITIVE AUTOMOTIVE INTERIORS TYPE MARKET SHARE ANALYSIS OF EUROPE MARKET, 2015 & 2022 (% SHARE)
FIG. 45 GERMANY AUTOMOTIVE INTERIORS MARKET, 2015-2022 ($MILLION)
FIG. 46 FRANCE AUTOMOTIVE INTERIORS MARKET, 2015-2022 ($MILLION)
FIG. 47 RUSSIA AUTOMOTIVE INTERIORS MARKET, 2015-2022 ($MILLION)
FIG. 48 UNITED KINGDOM AUTOMOTIVE INTERIORS MARKET, 2015-2022 ($MILLION)
FIG. 49 REST OF EUROPE AUTOMOTIVE INTERIORS MARKET, 2015-2022 ($MILLION)
FIG. 50 COMPARITIVE AUTOMOTIVE INTERIORS TYPE MARKET SHARE ANALYSIS OF ASIA-PACIFIC MARKET, 2015 & 2022 (% SHARE)
FIG. 51 CHINA AUTOMOTIVE INTERIORS MARKET, 2015-2022 ($MILLION)
FIG. 52 INDIA AUTOMOTIVE INTERIORS MARKET, 2015-2022 ($MILLION)
FIG. 53 JAPAN AUTOMOTIVE INTERIORS MARKET, 2015-2022 ($MILLION)
FIG. 54 AUSTRALIA AUTOMOTIVE INTERIORS MARKET, 2015-2022 ($MILLION)
FIG. 55 REST OF APAC AUTOMOTIVE INTERIORS MARKET, 2015-2022 ($MILLION)
FIG. 56 COMPARITIVE AUTOMOTIVE INTERIORS TYPE MARKET SHARE ANALYSIS OF LAMEA MARKET, 2015 & 2022 (% SHARE)
FIG. 57 SOUTH AFRICA AUTOMOTIVE INTERIORS MARKET, 2015-2022 ($MILLION)
FIG. 58 BRAZIL AUTOMOTIVE INTERIORS MARKET, 2015-2022 ($MILLION)
FIG. 59 UAE AUTOMOTIVE INTERIORS MARKET, 2015-2022 ($MILLION)
FIG. 60 REST OF LAMEA AUTOMOTIVE INTERIORS MARKET, 2015-2022 ($MILLION)
FIG. 61 TOTAL SALES OF FAURECIA S.A., 2013-2014, $MILLION
FIG. 62 TOTAL SALES OF FAURECIS S.A. BY SEGMENT, 2014 (%)
FIG. 63 TOTAL SALES OF FAURECIS S.A. BY GEOGRAPHY, 2014 (%)
FIG. 64 SWOT ANALYSIS OF FAURECIA S.A.
FIG. 65 NET SALES OF LEAR CORPORATION, 2013-2015, ($MILLION)
FIG. 66 NET SALES OF LEAR CORPORATION BY SEGMENT, 2015 (%)
FIG. 67 NET SALES OF LEAR CORPORATION BY GEOGRAPHY, 2015 (%)
FIG. 68 SWOT ANALYSIS OF LEAR CORPORATION
FIG. 69 TOTAL SALES OF GRUPO ANTOLIN, 2012-2014, ($MILLION)
FIG. 70 TOTAL SALES OF GROUPO ANTOLIN BY GEOGRAPHY, 2014 (%)
FIG. 71 TOTAL SALES OF GRUPO ANTOLIN BY SEGMENT, 2015 (%)
FIG. 72 SWOT ANALYSIS OF GROUPO ANTOLIN
FIG. 73 NET SALES OF JOHNSON CONTROLS INC., 2013-2015, ($MILLION)
FIG. 74 NET SALES OF JOHNSON CONTROLS INC. BY SEGMENT, 2015 (%)
FIG. 75 NET SALES OF JOHNSON CONTROLS INC. BY GEOGRAPHY, 2015
FIG. 76 SWOT ANALYSIS OF JOHNSON CONTROLS INC.
FIG. 77 NET SALES VISTEON CORPORATION, 2013-2015, ($MILLION)
FIG. 78 NET SALES OF VISTEON CORPORATION BY GEOGRAPHY, 2015, (%)
FIG. 79 NET SALES OF VISTEON CORPORATION BY PRODUCT, 2015 (%)
FIG. 80 SWOT ANALYSIS OF VISTEON CORPORATION.
FIG. 81 NET SALES DELPHI AUTOMOTIVE PLC, 2013-2015, ($MILLION)
FIG. 82 NET SALES OF DELPHI AUTOMOTIVE PLC BY SEGMENT, 2015 (%)
FIG. 83 NET SALES OF DELPHI AUTOMOTIVE PLC. BY GEOGRAPHY, 2015, (%)
FIG. 84 SWOT ANALYSIS OF DELPHI AUTOMOTIVE PLC
FIG. 85 NET SALES OF CALSONIC KANSEI CORPORATION, 2015
FIG. 86 NET SALES OF CALSONIC KANSEI CORPORATION BY GEOGRAPHY, 2014, (%)
FIG. 87 SWOT ANALYSIS OF CALSONIC KANSEI CORPORATION
FIG. 88 REVENUE OF HYUNDAI MOBIS COMPANY, LTD, 2013-2015, ($MILLION)
FIG. 89 REVENUE OF HYUNDAI MOBIS COMPANY, LTD BY GEOGRAPHY, 2015, (%)
FIG. 90 SWOT ANALYSIS OF HYUNDAI MOBIS COMPANY, LTD.
FIG. 91 REVENUE OF INTERNATIONAL AUTOMOTIVE COMPONENTS GROUP S.A. (IAC)., 2010-2012, ($MILLION)
FIG. 92 REVENUE OF INTERNATIONAL AUTOMOTIVE COMPONENTS GROUP S.A. (IAC).BY GEOGRAPHY, 2012, (%)
FIG. 93 SWOT ANALYSIS OF INTERNATIONAL AUTOMOTIVE COMPONENTS GROUP S.A (IAC)
FIG. 94 NET SALES OF TACHI-S CO., LTD., 2013-2015, ($MILLION)
FIG.95 SWOT ANALYSIS OF TACHI-S CO., LTD.
Access Full Summery @ https://www.alliedmarketresearch.com/automotive-interiors-market?utm_source=OpenPr
About Us
Allied Market Research (AMR) is a full-service market research and business-consulting wing of Allied Analytics LLP based in Portland, Oregon. Allied Market Research provides global enterprises as well as medium and small businesses with unmatched quality of "Market Research Reports" and "Business Intelligence Solutions.” AMR has a targeted view to provide business insights and consulting to assist its clients to make strategic business decisions and achieve sustainable growth in their respective market domain.
We are in professional corporate relations with various companies and this helps us in digging out market data that helps us generate accurate research data tables and confirms utmost accuracy in our market forecasting. Each and every data presented in the reports published by us is extracted through primary interviews with top officials from leading companies of domain concerned. Our secondary data procurement methodology includes deep online and offline research and discussion with knowledgeable professionals and analysts in the industry.
Contact:
David Correa
5933 NE Win Sivers Drive
#205, Portland, OR 97220
United States
Toll Free (USA/Canada):
+1-800-792-5285, +1-503-894-6022, +1-503-446-1141
UK: +44-845-528-1300
Hong Kong: +852-301-84916
India (Pune): +91-20-66346060
Fax: +1?855?550-5975
help@alliedmarketresearch.com
Web: https://www.alliedmarketresearch.com
This release was published on openPR.
Permanent link to this press release:
Copy
Please set a link in the press area of your homepage to this press release on openPR. openPR disclaims liability for any content contained in this release.
You can edit or delete your press release Automotive Interiors Market Brief Analysis on Top Key Players Grupo Antolin, Faurecia S.A., Johnson Controls Inc., Calsonic Kansei Corp., Visteon Corporation, Lear Corporation, Delphi Automotive Plc., Hyundai Mobis Company, Ltd, Magna International Inc. a here
News-ID: 1336198 • Views: …
More Releases from Allied Market Research
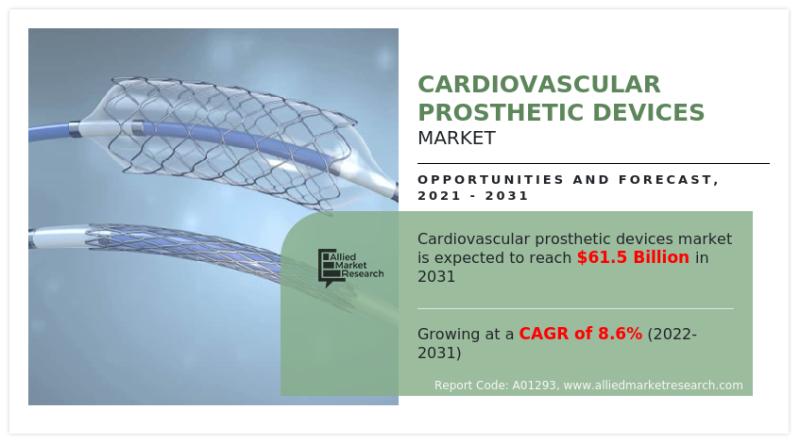
Cardiovascular Prosthetic Devices Market | (USD 61,469.8 Million By 2031) Set to …
The Cardiovascular Prosthetic Devices Market is at the forefront of modern medicine, dedicated to restoring and enhancing heart health. These cutting-edge devices, including heart valves, stents, and pacemakers, are designed to replace or support damaged cardiac structures, ensuring that patients with cardiovascular conditions can lead healthier lives. With ongoing innovations, minimally invasive techniques, and a growing aging population, the cardiovascular prosthetic devices market continues to evolve, offering hope to those…
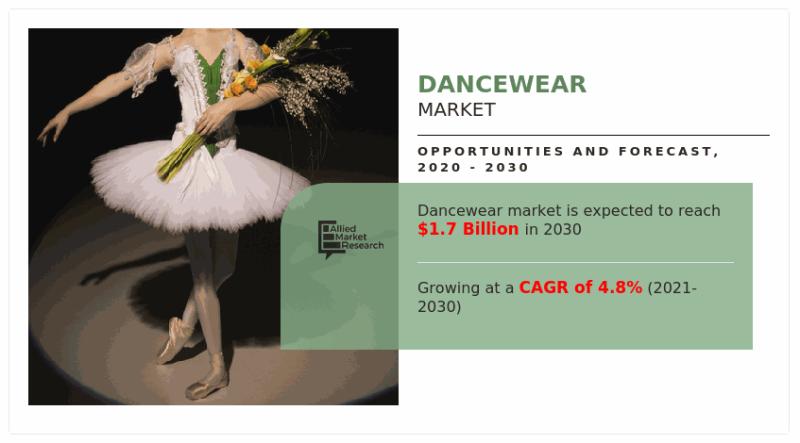
Dancewear Market Trends to Witness Astonishing Growth ; to Reach USD 1.7 Billion …
According to a new report published by Allied Market Research, titled, "Dancewear Market," The dancewear market size was valued at $1.1 billion in 2020, and is estimated to reach $1.7 billion by 2030, growing at a CAGR of 4.8% from 2021 to 2030. Dancewear is a type of clothing and footwear that comes in a variety of colors, fabrics, materials, sizes, and designs that are suitable for a certain range…
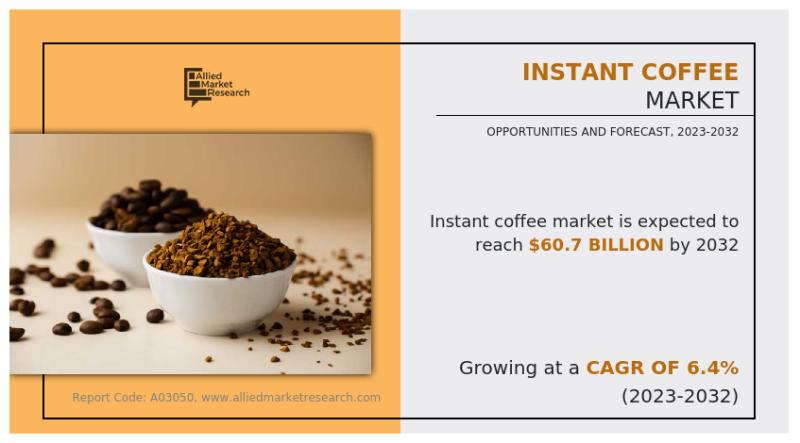
Instant Coffee Market was valued at $32,926.0 million in 2022 and to grow at a C …
The global instant coffee industry was valued at $32,926.0 million in 2022, and is projected to reach $60,739.8 million by 2032, registering a CAGR of 6.4% from 2023 to 2032.
The rapid growth of instant coffee is attributed primarily to the increasing demand for quick beverage solutions. This surge is fueled by the preferences of the younger generation for instant beverages, as they seek a café-like experience within the confines of…
Event Services Market to Reflect Growth Potential with a Highest CAGR of 7.6% fr …
Allied Market Research published a report, titled, "Event Services Market by Service (Strategy, Planning, Budget, and market Development, Communication and Logistics, Attendees Management and Engagement, Event Catering, Virtual or Hybrid Event Enabler, Location Rental, Others), by Event Type (Music Concert, Festivals, Sports, Exhibitions and Conferences, Corporate Events and Seminars, Others), by End User (Corporate, Sports, Education, Entertainment, Others), by Organization (Small and Medium Enterprises, Large Enterprises, Government Bodies and NGOs):…
More Releases for FIG
California Figs Market Size, Growth Analysis by Key Manufacturers, Forecast 2023 …
The California Figs Market Report provides a global overview of market shares, size, statistics, trends, consumer demand, revenue, and expansion possibilities by major companies, regions, and nations. This research provides an in-depth analysis of the market for the past, present, and projection period through 2032, assisting in the identification of emerging opportunities, risk factors, and growth sectors. In order to get access to the most recent government laws, market data,…
Fig Ingredient market: Reliable Market Size and Share Forecasts up to 2029 | Dip …
"QY Research holds tons of experience in offering comprehensive and accurate analysis of global as well as regional markets. The report presented here is an industry-best compilation of detailed and quality research studies on the global Fig Ingredient market. It provides SWOT, PESTLE, and other important types of analysis to give a real and complete picture of the current and future scenarios of the global Fig Ingredient market. The analysts…
Fig Snacks Market Revenue Sizing Outlook Appears Bright
This intelligence report provides a comprehensive analysis of the Global Fig Snacks Market. This includes Investigation of past progress, ongoing market scenarios, and future prospects. Data True to market on the products, strategies and market share of leading companies of this particular market are mentioned. It’s a 360-degree overview of the global market's competitive landscape. The report further predicts the size and valuation of the global market during the forecast…
Fig Ingredient Market 2024 | Go Figa, Diptyque, Tuscan Fig, Pixi Beauty, the bod …
Growing need for production of several food products including confectionery, dairy, and bakery products has led to an upsurge in demand for fig ingredients globally. Moreover, surge in demand for fig for production of various personal care, and cosmetic products is further expected to impact growth of the global market positively. According to a recently published report, the global fig ingredient market is expected to register a steady growth over…
Fig Ingredient Market Research Report 2017-2027 | Diptyque, Tuscan Fig, Pixi Bea …
"The Latest Research Report Fig Ingredient Market: Global Industry Analysis and Opportunity Assessment 2017-2027 provides information on pricing, market analysis, shares, forecast, and company profiles for key industry participants. - MarketResearchReports.biz"
Fig is a fruit of ficus carica, an Asian species of flowering plant comes from mulberry family which is known as common fig. it’s the native fruit of Asia and Middle East. It’s been grown since ancient days both for…
Global Fig Ingredient Market Insights, Status, Competition Landscape, Region, An …
A newly compiled business intelligent report, titled “Global Fig Ingredient Market Insights, Forecast to 2025” has been publicized to the vast archive of Market Research Hub (MRH) online repository. The study revolves around the analysis of (Fig Ingredient Market) market, covering key industry developments and market opportunity map during the mentioned forecast period. This report further conveys quantitative & qualitative analysis on the concerned market, providing a 360 view on…
