Press release
Oil Shale Market is Expected to Reach $5,636 Million, By Top Leading Companies American Resource Petroleum Corp., Chevron Shale Oil Company, Exxon Mobil Corp, American Shale Oil Corp. (AMSO), AFSK HOM TOV
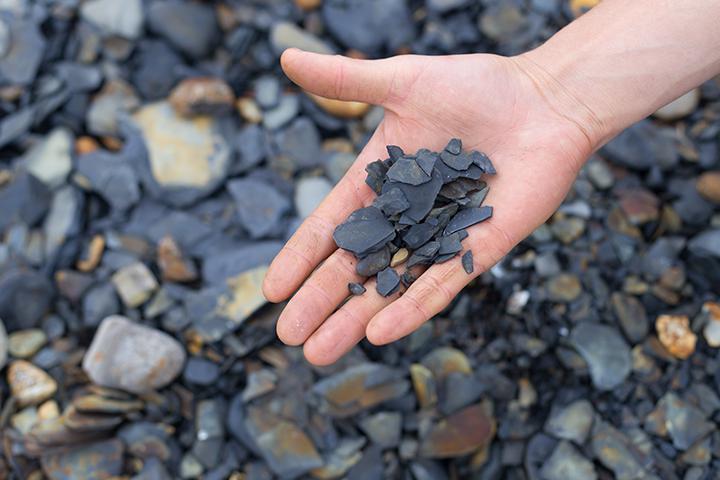
Oil Shale Market
Oil shale is a sedimentary rock formation, which contains organic matter such as kerogen, bitumen, and others. This organic matter on exposure to heat produces liquid hydrocarbon products at different temperatures. The recovery of hydrocarbon is done from shale, and it requires advanced drilling technology such as hydrofracturing.
Download PDF Report Sample @ https://www.alliedmarketresearch.com/request-sample/3636?utm_source=OPR
On the basis of product type, the market is segmented into oil, gas, coke, and others. Oil is the most lucrative product type segment in the oil shale market as there is large proportion of oil present in kerogen. Kerogen is the organic compound that is extracted from oil shale.
On the basis of process, the market is divided into in-situ and ex-situ. The in-situ method is projected to be the most lucrative segment, owing to its environment-friendly extraction of oil shale. During the extraction of oil shale, the ground water is contaminated by the chemical that is used in the extraction process. Recent development in the in-situ method is more effective against contamination as a frozen wall is made, which is used to protect the ground water from contamination.
Based on application, the market is bifurcated into electricity, fuel, cement, and others. The cement segment is estimated to grow at the highest CAGR during the forecast period, owing to the large production of spent shale during kerogen extraction. This spent shale is used as an ingredient in the cement industry to produce cement.
The oil shale market is segmented based on product type, process, application, and country. Based on product type, the market is segmented into oil, gas, coke, and others. By process, it is bifurcated into in-situ and ex-situ. Based on application, the market is divided into electricity, fuel, cement, and others. The market is analyzed based on country into the U.S., Estonia, Russia, China, and Brazil. The oil shale resource analysis is done on various countries which include Canada, Democratic Republic of the Congo, Italy, Jordan, Australia, Morocco, U.S., Estonia, Russia, China, Brazil and other countries.
Get Customized Report @ https://www.alliedmarketresearch.com/request-for-customization/3636?utm_source=OPR
In 2017, Estonia and China collectively accounted for more than fourth-fifth share of the global oil shale market, in terms of value. This is attributed to the growing inclination on unconventional oil & gas coupled with new development of extraction techniques, which drives the growth of the Estonia and China oil shale market. Moreover, upsurge in the number of oil shale projects in Estonia and China offers growth opportunities to the oil shale market.
The major players profiled in this study include American Resource Petroleum Corp., Chevron Shale Oil Company, Exxon Mobil Corp, American Shale Oil Corp. (AMSO), AFSK HOM TOV, and others. To increase the market share, these companies have been adopting different strategies such as business expansion, agreement, acquisition, and joint venture. In an instance, Exxon Mobil Corp acquired various reservoirs across the globe and increased the production & processing capacity of their fields.
Key Findings Of the Oil Shale Market:
• The oil segment accounted for a share of nearly three-fourths in the global oil shale market in 2017 in terms of value.
• The cement segment is anticipated to grow with the highest CAGR throughout the forecast period.
• Estonia accounted for more than three-fourth of the global oil shale market in 2017 in terms of value.
• The U.S. region is anticipated to grow at the highest rate in the global oil shale market during the forecast period, followed by China.
• The electricity segment accounted for a share of nearly three-fourthsin the global oil shale market in 2017 in terms of value.
LIST OF TABLES
TABLE 01. GLOBAL OIL SHALE MARKET VALUE, BY PRODUCT TYPE, 2017-2025 ($MILLION)
TABLE 02. GLOBAL OIL SHALE MARKET VOLUME, BY PRODUCT TYPE, 2017-2025 (MILLION BARRELS)
TABLE 03. GLOBAL OIL SHALE MARKET VALUE FOR OIL, BY COUNTRY, 2017-2025 ($MILLION)
TABLE 04. GLOBAL OIL SHALE MARKET VOLUME FOR OIL, BY COUNTRY, 2017-2025 (MILLION BARRELS)
TABLE 05. GLOBAL OIL SHALE MARKET VALUE FOR GAS, BY COUNTRY, 2017-2025 ($MILLION)
TABLE 06. GLOBAL OIL SHALE MARKET VOLUME FOR GAS, BY COUNTRY, 2017-2025 (MILLION BARRELS)
TABLE 07. GLOBAL OIL SHALE MARKET VALUE FOR COKE, BY COUNTRY, 2017-2025 ($MILLION)
TABLE 08. GLOBAL OIL SHALE MARKET VOLUME FOR COKE, BY COUNTRY, 2017-2025 (MILLION BARRELS)
TABLE 09. GLOBAL OIL SHALE MARKET VALUE FOR OTHERS, BY COUNTRY, 2017-2025 ($MILLION)
TABLE 10. GLOBAL OIL SHALE MARKET VOLUME FOR OTHERS, BY COUNTRY, 2017-2025 (MILLION BARRELS)
TABLE 11. GLOBAL OIL SHALE MARKET VALUE, BY PROCESS, 2017-2025 ($MILLION)
TABLE 12. GLOBAL OIL SHALE MARKET VOLUME, BY PROCESS, 2017-2025 (MILLION BARRELS)
TABLE 13. GLOBAL IN-SITU OIL SHALE MARKET VALUE, BY COUNTRY, 2017-2025 ($MILLION)
TABLE 14. GLOBAL IN-SITU OIL SHALE MARKET VOLUME, BY COUNTRY, 2017-2025 (MILLION BARRELS)
TABLE 15. GLOBAL EX-SITU OIL SHALE MARKET VALUE, BY COUNTRY, 2017-2025 ($MILLION)
TABLE 16. GLOBAL EX-SITU OIL SHALE MARKET VOLUME, BY COUNTRY, 2017-2025 (MILLION BARRELS)
TABLE 17. GLOBAL OIL SHALE MARKET VALUE, BY APPLICATION, 2017-2025 ($MILLION)
TABLE 18. GLOBAL OIL SHALE MARKET VOLUME, BY APPLICATION, 2017-2025 (MILLION BARRELS)
TABLE 19. GLOBAL OIL SHALE MARKET VALUE FOR FUEL, BY COUNTRY, 2017-2025 ($MILLION)
TABLE 20. GLOBAL OIL SHALE MARKET VOLUME FOR FUEL, BY COUNTRY, 2017-2025 (MILLION BARRELS)
TABLE 21. GLOBAL OIL SHALE MARKET VALUE FOR ELECTRICITY, BY COUNTRY, 2017-2025 ($MILLION)
TABLE 22. GLOBAL OIL SHALE MARKET VOLUME FOR ELECTRICITY, BY COUNTRY, 2017-2025 (MILLION BARRELS)
TABLE 23. GLOBAL OIL SHALE MARKET VALUE FOR CEMENT, BY COUNTRY, 2017-2025 ($MILLION)
TABLE 24. GLOBAL OIL SHALE MARKET VOLUME FOR CEMENT, BY COUNTRY, 2017-2025 (MILLION BARRELS)
TABLE 25. GLOBAL OIL SHALE MARKET VALUE FOR OTHERS, BY COUNTRY, 2017-2025 ($MILLION)
TABLE 26. GLOBAL OIL SHALE MARKET VOLUME FOR OTHERS, BY COUNTRY, 2017-2025 (MILLION BARRELS)
TABLE 27. GLOBAL OIL SHALE MARKET VALUE, BY COUNTRY, 2017-2025 ($MILLION)
TABLE 28. GLOBAL OIL SHALE MARKET VOLUME, BY COUNTRY, 2017-2025 (MILLION BARRELS)
TABLE 29. U.S. OIL SHALE MARKET VALUE, BY PROCESS, 2017-2025 ($MILLION)
TABLE 30. U.S. OIL SHALE MARKET VOLUME, BY PROCESS, 2017-2025 (MILLION BARRELS)
TABLE 31. U.S. OIL SHALE MARKET VALUE, BY PRODUCT TYPE, 2017-2025 ($MILLION)
TABLE 32. U.S. OIL SHALE MARKET VOLUME, BY PRODUCT TYPE, 2017-2025 (MILLION BARRELS)
TABLE 33. U.S. OIL SHALE MARKET VALUE, BY APPLICATION, 2017-2025 ($MILLION)
TABLE 34. U.S. OIL SHALE MARKET VOLUME, BY APPLICATION, 2017-2025 (MILLION BARRELS)
TABLE 35. ESTONIA OIL SHALE MARKET VALUE, BY PROCESS, 2017-2025 ($MILLION)
TABLE 36. ESTONIA OIL SHALE MARKET VOLUME, BY PROCESS, 2017-2025 (MILLION BARRELS)
TABLE 37. ESTONIA OIL SHALE MARKET VALUE, BY PRODUCT TYPE, 2017-2025 ($MILLION)
TABLE 38. ESTONIA OIL SHALE MARKET VOLUME, BY PRODUCT TYPE, 2017-2025 (MILLION BARRELS)
TABLE 39. ESTONIA OIL SHALE MARKET VALUE, BY APPLICATION, 2017-2025 ($MILLION)
TABLE 40. ESTONIA OIL SHALE MARKET VOLUME, BY APPLICATION, 2017-2025 (MILLION BARRELS)
TABLE 41. RUSSIA OIL SHALE MARKET VALUE, BY PROCESS, 2017-2025 ($MILLION)
TABLE 42. RUSSIA OIL SHALE MARKET VOLUME, BY PROCESS, 2017-2025 (MILLION BARRELS)
TABLE 43. RUSSIA OIL SHALE MARKET VALUE, BY PRODUCT TYPE, 2017-2025 ($MILLION)
TABLE 44. RUSSIA OIL SHALE MARKET VOLUME, BY PRODUCT TYPE, 2017-2025 (MILLION BARRELS)
TABLE 45. RUSSIA OIL SHALE MARKET VALUE, BY APPLICATION, 2017-2025 ($MILLION)
TABLE 46. RUSSIA OIL SHALE MARKET VOLUME, BY APPLICATION, 2017-2025 (MILLION BARRELS)
TABLE 47. CHINA OIL SHALE MARKET VALUE, BY PROCESS, 2017-2025 ($MILLION)
TABLE 48. CHINA OIL SHALE MARKET VOLUME, BY PROCESS, 2017-2025 (MILLION BARRELS)
TABLE 49. CHINA OIL SHALE MARKET VALUE, BY PRODUCT TYPE, 2017-2025 ($MILLION)
TABLE 50. CHINA OIL SHALE MARKET VOLUME, BY PRODUCT TYPE, 2017-2025 (MILLION BARRELS)
TABLE 51. CHINA OIL SHALE MARKET VALUE, BY APPLICATION, 2017-2025 ($MILLION)
TABLE 52. CHINA OIL SHALE MARKET VOLUME, BY APPLICATION, 2017-2025 (MILLION BARRELS)
TABLE 53. BRAZIL OIL SHALE MARKET VALUE, BY PROCESS, 2017-2025 ($MILLION)
TABLE 54. BRAZIL OIL SHALE MARKET VOLUME, BY PROCESS, 2017-2025 (MILLION BARRELS)
TABLE 55. BRAZIL OIL SHALE MARKET VALUE, BY PRODUCT TYPE, 2017-2025 ($MILLION)
TABLE 56. BRAZIL OIL SHALE MARKET VOLUME, BY PRODUCT TYPE, 2017-2025 (MILLION BARRELS)
TABLE 57. BRAZIL OIL SHALE MARKET VALUE, BY APPLICATION, 2017-2025 ($MILLION)
TABLE 58. BRAZIL OIL SHALE MARKET VOLUME, BY APPLICATION, 2017-2025 (MILLION BARRELS)
TABLE 59. AFSK HOM TOV:COMPANY SNAPSHOT
TABLE 60. AFSK HOM TOV: OPERATING SEGMENTS
TABLE 61. AMERICAN RESOURCES, INC:COMPANY SNAPSHOT
TABLE 62. AMERICAN RESOURCES, INC: OPERATING SEGMENTS
TABLE 63. AMERICAN SHALE OIL CORP.:COMPANY SNAPSHOT
TABLE 64. AMERICAN SHALE OIL CORP.: OPERATING SEGMENTS
TABLE 65. AURASOURCE INC.:COMPANY SNAPSHOT
TABLE 66. AURASOURCE INC.: OPERATING SEGMENTS
TABLE 67. BLUE ENSIGN TECHNOLOGIES LTD:COMPANY SNAPSHOT
TABLE 68. BLUE ENSIGN TECHNOLOGIES LTD: OPERATING SEGMENTS
TABLE 69. CHATTANOOGA CORPORATION:COMPANY SNAPSHOT
TABLE 70. CHATTANOOGA CORPORATION: OPERATING SEGMENTS
TABLE 71. CHEVRON CORPORATION:COMPANY SNAPSHOT
TABLE 72. CHEVRON CORPORATION: OPERATING SEGMENTS
TABLE 73. CHEVRON CORPORATION: PRODUCT PORTFOLIO
TABLE 74. EESTI PLEVKIVI:COMPANY SNAPSHOT
TABLE 75. EESTI PLEVKIVI: OPERATING SEGMENTS
TABLE 76. ELECTRO-PETROLEUM INC.:COMPANY SNAPSHOT
TABLE 77. ELECTRO-PETROLEUM INC.: OPERATING SEGMENTS
TABLE 78. EXXON MOBIL CORPORATION:COMPANY SNAPSHOT
TABLE 79. EXXON MOBIL CORPORATION: OPERATING SEGMENTS
TABLE 80. EXXON MOBIL CORPORATION: PRODUCT PORTFOLIO
Access Full Summery @ https://www.alliedmarketresearch.com/oil-shale-market?utm_source=OPR
About Us
Allied Market Research (AMR) is a full-service market research and business-consulting wing of Allied Analytics LLP based in Portland, Oregon. Allied Market Research provides global enterprises as well as medium and small businesses with unmatched quality of "Market Research Reports" and "Business Intelligence Solutions.” AMR has a targeted view to provide business insights and consulting to assist its clients to make strategic business decisions and achieve sustainable growth in their respective market domain.
We are in professional corporate relations with various companies and this helps us in digging out market data that helps us generate accurate research data tables and confirms utmost accuracy in our market forecasting. Each and every data presented in the reports published by us is extracted through primary interviews with top officials from leading companies of domain concerned. Our secondary data procurement methodology includes deep online and offline research and discussion with knowledgeable professionals and analysts in the industry.
Contact:
David Correa
5933 NE Win Sivers Drive
#205, Portland, OR 97220
United States
Toll Free (USA/Canada):
+1-800-792-5285, +1-503-894-6022, +1-503-446-1141
UK: +44-845-528-1300
Hong Kong: +852-301-84916
India (Pune): +91-20-66346060
Fax: +1?855?550-5975
help@alliedmarketresearch.com
Web: https://www.alliedmarketresearch.com
This release was published on openPR.
Permanent link to this press release:
Copy
Please set a link in the press area of your homepage to this press release on openPR. openPR disclaims liability for any content contained in this release.
You can edit or delete your press release Oil Shale Market is Expected to Reach $5,636 Million, By Top Leading Companies American Resource Petroleum Corp., Chevron Shale Oil Company, Exxon Mobil Corp, American Shale Oil Corp. (AMSO), AFSK HOM TOV here
News-ID: 1492082 • Views: …
More Releases from Allied Market Research

Out-of-Band Authentication Market Insights and Projections: High Hopes for Futur …
According to the report, the global out-of-band authentication industry generated $553.45 million in 2020, and is expected to reach $4.2 billion by 2030, witnessing a CAGR of 22.8% from 2021 to 2030.
Out-of-band (OOB) authentication refers to a method of confirming a user's identity or verifying a transaction using a separate communication channel from the one being used for the main interaction.
Request Sample Report at: https://www.alliedmarketresearch.com/request-sample/4536
For example, if you're logging into…

Philippines Beauty & Personal Care Market to rise up to the USD 4.7 billion by 2 …
The Philippines beauty & personal care market size was valued at $3.3 billion in 2018 and is projected to reach $4.7 billion by 2026, registering a CAGR of 4.8% from 2019 to 2026.The Hypermarket/Supermarket segment was the highest contributor to the market, with $801.5 million in 2018.
Request The Sample PDF of This Report: https://www.alliedmarketresearch.com/request-sample/6493
Market Overview
Beauty & personal care products are the products that are used for…

Online Entertainment Market Exhibit a Remarkable CAGR of 20.82% and is estimated …
The global online entertainment market size is expected to reach $ 652.5 billion by 2027 at a CAGR of 20.82% from 2021 to 2027.
Get Sample PDF Of This Report: https://www.alliedmarketresearch.com/request-sample/6778
Online entertainment refers to entertainment over the internet through smart devices such as smartphones, smart TVs, laptops, and tablets. Proliferation in adoption of smartphones and affordability of internet have led to increase in online traffic, which…
3D Rendering Services Market is Forecasted to Attain US$ 61.65 Billion by 2026, …
The global 3D Rendering Services industry was valued at $8.56 billion in 2018, and is projected to reach $61.65 billion by 2026, growing at a CAGR of 28.10% from 2019 to 2026.
Modelling service is expected to experience significant growth in the upcoming years, as these services are becoming extremely popular marketing services that are used for design, presentation, and sales of any residential or commercial buildings.
Request Sample Report: https://www.alliedmarketresearch.com/request-sample/6174
3D rendering…
More Releases for TABLE
Table Tennis Table Market: Competitive Dynamics & Global Outlook 2024
LP INFORMATION offers a latest published report on Table Tennis Table Market Analysis and Forecast 2019-2025 delivering key insights and providing a competitive advantage to clients through a detailed report.
According to this study, over the next five years the Table Tennis Table market will register a xx% CAGR in terms of revenue, the global market size will reach US$ xx million by 2024, from US$ xx million in 2019.…
Flatwares Market Report 2018: Segmentation by Type (Table Knife, Table Fork, Tab …
Global Flatwares market research report provides company profile for Yamazaki, Reed & Barton, Elegance, Farberware, Gourmet Basics by Mikasa, BergHOFF, Cambridge Silversmith, Ginkgo, Wallace and Others.
This market study includes data about consumer perspective, comprehensive analysis, statistics, market share, company performances (Stocks), historical analysis 2012 to 2017, market forecast 2018 to 2025 in terms of volume, revenue, YOY growth rate, and CAGR for the year 2018 to 2025, etc. The…
Global Table Linen Market 2017: IKEA, URQUILDLINEN, Jomar Table Linens
WiseGuyReports.com adds “Global Table Linen Market Report 2017” reports to its Database.
With the slowdown in world economic growth, the Table Linen industry has also suffered a certain impact, but still maintained a relatively optimistic growth. The past four years, Table Linen market size maintained the average annual growth rate of 1.17% from 18200 million $ in 2013 to 19100 million $ in 2016. BisReport analysts believe that in the next…
Table Linen Market Forecast 2017-2022: IKEA, URQUILDLINEN, Premier Table Linens, …
Global Table Linen Market Research Report
A market study ” Global Table Linen Market ” examines the performance of the Table Linen market 2017. It encloses an in-depth Research of the Table Linen market state and the competitive landscape globally. This report analyzes the potential of Table Linen market in the present and the future prospects from various angles in detail.
Inquiry For Sample Report, Click Here: http://bit.ly/2s0g8nd
The Global Table Linen Market…
Global and Chinese Table Tennis Table Market Demand Growth Report 2017
Research carried out a market study on the Table Tennis Table market. The report titled, “Table Tennis Table ”, is an in-depth analysis of the Table Tennis Table market and offers important insights related to the market such as market share, size and growth. The presented study discusses the current trends, opportunities and the challenges in the Table Tennis Table market. Key statistics, growth prospects and the current status…
Billiard Table Manufacturer, Pool Table Supplies
Chevillotte Billiards manufactures the highest standard quality billiards table in the world. Our manufacturing facility has been making billiard table and it's accessories since the 1860's and earned a lots of name and respects in the billiards industry. We manufacture our billiards products as per the requirements of the clients and also assist customized solutions to them. Our range is designed as per the latest market trends and is ideal…