Press release
Surface Cleaning Products Market: 2017 Global Opportunity, Strategic Analysis, Industry Demand, Status, Outlook and Statistical Forecast to 2022
FACT.MR has been actively involved in offering comprehensive research data concerning various topics which are associated to industrial reference and investor utility. This particular research report titled “Surface Cleaning Products Market Forecast, Trend Analysis & Competition Tracking: Global Review 2017 to 2022” has been added to the wide online database of FACT.MR which discusses the present as well as future market scenario. Readers can access knowledge related to market volume, regional expanse as well as competitive landscape prevailing in the global surface cleaning products market. In order to study development patterns, this smart assessment also focuses on market dynamics, which talks about drivers, restraints and opportunities estimated to influence the concerned market during the period until 2017 to 2022.Request For Sample Report- https://www.factmr.com/connectus/sample?flag=S&rep_id=85
Key Projections for the Global Surface Cleaning Products Market
1- With more than half share of the market in terms of revenues, liquid surface cleaning products will continue to be sought-after among consumers across the globe.
2- Sales of wipes and liquid surface cleaning products are estimated to register a parallel expansion through 2022.
3- In terms of revenues, grocery stores will remain dominant in the global surface cleaning products market, based on distribution channels. However, sales of surface cleaning products in grocery stores are expected to exhibit the lowest CAGR over the forecast period.
4- Sales of surface cleaning products in e-commerce distribution channel are projected to register the highest CAGR through 2022.
5- By packaging format, bottles will remain preferred among consumers in the global market, with revenues account for over half share of the market throughout the forecast period.
6- Pouch is expected to be the second most lucrative packaging format type of surface cleaning products.
7- Europe is expected to retain its dominance in the global surface cleaning products market, closely followed by North America.
8- The markets in Middle East & Africa (MEA), and North America will continue to register similar CAGRs through 2022, North America being a more lucrative region for the market than MEA.
The report has also profiled leading manufacturers of surface cleaning products, which include companies such as Henkel, Reckitt Benckiser, S.C Johnson & Son Inc., Unilever plc, Bombril, Church & Dwight, Clorox, Dabur, Dainihon Jochugiku, Ecover, Kao, Kobayashi Pharmaceutical, Nice Group, and The Procter & Gamble Co.
Browse Full Report With TOC- https://www.factmr.com/report/85/surface-cleaning-products-market
Table of Content
Global Surface Cleaning Products Market Analysis and Forecast By Sales Channel
4.1. Global Surface Cleaning Products Market Size and Forecast By Sales Channel, 2012-2022
4.1.1. Modern Trade Surface Cleaning Products Market Size and Forecast, 2012-2022
4.1.1.1. Revenue (US$ Mn) Comparison, By Region
4.1.1.2. Market Share Comparison, By Region
4.1.1.3. Y-o-Y growth Comparison, By Region
4.1.2. Grocery Store Surface Cleaning Products Market Size and Forecast, 2012-2022
4.1.2.1. Revenue (US$ Mn) Comparison, By Region
4.1.2.2. Market Share Comparison, By Region
4.1.2.3. Y-o-Y growth Comparison, By Region
4.1.3. Convinience Store Surface Cleaning Products Market Size and Forecast, 2012-2022
4.1.3.1. Revenue (US$ Mn) Comparison, By Region
4.1.3.2. Market Share Comparison, By Region
4.1.3.3. Y-o-Y growth Comparison, By Region
4.1.4. E-Commerce Surface Cleaning Products Market Size and Forecast, 2012-2022
4.1.4.1. Revenue (US$ Mn) Comparison, By Region
4.1.4.2. Market Share Comparison, By Region
4.1.4.3. Y-o-Y growth Comparison, By Region
4.1.5. Other Retail Format Surface Cleaning Products Market Size and Forecast, 2012-2022
4.1.5.1. Revenue (US$ Mn) Comparison, By Region
4.1.5.2. Market Share Comparison, By Region
4.1.5.3. Y-o-Y growth Comparison, By Region
Global Surface Cleaning Products Market Analysis and Forecast By Packaging Format
5.1. Global Surface Cleaning Products Market Size and Forecast By Packaging Format, 2012-2022
5.1.1. Bottle Surface Cleaning Products Market Size and Forecast, 2012-2022
5.1.1.1. Revenue (US$ Mn) Comparison, By Region
5.1.1.2. Market Share Comparison, By Region
5.1.1.3. Y-o-Y growth Comparison, By Region
5.1.2. Pouch Surface Cleaning Products Market Size and Forecast, 2012-2022
5.1.2.1. Revenue (US$ Mn) Comparison, By Region
5.1.2.2. Market Share Comparison, By Region
5.1.2.3. Y-o-Y growth Comparison, By Region
5.1.3. Spray Surface Cleaning Products Market Size and Forecast, 2012-2022
5.1.3.1. Revenue (US$ Mn) Comparison, By Region
5.1.3.2. Market Share Comparison, By Region
5.1.3.3. Y-o-Y growth Comparison, By Region
5.1.4. Others Surface Cleaning Products Market Size and Forecast, 2012-2022
5.1.4.1. Revenue (US$ Mn) Comparison, By Region
5.1.4.2. Market Share Comparison, By Region
5.1.4.3. Y-o-Y growth Comparison, By Region
Global Surface Cleaning Products Market Analysis and Forecast By Region
6.1. Global Surface Cleaning Products Market Size and Forecast, 2012-2022
6.1.1. North America Surface Cleaning Products Market Size and Forecast, 2012-2022
6.1.1.1. Revenue (US$ Mn) Comparison, By Product Type
6.1.1.2. Revenue (US$ Mn) Comparison, By Sales Channel
6.1.1.3. Revenue (US$ Mn) Comparison, By Packaging Format
6.1.2. Latin America Surface Cleaning Products Market Size and Forecast, 2012-2022
6.1.2.1. Revenue (US$ Mn) Comparison, By Product Type
6.1.2.2. Revenue (US$ Mn) Comparison, By Sales Channel
6.1.2.3. Revenue (US$ Mn) Comparison, By Packaging Format
6.1.3. Europe Surface Cleaning Products Market Size and Forecast, 2012-2022
6.1.3.1. Revenue (US$ Mn) Comparison, By Product Type
6.1.3.2. Revenue (US$ Mn) Comparison, By Sales Channel
6.1.3.3. Revenue (US$ Mn) Comparison, By Packaging Format
6.1.4. Japan Surface Cleaning Products Market Size and Forecast, 2012-2022
6.1.4.1. Revenue (US$ Mn) Comparison, By Product Type
6.1.4.2. Revenue (US$ Mn) Comparison, By Sales Channel
6.1.4.3. Revenue (US$ Mn) Comparison, By Packaging Format
6.1.5. APEJ Surface Cleaning Products Market Size and Forecast, 2012-2022
6.1.5.1. Revenue (US$ Mn) Comparison, By Product Type
6.1.5.2. Revenue (US$ Mn) Comparison, By Sales Channel
6.1.5.3. Revenue (US$ Mn) Comparison, By Packaging Format
6.1.6. MEA Surface Cleaning Products Market Size and Forecast, 2012-2022
6.1.6.1. Revenue (US$ Mn) Comparison, By Product Type
6.1.6.2. Revenue (US$ Mn) Comparison, By Sales Channel
6.1.6.3. Revenue (US$ Mn) Comparison, By Packaging Format
Continued@@@
Request For Discount On This Report- https://www.factmr.com/connectus/sample?flag=D&rep_id=85
About Fact.MR
Fact.MR is a fast-growing market research firm that offers the most comprehensive suite of syndicated and customized market research reports. We believe transformative intelligence can educate and inspire businesses to make smarter decisions. We know the limitations of the one-size-fits-all approach; that’s why we publish multi-industry global, regional, and country-specific research reports.
Contact Us
Fact.MR
Suite 9884
27 Upper Pembroke Street,
Dublin 2, Ireland
Telephone: +353-1-6111-593
Email: sales@factmr.com/
Web: https://www.factmr.com/
This release was published on openPR.
Permanent link to this press release:
Copy
Please set a link in the press area of your homepage to this press release on openPR. openPR disclaims liability for any content contained in this release.
You can edit or delete your press release Surface Cleaning Products Market: 2017 Global Opportunity, Strategic Analysis, Industry Demand, Status, Outlook and Statistical Forecast to 2022 here
News-ID: 992325 • Views: …
More Releases from Fact.MR

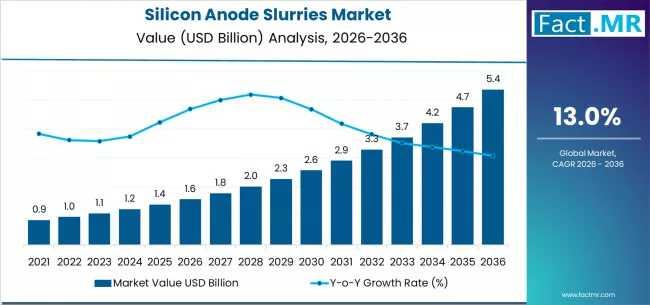
Silicon Anode Slurries Market Forecast 2026-2036: Market Size, Share, Competitiv …
The global silicon anode slurries market is set for significant expansion between 2026 and 2036, fueled by the rising adoption of high-energy-density lithium-ion batteries across electric vehicles (EVs), consumer electronics, and grid-scale energy storage. As battery manufacturers increasingly transition from graphite to silicon-enhanced anodes, the demand for high-performance, scalable silicon anode slurries is projected to grow sharply.
To access the complete data tables and in-depth insights, request a Discount On The…

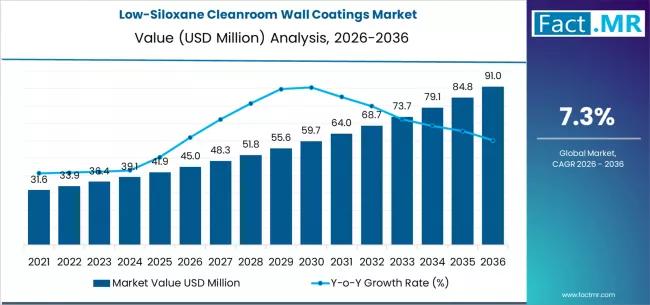
Low-Siloxane Cleanroom Wall Coatings Market Deep-Dive 2026-2036: Strategic Forec …
The low-siloxane cleanroom wall coatings market is poised for steady growth over the next decade, driven by rising contamination-control requirements across semiconductor, pharmaceutical, biotechnology, and precision manufacturing industries. These coatings are specifically engineered to minimize siloxane outgassing and volatile organic compound emissions, helping maintain ultra-clean environments where even trace contamination can disrupt production quality.
By 2036, the market for low-siloxane cleanroom wall coatings is expected to grow to USD 91.04 million.…
More Releases for Comparison
Waveguide port - flange size comparison table
The relationship between waveguide port dimensions, flange [https://www.leader-mw.com/rf-integrated-load-dc-18ghz-with-tab-mount-20w-power-product/] sizes, and frequency bands is standardized to ensure mechanical compatibility and optimal RF performance. Below is a simplified comparison table and key principles for common rectangular waveguides and their associated flanges.
Key Concepts
1. Waveguide Designation: Waveguides are labeled with "WR" (Waveguide Rectangular) followed by a number (e.g., WR-90). The number approximates the inner broad-wall dimension in hundredths of an inch (e.g., WR-90 almost…
Polyester vs Chenille: A Detailed Comparison
Choosing between polyester and chenille can make or break your next furniture purchase, clothing investment, or home decor project. These two fabrics [https://www.yituofabrics.com/cotton-embroidery-fabric/] couldn't be more different-one prioritizes durability and easy care, while the other delivers unmatched softness and luxury.
Polyester dominates the textile industry as a synthetic workhorse that resists wrinkles, dries quickly, and costs less than most alternatives. Chenille offers the plush, velvety texture that makes blankets irresistible and…
Velvet vs Chenille: A Comprehensive Comparison
Choosing between velvet and chenille for your furniture can make or break your living space's comfort and style. These two popular upholstery fabrics might both feel soft, but they're completely different in terms of durability, maintenance, and overall vibe.
Chenille gives you that cozy, lived-in comfort that's perfect for Netflix marathons and family gatherings. Velvet delivers luxury and elegance but demands more careful treatment to keep looking its best.
Chenille
Chenille is a…
Fabric Cutting Methods: A Technical Comparison
Introduction to Cutting Technologies
Modern textile production utilizes various cutting methods, each with distinct advantages depending on application requirements. This analysis compares four primary techniques to help professionals select optimal solutions for their operations.
Laser cutting fabric has become a popular technique for creating precise, intricate designs. The process works best with materials that are stable, heat-resistant, and easy to cut. Common fabrics for laser cutting include cotton, polyester, felt, and synthetic…
STM32F vs STM32G: A Comprehensive Comparison
When it comes to embedded systems development, selecting the right microcontroller (MCU) can significantly impact the performance, power consumption, and cost-effectiveness of your project. STM32F vs STM32G ( https://www.chipmall.com/blogs/stm32f-vs-stm32g_92 ) is a common comparison in the embedded community, as both series from STMicroelectronics offer powerful solutions, but they serve different needs and use cases. The STM32F and STM32G families, both based on ARM Cortex-M cores, provide developers with a wide…
Moneybrag.com Offers Reliable Financial Comparison Services
Moneybrag.com is a leading online firm that specializes in online comparison services that enable clients to make comparisons of utility and personal finance products. Their primary goal is to provide information in an understandable format that allows for initial comparisons to be made at a glance. This enables customers to make healthy financial decisions. Moneybrag.com gives customers the ability to compare side by side and select a vendor based on…
