Press release
Natural Gas Price Trend and Forecast: What Buyers Need to Know in 2025
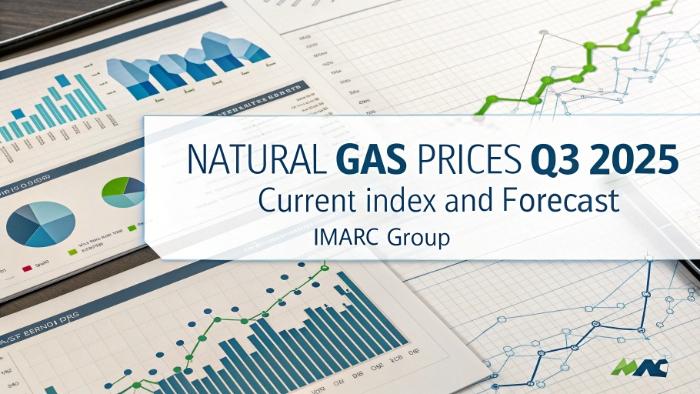
Natural Gas Prices
Natural Gas Prices in United States:
In the United States, Natural Gas prices averaged USD 3.81 per MMBtu in Q3 2025, supported by strong power generation demand and consistent domestic production. The Natural Gas Price Trend 2025 shows steady pricing influenced by storage levels and seasonal consumption. Reviewing the Natural Gas Price History, the U.S. market typically demonstrates stability due to abundant shale output and robust pipeline infrastructure.
Get the Real-Time Prices Analysis: https://www.imarcgroup.com/natural-gas-pricing-report/requestsample
Note: The analysis can be tailored to align with the customer's specific needs.
Natural Gas Price Trends Analysis in APAC: Q3 2025 Overview
Natural Gas Prices in China:
China recorded Natural Gas prices at USD 2.72 per MMBtu in Q3 2025, reflecting competitive rates driven by growing LNG imports and rising industrial consumption. The Natural Gas Price Trend 2025 indicates moderate growth supported by urban gas expansion and clean-energy transition initiatives. Historically, the Natural Gas Price History in China shows gradual increases aligned with policy-driven energy diversification and expanding gas infrastructure.
Regional Analysis: The price analysis can be extended to provide detailed natural gas price information for the following list of countries.
China, India, Indonesia, Pakistan, Bangladesh, Japan, Philippines, Vietnam, Thailand, South Korea, Malaysia, Nepal, Taiwan, Sri Lanka, Hongkong, Singapore, Australia, and New Zealand, among other Asian countries.
Natural Gas Price Trends Analysis in MEA: Q3 2025 Overview
Natural Gas Prices in Saudi Arabia:
In Saudi Arabia, Natural Gas prices averaged USD 2.75 per MMBtu in Q3 2025, maintaining one of the lowest global price levels. The Natural Gas Price Trend 2025 remains stable due to abundant domestic supply and government-regulated pricing. Based on the Natural Gas Price History, Saudi Arabia continues to benefit from low-cost production linked to its integrated oil and gas ecosystem, ensuring competitive industrial energy inputs.
Regional Analysis: The price analysis can be extended to provide detailed natural gas price information for the following list of countries.
Saudi Arabia, UAE, Israel, Iran, South Africa, Nigeria, Oman, Kuwait, Qatar, Iraq, Egypt, Algeria, and Morocco, among other Middle Eastern and African countries.
Natural Gas Price Trends in Europe: Q3 2025 Overview
Caustic Soda Prices in Germany:
Germany's Natural Gas prices reached USD 11.6 per MMBtu in Q3 2025, reflecting heightened energy costs and ongoing import dependency. The Natural Gas Price Trend 2025 shows upward pressure driven by geopolitical constraints and strong demand from heating and manufacturing sectors. Reviewing the Natural Gas Price History, Europe-particularly Germany-has consistently experienced elevated pricing due to limited local production and reliance on LNG and pipeline imports.
Regional Analysis: The price analysis can be expanded to include detailed natural gas price data for a wide range of European countries:
such as Germany, France, the United Kingdom, Italy, Spain, Russia, Turkey, the Netherlands, Poland, Sweden, Belgium, Austria, Ireland, Switzerland, Norway, Denmark, Romania, Finland, the Czech Republic, Portugal, and Greece, along with other European nations.
Natural Gas Price Trends Analysis in APAC: Q3 2025 Overview
Natural Gas Prices in India:
In India, Natural Gas prices averaged USD 4.70 per MMBtu in Q3 2025, supported by rising consumption in fertilizer, power, and industrial sectors. The Natural Gas Price Trend 2025 highlights cautious upward movement as LNG imports increase and domestic supply remains constrained. According to the Natural Gas Price History, India's market shows periodic fluctuations influenced by global LNG prices, currency movements, and shifting energy policies.
Regional Analysis: The price analysis can be extended to provide detailed natural gas price information for the following list of countries.
China, India, Indonesia, Pakistan, Bangladesh, Japan, Philippines, Vietnam, Thailand, South Korea, Malaysia, Nepal, Taiwan, Sri Lanka, Hongkong, Singapore, Australia, and New Zealand, among other Asian countries.
Latest News & Recent Developments: Natural Gas Prices Trend, Index, History & Forecast
The global natural gas prices in 2025 has experienced noticeable price fluctuations driven by a blend of weather patterns, production dynamics, and geopolitical events influencing supply and demand across key regions.
Regional Price Highlights
• United States: Prices averaged 3.81 USD/MMBtu in Q3 2025, down due to mild weather lowering heating demand, stable shale production, and ample storage levels. LNG exports faced moderate competition in the global market, while improvements in pipeline logistics helped maintain supply stability.
• China: Prices declined to around 2.72 USD/MMBtu, supported by steady domestic pipeline and LNG imports amid a mild summer and moderated industrial consumption. Government allocations for industrial use caused some temporary imbalances yet the overall market saw supply sufficiency.
• Germany and Europe: Prices retreated to about 11.6 USD/MMBtu in Q3 2025, influenced by lower demand from power generation and industry, boosted by energy efficiency and favorable LNG import availability. Inventory surpluses and currency stability helped ease volatility.
• India: Prices edged up to 4.70 USD/MMBtu, driven by strong industrial and power sector consumption during summer with LNG import costs and domestic pipeline distribution playing essential roles in supply chain equilibrium.
• Brazil and Latin America: Natural gas prices ranged widely, with Brazil in Q3 2025 at roughly 10.78 USD/MMBtu, pressured downward by increasing domestic supply and infrastructure expansion, despite slightly higher demand for power generation.
Key Market Drivers & Factors
• Weather Impacts: Seasonal temperature variations notably influence demand for heating and cooling, causing price volatility.
• Production & Supply: Shale gas output in the U.S., pipeline imports in Asia, and LNG infrastructure investments shape regional supply profiles.
• Geopolitical Events: Tensions affecting pipeline transit, tariffs, and trade policies continue to introduce uncertainty and influence market balance.
• Energy Transition: A surge in LNG adoption as a cleaner alternative and investments in renewables impact demand trajectories.
• Logistical Efficiency: Pipeline maintenance, port congestion, and freight rates critically affect delivery and pricing.
• Economic Growth: Industrial expansion, infrastructure projects, and policy support underpin consumption trends across developing economies.
Historical Price Trends
• The market witnessed significant swings in early 2025 due to erratic weather and supply-demand mismatch.
• Mid-2024 to early 2025 showed price easing as inventories grew and production increased.
• Global events such as geopolitical tensions and tariff changes caused episodic volatility throughout the past year.
Forecast & Outlook
• The natural gas market is projected to grow at a CAGR of about 8.9% through 2033, reaching nearly USD 2.53 trillion.
• Prices are expected to stabilize moderately with ongoing investment in LNG export infrastructure and growing demand in cleaner energy.
• Regional disparities will persist due to varying domestic production, import dependencies, and policy frameworks.
Speak to An Analyst: https://www.imarcgroup.com/request?type=report&id=22409&flag=C
Key Coverage:
• Market Analysis
• Market Breakup by Region
• Demand Supply Analysis by Type
• Demand Supply Analysis by Application
• Demand Supply Analysis of Raw Materials
• Price Analysis
o Spot Prices by Major Ports
o Price Breakup
o Price Trends by Region
o Factors influencing the Price Trends
• Market Drivers, Restraints, and Opportunities
• Competitive Landscape
• Recent Developments
• Global Event Analysis
How IMARC Pricing Database Can Help
The latest IMARC Group study, Natural Gas Prices, Trend, Chart, Demand, Market Analysis, News, Historical and Forecast Data 2025 Edition, presents a detailed analysis of Natural Gas price trend, offering key insights into global Natural Gas market dynamics. This report includes comprehensive price charts, which trace historical data and highlights major shifts in the market.
The analysis delves into the factors driving these trends, including raw material costs, production fluctuations, and geopolitical influences. Moreover, the report examines Natural Gas demand, illustrating how consumer behaviour and industrial needs affect overall market dynamics. By exploring the intricate relationship between supply and demand, the prices report uncovers critical factors influencing current and future prices.
About Us:
IMARC Group is a global management consulting firm that provides a comprehensive suite of services to support market entry and expansion efforts. The company offers detailed market assessments, feasibility studies, regulatory approvals and licensing support, and pricing analysis, including spot pricing and regional price trends. Its expertise spans demand-supply analysis alongside regional insights covering Asia-Pacific, Europe, North America, Latin America, and the Middle East and Africa. IMARC also specializes in competitive landscape evaluations, profiling key market players, and conducting research into market drivers, restraints, and opportunities. IMARC's data-driven approach helps businesses navigate complex markets with precision and confidence.
Contact Us:
IMARC Group
134 N 4th St. Brooklyn, NY 11249, USA
Email: sales[@]imarcgroup.com
Tel No:(D) +91 120 433 0800
United States: +1-201971-6302
This release was published on openPR.
Permanent link to this press release:
Copy
Please set a link in the press area of your homepage to this press release on openPR. openPR disclaims liability for any content contained in this release.
You can edit or delete your press release Natural Gas Price Trend and Forecast: What Buyers Need to Know in 2025 here
News-ID: 4268871 • Views: …
More Releases from IMARC Group
Global Natural Gas Prices Chart Shows Volatile Trend Amid Rising Energy Demand
The global Natural Gas Prices Chart reflects significant volatility in recent years as geopolitical developments, shifting energy demand, and evolving supply dynamics reshape the global energy landscape. Natural gas remains a crucial fuel for power generation, industrial production, and residential heating, making price movements closely tied to macroeconomic trends.
According to recent market observations, the Natural Gas price trend end of the 2025 showed mixed regional movements. While North America experienced…
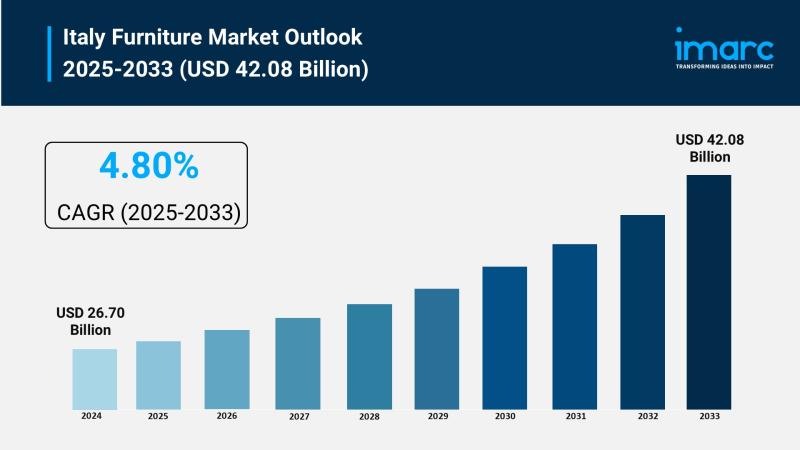
Italy Furniture Market Size to Surpass USD 42.08 Billion by 2033 | With a 4.80% …
Italy Furniture Market Overview
Market Size in 2024: USD 26.70 Billion
Market Size in 2033: USD 42.08 Billion
Market Growth Rate 2025-2033: 4.80%
According to IMARC Group's latest research publication, "Italy Furniture Market: Industry Trends, Share, Size, Growth, Opportunity and Forecast 2025-2033", The Italy furniture market size was valued at USD 26.70 Billion in 2024. Looking forward, IMARC Group estimates the market to reach USD 42.08 Billion by 2033, exhibiting a CAGR of 4.80%…

Global Paracetamol Prices Show Mixed Trend as API Costs Shift
The global Paracetamol Prices has witnessed notable price fluctuations in recent quarters due to changing raw material costs, pharmaceutical demand, and evolving global supply chains.
According to the latest Paracetamol Price Index Report, the market experienced moderate volatility in 2025 as production adjustments in Asia and steady pharmaceutical demand influenced pricing dynamics.
The Paracetamol price trend 2025 indicated a mixed regional movement, with Asia maintaining competitive production levels while Europe and…

South Africa Bottled Water Market Size to Reach USD 3.37 Billion by 2033 | With …
South Africa Bottled Water Market Overview
Market Size in 2024: USD 1.90 Billion
Market Size in 2033: USD 3.37 Billion
Market Growth Rate 2025-2033: 5.88%
According to IMARC Group's latest research publication, "South Africa Bottled Water Market: Industry Trends, Share, Size, Growth, Opportunity and Forecast 2025-2033:", The South Africa bottled water market size reached USD 1.90 Billion in 2024. Looking forward, the market is projected to reach USD 3.37 Billion by 2033, exhibiting a…
More Releases for Price
Glycerine Price Trend Report by Price Watch AI
Here is a professional PR-style content draft optimized for the keyword **"Glycerine Price Trend"** and positioned for your brand **Price Watch AI**.
Glycerine Price Trend Gains Strategic Importance for Manufacturers Amid Shifting Global Supply Dynamics
The global glycerine market is witnessing notable fluctuations, making the Glycerine Price Trend a critical focus area for manufacturers, procurement teams, and supply chain professionals. With rising demand across pharmaceuticals, personal care, food processing, and industrial applications,…
Bitcoin Price, XRP Price, and Dogecoin Price Analysis: Turn Volatility into Prof …
London, UK, 4th October 2025, ZEX PR WIRE, The price movements in the cryptocurrency market can be crazy. Bitcoin price (BTC price), XRP price, and Dogecoin price vary from day to day, which can make it complicated for traders. Some investors win, but many more lose, amid unpredictable volatility. But there's a more intelligent way and that is Hashf . Instead of contemplating charts, Hashf provides an opportunity for investors…
HOTEL PRICE KILLER - BEAT YOUR BEST PRICE!
Noble Travels Launches 'Hotel Price Killer' to Beat OTA Hotel Prices
New Delhi, India & Atlanta, USA - August 11, 2025 - Noble Travels, a trusted name in the travel industry for over 30 years, has launched a bold new service called Hotel Price Killer, promising to beat the best hotel prices offered by major online travel agencies (OTAs) and websites.
With offices in India and USA, Noble Travels proudly serves an…
Glutaraldehyde Price Trend, Price Chart 2025 and Forecast
North America Glutaraldehyde Prices Movement Q1:
Glutaraldehyde Prices in USA:
Glutaraldehyde prices in the USA dropped to 1826 USD/MT in March 2025, driven by oversupply and weak demand across manufacturing and healthcare. The price trend remained negative as inventories rose and procurement slowed sharply in February. The price index captured this decline, while the price chart reflected persistent downward pressure throughout the quarter.
Get the Real-Time Prices Analysis: https://www.imarcgroup.com/glutaraldehyde-pricing-report/requestsample
Note: The analysis can…
Butane Price Trend 2025, Update Price Index and Real Time Price Analysis
MEA Butane Prices Movement Q1 2025:
Butane Prices in Saudi Arabia:
In the first quarter of 2025, butane prices in Saudi Arabia reached 655 USD/MT in March. The pricing remained stable due to consistent domestic production and strong export activities. The country's refining capacity and access to natural gas feedstock supported price control, even as global energy markets saw fluctuations driven by seasonal demand and geopolitical developments impacting the Middle East.
Get the…
Dolomite Price Chart, Index, Price Trend and Forecast
North America Dolomite Prices Movement:
Dolomite Prices in United States:
In the last quarter, dolomite prices rose continuously in the United States, reaching 284 USD/MT in December. The increase was affected by constant demand from construction and steel sectors in association with high transport and energy costs. Additionally, logistic challenges and seasonal weather variations contributed to interruption in minor supply, leading to a strong pricing.
Get the Real-Time Prices Analysis: https://www.imarcgroup.com/dolomite-pricing-report/requestsample
Note: The analysis…
