Press release
Gas Processing Industry Outlook in Europe, North America, and Former Soviet Union (FSU) to 2025
As of September 2021, North America had 1,772 active gas processing plants with a total gas processing capacity of 223,561.9 million cubic feet per day (mmcfd). The regions share in the global gas processing capacity is 36.6 percent. Europe had 95 active gas processing plants with a total gas processing capacity of 53,851.4 mmcfd. The regions share in the global gas processing capacity is 8.8 percent. Former Soviet Union had 116 active gas processing plants with a total gas processing capacity of 83,125.3 mmcfd. The regions share in the global gas processing capacity is 13.6 percent.Get FREE PDF Sample of the Report @ https://www.reportsnreports.com/contacts/requestsample.aspx?name=4923941
Scope of this Report-
- Updated information on active, planned and announced gas processing plants in North America, Europe and Former Soviet Union
- Provides key details such as plant name, operator name, type, start year, process/conditioning methods and gas processing capacity for all active, planned and announced gas processing plants in North America, Europe and Former Soviet Union
- Provides capital expenditure outlook by year and by key countries for planned and announced gas processing plants in North America, Europe and Former Soviet Union for the period 2021-2025
- Latest developments and contracts related to gas processing industry, wherever available
Reasons to Buy this Report-
- Obtain the most up to date information available on active, planned and announced gas processing plants in North America, Europe and Former Soviet Union
- Identify growth segments and opportunities in the gas processing industry
- Facilitate decision making on the basis of strong historic and outlook capacity data
- Assess your competitors key gas processing plants portfolio.
Get Discount on Purchase this Report @ https://www.reportsnreports.com/purchase.aspx?name=4923941
List of Tables in this Report-
Table 1: Gas Processing Industry, North America, Active Key Statistics, Sep 2021
Table 2: Gas Processing Industry, North America, Active Gas Processing Capacity by Country (mmcfd), Sep 2021
Table 3: Gas Processing Industry, North America, Planned Key Statistics, Sep 2021
Table 4: Gas Processing Industry, North America, Planned and Announced Gas Processing Plants (bcf), Sep 2021
Table 5: Gas Processing Industry, North America, Annual New Build Capital Expenditure Outlook for Planned and Announced Gas Processing Plants (US$ mil), 20212025
Table 6: Gas Processing Industry, North America, Annual New Build Capital Expenditure Outlook for Planned and Announced Gas Processing Plants by Country (US$ mil), 20212025
Table 7: Gas Processing Industry, United States, Share of Top 3 States by Gas Processing Capacity (mmcfd), Sep 2021
Table 8: Gas Processing Industry, United States, Active Gas Processing Plants Capacity in Texas (mmcfd), Sep 2021
Table 9: Gas Processing Industry, United States, Active Gas Processing Plants Capacity in Louisiana (mmcfd), Sep 2021
Table 10: Gas Processing Industry, United States, Active Gas Processing Plants Capacity in Oklahoma (mmcfd), Sep 2021
Table 11: Gas Processing Industry, United States, Active Gas Processing Plants Capacity in Wyoming (mmcfd), Sep 2021
Table 12: Gas Processing Industry, United States, Active Gas Processing Plants Capacity in Colorado (mmcfd), Sep 2021
Table 13: Gas Processing Industry, United States, Active Gas Processing Plants Capacity in Alaska (mmcfd), Sep 2021
Table 14: Gas Processing Industry, United States, Active Gas Processing Plants Capacity in New Mexico (mmcfd), Sep 2021
Table 15: Gas Processing Industry, United States, Active Gas Processing Plants Capacity in West Virginia (mmcfd), Sep 2021
Table 16: Gas Processing Industry, United States, Active Gas Processing Plants Capacity in Kansas (mmcfd), Sep 2021
Table 17: Gas Processing Industry, United States, Active Gas Processing Plants Capacity in North Dakota (mmcfd), Sep 2021
Table 18: Gas Processing Industry, United States, Active Gas Processing Plants Capacity in Ohio (mmcfd), Sep 2021
Table 19: Gas Processing Industry, United States, Active Gas Processing Plants Capacity in Utah (mmcfd), Sep 2021
Table 20: Gas Processing Industry, United States, Active Gas Processing Plants Capacity in Illinois (mmcfd), Sep 2021
Table 21: Gas Processing Industry, United States, Active Gas Processing Plants Capacity in Alabama (mmcfd), Sep 2021
Table 22: Gas Processing Industry, United States, Active Gas Processing Plants Capacity in Pennsylvania (mmcfd), Sep 2021
Table 23: Gas Processing Industry, United States, Active Gas Processing Plants Capacity in Mississippi (mmcfd), Sep 2021
Table 24: Gas Processing Industry, United States, Active Gas Processing Plants Capacity in Kentucky (mmcfd), Sep 2021
Table 25: Gas Processing Industry, United States, Active Gas Processing Plants Capacity in California (mmcfd), Sep 2021
Table 26: Gas Processing Industry, United States, Active Gas Processing Plants Capacity in Florida (mmcfd), Sep 2021
Table 27: Gas Processing Industry, United States, Active Gas Processing Plants Capacity in Michigan (mmcfd), Sep 2021
Table 28: Gas Processing Industry, United States, Active Gas Processing Plants Capacity in New Jersey (mmcfd), Sep 2021
Table 29: Gas Processing Industry, United States, Active Gas Processing Plants Capacity in Arkansas (mmcfd), Sep 2021
Table 30: Gas Processing Industry, United States, Active Gas Processing Plants Capacity in Montana (mmcfd), Sep 2021
Table 31: Gas Processing Industry, United States, Active Gas Processing Plants Capacity in Tennessee (mmcfd), Sep 2021
Table 32: Gas Processing Industry, United States, Active Gas Processing Plants Capacity in Idaho (mmcfd), Sep 2021
Table 33: Gas Processing Industry, Canada, Share of Top 3 States by Gas Processing Capacity (mmcfd), Sep 2021
Table 34: Gas Processing Industry, Canada, Active Gas Processing Capacity (mmcfd), Sep 2021
Table 35: Gas Processing Industry, Mexico, Active Gas Processing Capacity (mmcfd), Sep 2021
Table 36: Gas Processing Industry, Europe, Active Key Statistics, Sep 2021
Table 37: Gas Processing Industry, Europe, Active Gas Processing Capacity by Key Countries (mmcfd), Sep 2021
Table 38: Gas Processing Industry, Europe, Shares of Top 3 Areas by Active Gas Processing Capacity (mmcfd), Sep 2021
Table 39: Gas Processing Industry, Europe, Planned Key Statistics, Sep 2021
Table 40: Gas Processing Industry, Europe, Planned and Announced Gas Processing Plants (mmcfd), Sep 2021
Table 41: Gas Processing Industry, Europe, Annual New Build Capital Expenditure Outlook for Planned Gas Processing Plants (US$ mil), 20212025
Table 42: Gas Processing Industry, Europe, Annual New Build Capital Expenditure Outlook for Planned Gas Processing Plants by Country (US$ mil), 20212025
Table 43: Gas Processing Industry, Europe, Active Gas Processing Capacity in Netherlands (mmcfd), Sep 2021
Table 44: Gas Processing Industry, Europe, Active Gas Processing Capacity in United Kingdom (mmcfd), Sep 2021
Table 45: Gas Processing Industry, Europe, Active Gas Processing Capacity in Norway (mmcfd), Sep 2021
Table 46: Gas Processing Industry, Europe, Active Gas Processing Capacity in Denmark (mmcfd), Sep 2021
Table 47: Gas Processing Industry, Europe, Active Gas Processing Capacity in France (mmcfd), Sep 2021
Table 48: Gas Processing Industry, Europe, Active Gas Processing Capacity in Hungary (mmcfd), Sep 2021
Table 49: Gas Processing Industry, Europe, Active Gas Processing Capacity in Romania (mmcfd), Sep 2021
Table 50: Gas Processing Industry, Europe, Active Gas Processing Capacity in Germany (mmcfd), Sep 2021
Table 51: Gas Processing Industry, Europe, Active Gas Processing Capacity in Ireland (mmcfd), Sep 2021
Table 52: Gas Processing Industry, Europe, Active Gas Processing Capacity in Poland (mmcfd), Sep 2021
Table 53: Gas Processing Industry, Europe, Active Gas Processing Capacity in Czech Republic (mmcfd), Sep 2021
Table 54: Gas Processing Industry, Europe, Active Gas Processing Capacity in Croatia (mmcfd), Sep 2021
Table 55: Gas Processing Industry, Europe, Active Gas Processing Capacity in Austria (mmcfd), Sep 2021
Table 56: Gas Processing Industry, Europe, Active Gas Processing Capacity in Greece (mmcfd), Sep 2021
Table 57: Gas Processing Industry, Europe, Active Gas Processing Capacity in Italy (mmcfd), Sep 2021
Table 58: Gas Processing Industry, Former Soviet Union, Active Key Statistics, Sep 2021
Table 59: Gas Processing Industry, Former Soviet Union, Active Gas Processing Capacity by Key Countries (mmcfd), Sep 2021
Table 60: Gas Processing Industry, Former Soviet Union, Shares of Top 3 Areas by Active Gas Processing Capacity (mmcfd), Sep 2021
Table 61: Gas Processing Industry, Former Soviet Union, Planned Key Statistics, Sep 2021
Table 62: Gas Processing Industry, Former Soviet Union, Planned and Announced Gas Processing Plants (mmcfd), Sep 2021
+ 1 888 391 5441
sales@reportsandreports.com
ReportsnReports.com is your single source for all market research needs. Our database includes 500,000+ market research reports from over 95 leading global publishers & in-depth market research studies of over 5000 micro markets.
This release was published on openPR.
Permanent link to this press release:
Copy
Please set a link in the press area of your homepage to this press release on openPR. openPR disclaims liability for any content contained in this release.
You can edit or delete your press release Gas Processing Industry Outlook in Europe, North America, and Former Soviet Union (FSU) to 2025 here
News-ID: 2439160 • Views: …
More Releases from ReportsnReports

DeviceCon Series 2024 - UK Edition | MarketsandMarkets
Future Forward: Redefining Healthcare with Cutting-Edge Devices
Welcome to DeviceCon Series 2024 - Where Innovation Meets Impact!
Join us on March 21-22 at Millennium Gloucester Hotel, 4-18 Harrington Gardens, London SW7 4LH for a groundbreaking convergence of knowledge, ideas, and technology. MarketsandMarkets proudly presents the DeviceCon Series, an extraordinary blend of four conferences that promise to redefine the landscape of innovation in medical and diagnostic devices.
Register Now @ https://events.marketsandmarkets.com/devicecon-series-uk-edition-2024/register
MarketsandMarkets presents…

5th Annual MarketsandMarkets Infectious Disease and Molecular Diagnostics Confer …
London, March 7, 2024 - MarketsandMarkets is thrilled to announce the eagerly awaited 5th Annual Infectious Disease and Molecular Diagnostics Conference, scheduled to take place on March 21st - 22nd, 2024, at the prestigious Millennium Gloucester Hotel, located at 4-18 Harrington Gardens, London SW7 4LH.
This conference promises to be a groundbreaking event, showcasing the latest trends and insights in diagnosis, as well as unveiling cutting-edge technologies that are revolutionizing the…

Infection Control, Sterilization & Decontamination Conference |21st - 22nd March …
MarketsandMarkets is pleased to announce its 8th Annual Infection Control, Sterilisation, and Decontamination in Healthcare Conference, which will take place March 21-22, 2024, in London, UK. With the increased risk of infection due to improper sterilisation and decontamination practices, the safety of patients and healthcare workers is of paramount importance nowadays.
Enquire Now @ https://events.marketsandmarkets.com/infection-control-sterilization-and-decontamination-conference/
This conference aims to bring together all the stakeholders to discuss the obstacles in achieving…
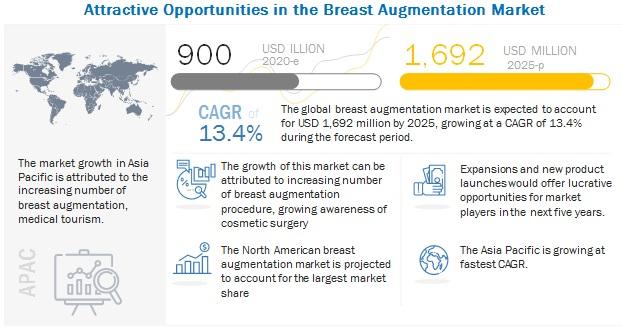
Breast Augmentation Market Key Players, Demands, Cost, Size, Procedure, Shape, S …
The global Breast Augmentation Market in terms of revenue was estimated to be worth $900 million in 2020 and is poised to reach $1,692 million by 2025, growing at a CAGR of 13.4% from 2020 to 2025. The new research study consists of an industry trend analysis of the market. The new research study consists of industry trends, pricing analysis, patent analysis, conference and webinar materials, key stakeholders, and buying…
More Releases for Gas
City Gas Distribution Market 2022 key developmental strategies implemented by th …
The City Gas Distribution report is an in-depth examination of the global City Gas Distribution's general consumption structure, development trends, sales techniques, and top nations' sales. The research looks at well-known providers in the global City Gas Distribution industry, as well as market segmentation, competition, and the macroeconomic climate. A complete City Gas Distribution analysis takes into account a number of aspects, including a country's population and business cycles, as…
Know about City Gas Distribution Market Growth with Top Companies details like: …
The City Gas Distribution Market 2020-2024 Report involve of strong research on global City Gas Distribution industry which enables the customer to look at the possible requirement as well as prediction. The constraints and drivers are assembled after a significant study of the global City Gas Distribution market's proficiency. The development ratio which is expected in perspective of the rational analysis provides thorough information of the worldwide City Gas Distribution…
City Gas Distribution Market 2019: Top Companies- Gujarat Gas, Indraprastha Gas, …
A network that deliver the gas in the city. Growth in the market is anticipated on account of increasing natural gas demand from domestic, commercial, industrial as well as automotive end user segments.
Get Sample Copy of This Report at https://www.orianresearch.com/request-sample/1011059
City Gas Distribution Industry 2019 Global Market research report provides a detailed analysis of market growth factors, industry share, regional trends, size and Forecast till 2025. This report…
City Gas Distribution Market Exploring Future Growth 2019-2023 and Key Players - …
Global City Gas Distribution Market Research Report consists of all the significant data related to the global market. The report presents a comprehensive analysis of the various industry growth factors, including the market trends, dynamics, estimates, production and consumption ratio, industry development factors, size, share, supply and demand, forecast trends, sales, as well as several other factors. The report has been generated leveraging a blend of the primary and secondary…
Global City Gas Distribution Market 2018: Key Players – Gujarat Gas, Indrapras …
Summary
WiseGuyReports.com adds “City Gas Distribution Market 2018 Global Analysis, Growth, Trends and Opportunities Research Report Forecasting to 2023” reports to its database.
This report provides in depth study of “City Gas Distribution Market” using SWOT analysis i.e. Strength, Weakness, Opportunities and Threat to the organization. The City Gas Distribution Market report also provides an in-depth survey of key players in the market which is based on the various objectives of an…
City Gas Distribution Market Latest Technology Trends 2018 | Growth by Top Compa …
A network that deliver the gas in the city.
Growth in the market is anticipated on account of increasing natural gas demand from domestic, commercial, industrial as well as automotive end user segments.
The report Global City Gas Distribution Market 2018 focuses on fundamental know-how of City Gas Distribution segment. The report provides comprehensive study and vivid description of drivers, limitations, openings, request factors, market size, conjectures, and patterns in the Worldwide…
