Press release
Supply Chain Security Market Growth Rate, Key Players Analysis, Size, Applications, Demands, Trends, Regional Data and Forecasts to 2026
The global supply chain security market size is projected to grow from USD 903 million in 2021 to USD 1,227 million by 2026, at a Compound Annual Growth Rate (CAGR) of 6.3% during the forecast period. Major driving factors for the supply chain security market include rise in ransom and supply chain attacks, increasing IoT devices in the supply chain, need for enhanced risk prediction and mitigation, and widespread adoption of automation technology across the supply chain.Get a Free Sample Copy of Global Supply Chain Security Market Research Report at https://www.reportsnreports.com/contacts/requestsample.aspx?name=4694589
By component, the services segment to register the highest growth rate during the forecast period
The services segment includes various services that are required to deploy, execute, and maintain the supply chain security software and hardware in an organization. As the adoption of the supply chain security solution increases, the demand for these services is also expected to increase. Supply chain security can be provided through professional security analysts who provide remote assistance and incident response to clients in case of suspicious activities. Professional services include training and education, and support and maintenance. As the adoption of the supply chain security increases, the demand for these services is also expected to soar. Supply chain security services ensure 24/7 protection against increasing sophisticated architectures, SOCs manned by security experts, and quick incident response services. Supply chain security vendors offer customized subscriptions and professional services to assist end users in easy planning and deployment of supply chain security solutions.
By organization size, the SME segment to register the highest growth rate during the forecast period
SMEs are the fastest-growing segment in the supply chain security market as cloud-based supply chain solutions and services help in improving business performance, enhancing security, and enhance productivity at an affordable cost. Hence, majority of the SMEs deploy cloud-based supply chain security solutions. SMEs tend to suffer from resource constraints, including financial resources and technical expertise, when it comes to the adoption of the supply chain security solutions and services. They are majorly adopting supply chain security solutions to gain real time visibility of all supply chain assets through their lifecycle. Governments are taking ample initiatives to promote the adoption of supply chain security solutions among SMEs. The COVID-19 pandemic is widely exploited by malicious cyber groups using COVID-19 themes, putting SMEs at the risk of cyber-attacks. Even though SMEs have limited budgets, there are many vendors who have curated supply chain security solutions according to the needs of an SME.
Get 25% and More Discount on this Research Report at https://www.reportsnreports.com/contacts/discount.aspx?name=4694589
Asia Pacific to register the highest growth rate during the forecast period
Asia Pacific (APAC) has witnessed an advanced and dynamic adoption of new technologies and is expected to record the highest CAGR in the global supply chain security market during the forecast period. The supply chain security market in APAC is projected to grow at the highest CAGR during the forecast period. APAC countries are increasingly investing in supply chain security projects. The region comprises emerging economies, such as China, Japan, India, and rest of APAC countries. With the proliferation of IoT in the APAC region, security and fraud concerns have risen. Enterprises in the APAC region are embracing supply chain security technologies. Companies operating in APAC would benefit from the flexible economic conditions, industrialization-motivated policies, political transformation, and the growing digitalization, which is expected to have a significant impact on the business community and drive the supply chain security market growth.
• By Company Type: Tier 1 – 24%, Tier 2 – 20%, and Tier 3 – 56%
• By Designation: C-level – 38%, D-level – 28%, and Others – 34%
• By Region: North America – 65%, Europe – 20%, Asia Pacific – 12%, RoW – 3%
Key and innovative vendors in the supply chain security market include Sensitech (US), ORBCOMM (US), ELPRO (Switzerland), Rotronic (Switzerland), Emerson (US), NXP Semiconductors (Netherlands), Testo (Germany), Qingdao Haier Biomedical (China), Monnit Corporation (US), Berlinger & Co. AG (Switzerland), Signatrol (US), IBM (US), Cold Chain Technologies (US), LogTag Recorders (New Zealand), Omega Compliance (China), Dickson (US), Hangzhou Zeda Instruments (China), Oceasoft (France), Hanwell Solutions (UK), Controlant (Iceland), Tagbox Solutions (India), FreshSurety (US), Astrona Biotechnologies (US), Safetraces (US), MOST (Sweden), and Tive (US).
Research Coverage
The market study covers the supply chain security market size across segments. It aims at estimating the market size and the growth potential of this market across different segments by component, by security type, by deployment mode, by organization size, by vertical, and by region. The study also includes an in-depth competitive analysis of the key market players, along with their company profiles, key observations related to product and business offerings, recent developments, and key market strategies.
Key Benefits of Buying the Report
The report will help the market leaders/new entrants with information on the revenue numbers' closest approximations for the overall supply chain security market and its sub-segments. This report will help stakeholders understand the competitive landscape and gain more insights to better position their businesses and plan suitable go-to-market strategies. The report will also help stakeholders understand the market's pulse and provide them with information on key market drivers, restraints, challenges, and opportunities.
Avail 25% Discount on Direct Purchase of this Research Report at https://www.reportsnreports.com/purchase.aspx?name=4694589 ( Use Coupon Code )
Table Of Contents
1 Introduction
1.1 Introduction To Covid-19
1.2 Covid-19 Health Assessment
Figure 1 Covid-19: Global Propagation
Figure 2 Covid-19 Propagation: Select Countries
1.3 Covid-19 Economic Assessment
Figure 3 Revised Gross Domestic Product Forecasts For Select G20 Countries In 2020
1.3.1 Covid-19 Economic Impact—Scenario Assessment
Figure 4 Criteria Impacting Global Economy
Figure 5 Scenarios In Terms Of Recovery Of Global Economy
1.4 Study Objectives
1.4.1 Market Definition
1.4.2 Inclusions And Exclusions
1.5 Market Scope
1.5.1 Market Segmentation
1.5.2 Years Considered For The Study
1.6 Currency Considered
Table 1 United States Dollar Exchange Rate, 2014–2019
1.7 Stakeholders
2 Research Methodology
2.1 Research Data
Figure 6 Supply Chain Security Market: Research Design
2.1.1 Secondary Data
2.1.1.1 Key Data From Secondary Sources
2.1.2 Primary Data
2.1.2.1 Breakup Of Primary Profiles
Figure 7 Breakup Of Primary Profiles
2.1.2.2 Key Industry Insights
2.2 Market Breakup And Data Triangulation
Figure 8 Supply Chain Security Market: Market Breakup And Data Triangulation
2.3 Market Size Estimation
Figure 9 Market Size Estimation Methodology—Approach 1 (Supply Side): Revenue From Hardware/Software/Services Of Vendors
Figure 10 Market Size Estimation Methodology: Illustrative Example Of Orbcomm
Figure 11 Market Size Estimation Methodology—Approach 2, Bottom-Up (Supply Side): Collective Revenue From Hardware, Software, And Services
Figure 12 Market Size Estimation Methodology—Approach 3, Top-Down (Demand Side)
2.4 Market Forecast
Table 2 Factor Analysis
2.5 Company Evaluation Matrix Methodology
Figure 13 Company Evaluation Matrix: Criteria Weightage
2.6 Startup/Sme Company Evaluation Matrix Methodology
Figure 14 Startup/Sme Company Evaluation Matrix: Criteria Weightage
2.7 Assumptions For The Study
2.8 Limitations Of The Study
3 Executive Summary
Figure 15 Global Supply Chain Security Market To Witness A High Growth During The Forecast Period
Figure 16 Leading Segments In The Market In 2021
Figure 17 Market: Regional Snapshot
4 Premium Insights
4.1 Attractive Opportunities In The Supply Chain Security Market
Figure 18 Increasing Technological Developments To Boost The Adoption Of Supply Chain Security Solutions
4.2 Market, By Organization Size And Component
Figure 19 Large Enterprises And Hardware Segments To Hold Large Market Shares In 2020
4.3 Market, By Region
Figure 20 Asia Pacific To Grow At The Highest Cagr During The Forecast Period
4.4 Market: Investment Scenario
Figure 21 Asia Pacific To Emerge As The Best Market For Investments Over The Next Five Years
5 Market Overview And Industry Trends
5.1 Introduction
5.2 Market Dynamics
Figure 22 Drivers, Restraints, Opportunities, And Challenges: Supply Chain Security Market
5.2.1 Drivers
5.2.1.1 Pandemic Led To Increasing Ransomware And Supply Chain Attacks
Figure 23 Average Ransom Payouts, Quarterly
5.2.1.2 Increasing Need For Healthcare Supply Chain Security
5.2.1.3 Increasing Iot Devices In The Supply Chain
5.2.2 Restraints
5.2.2.1 Increasing Variants Of Cyberattacks Globally
5.2.2.2 Budgetary Constraints Among Small And Emerging Startups In Developing Economies
5.2.3 Opportunities
5.2.3.1 Improving Risk Prediction And Management
5.2.3.2 Widespread Adoption Of Automation Technology And Others Across The Value Chain
5.2.4 Challenges
5.2.4.1 Shortage Of Supply And Demand Shocks During Covid-19
5.3 Covid-19-Driven Market Dynamics
5.3.1 Drivers And Opportunities
5.3.2 Restraints And Challenges
5.3.3 Cumulative Growth Analysis
5.4 Value Chain
Figure 24 Value Chain: Supply Chain Security Market
5.5 Ecosystem: Supply Chain Security
Figure 25 Ecosystem: Market
5.6 Pricing Analysis
5.7 Technology Analysis
5.7.1 Internet Of Things
5.7.2 Big Data
5.7.3 Blockchain
5.7.4 Artificial Intelligence
5.8 Use Cases
5.8.1 Cornerstone Logistics Procured Sensitech’s Cargo Monitoring Solution
5.8.2 Endocyte Uses Elpro’s Central Monitoring System To Protect Its Critical Assets
5.8.3 Accelerating Global Growth With Efficient And Cost-Effective Ibm Sterling Supply Chain Business Network
5.8.4 The Museum Of Transport And Technology (Motat) Procured Hanwell Solution’s Comprehensive Environmental Monitoring Solution
5.8.5 Oceasoft’s Data Logger Addressed A European Hospital’s Need For Temperature Monitoring And Compliance
5.9 Patent Analysis
5.10 Revenue Shift – Yc/Ycc Shift For The Supply Chain Security Market
Figure 26 Yc/Ycc Shift: Market
5.11 Porter’s Five Forces Analysis
Figure 27 Porter’s Five Forces Analysis: Market
5.11.1 Threat From New Entrants
5.11.2 Threat Of Substitutes
5.11.3 Bargaining Power Of Suppliers
5.11.4 Bargaining Power Of Buyers
5.11.5 Intensity Of Competition Rivalry
For More Details Inquire at https://www.reportsnreports.com/contacts/inquirybeforebuy.aspx?name=4694589
6 Supply Chain Security Market, By Component
6.1 Introduction
6.1.1 Components: Market Drivers
6.1.2 Components: Covid-19 Impact
Figure 28 Services Segment To Grow At The Highest Cagr During The Forecast Period
Table 3 Market Size, By Component, 2019–2026 (Usd Million)
6.2 Hardware
Table 4 Hardware: Market, By Shipment, 2019–2026 (Thousand Unit)
Table 5 Hardware: Market Size, By Region, 2019–2026 (Usd Million)
6.3 Software
Table 6 Software: Market Size, By Region, 2019–2026 (Usd Million)
6.4 Services
Table 7 Services: Market Size, By Region, 2019–2026 (Usd Million)
Table 8 Market Size, By Service, 2019–2026 (Usd Million)
6.4.1 Training And Consulting
Table 9 Training And Consulting: Supply Chain Security Market Size, By Region, 2019–2026 (Usd Million)
6.4.2 Integration And Deployment
Table 10 Integration And Deployment: Market Size, By Region, 2019–2026 (Usd Million)
6.4.3 Support And Maintenance
Table 11 Support And Maintenance: Market Size, By Region, 2019–2026 (Usd Million)
7 Supply Chain Security Market, By Application
7.1 Introduction
7.1.1 Applications: Market Drivers
7.1.2 Applications: Covid-19 Impact
Figure 29 Data Visibility And Governance Segment To Grow At The Highest Cagr During The Forecast Period
Table 12 Market Size, By Application, 2019–2026 (Usd Million)
7.2 Data Protection
Table 13 Data Protection: Market Size, By Region, 2019–2026 (Usd Million)
7.3 Data Visibility And Governance
Table 14 Data Visibility And Governance: Market Size, By Region, 2019–2026 (Usd Million)
7.4 Other Applications
Table 15 Other Applications: Market Size, By Region, 2019–2026 (Usd Million)
8 Supply Chain Security Market, By Organization Size
8.1 Introduction
8.1.1 Organization Size: Market Drivers
8.1.2 Organization Size: Covid-19 Impact
Figure 30 Small And Medium-Sized Enterprises Segment To Grow At A Higher Cagr During The Forecast Period
Table 16 Market Size, By Organization Size, 2019–2026 (Usd Million)
8.2 Small And Medium-Sized Enterprises
Table 17 Small And Medium-Sized Enterprises: Market Size, By Region, 2019–2026 (Usd Million)
8.3 Large Enterprises
Table 18 Large Enterprises: Market Size, By Region, 2019–2026 (Usd Million)
9 Supply Chain Security Market, By Vertical
9.1 Introduction
9.1.1 Verticals: Market Drivers
9.1.2 Verticals: Covid-19 Impact
Figure 31 Retail And Ecommerce Vertical To Grow At The Highest Cagr During The Forecast Period
Table 19 Market Size, By Vertical, 2019–2026 (Usd Million)
9.2 Fast-Moving Consumer Goods
Table 20 Fast-Moving Consumer Goods: Market Size, By Region, 2019–2026 (Usd Million)
Table 21 North America: Fast-Moving Consumer Goods Market Size, By Country, 2019–2026 (Usd Million)
Table 22 Europe: Fast-Moving Consumer Goods Market Size, By Country, 2019–2026 (Usd Million)
9.3 Retail And Ecommerce
Table 23 Retail And Ecommerce: Market Size, By Region, 2019–2026 (Usd Million)
Table 24 North America: Retail And Ecommerce Market Size, By Country, 2019–2026 (Usd Million)
Table 25 Europe: Retail And Ecommerce Market Size, By Country, 2019–2026 (Usd Million)
9.4 Healthcare
Table 26 Healthcare: Supply Chain Security Market Size, By Region, 2019–2026 (Usd Million)
Table 27 North America: Healthcare Market Size, By Country, 2019–2026 (Usd Million)
Table 28 Europe: Healthcare Market Size, By Country, 2019–2026 (Usd Million)
9.5 Manufacturing
Table 29 Manufacturing: Market Size, By Region, 2019–2026 (Usd Million)
Table 30 North America: Manufacturing Market Size, By Country, 2019–2026 (Usd Million)
Table 31 Europe: Manufacturing Market Size, By Country, 2019–2026 (Usd Million)
9.6 Automotive
Table 32 Automotive: Market Size, By Region, 2019–2026 (Usd Million)
Table 33 North America: Automotive Market Size, By Country, 2019–2026 (Usd Million)
Table 34 Europe: Automotive Market Size, By Country, 2019–2026 (Usd Million)
9.7 Transport And Logistics
Table 35 Transport And Logistics: Supply Chain Security Market Size, By Region, 2019–2026 (Usd Million)
Table 36 North America: Transport And Logistics Market Size, By Country, 2019–2026 (Usd Million)
Table 37 Europe: Transport And Logistics Market Size, By Country, 2019–2026 (Usd Million)
9.8 Other Verticals
Table 38 Other Verticals: Market Size, By Region, 2019–2026 (Usd Million)
Table 39 Other Verticals: Retail And Ecommerce Market Size, By Country, 2019–2026 (Usd Million)
Table 40 Other Verticals: Retail And Ecommerce Market Size, By Country, 2019–2026 (Usd Million)
10 Supply Chain Security Market, By Region
10.1 Introduction
Table 41 Market Size, By Region, 2019–2026 (Usd Million)
Figure 32 Asia Pacific To Account For The Highest Cagr During The Forecast Period
10.2 North America
10.2.1 North America: Market Drivers
10.2.2 North America: Covid-19 Impact
10.2.3 North America: Regulatory Landscape
Figure 33 North America: Market Snapshot
Table 42 North America: Supply Chain Security Market Size, By Component, 2019–2026 (Usd Million)
Table 43 North America: Market Size, By Service, 2019–2026 (Usd Million)
Table 44 North America: Market Size, By Application, 2019–2026 (Usd Million)
Table 45 North America: Market Size, By Organization Size, 2019–2026 (Usd Million)
Table 46 North America: Market Size, By Vertical, 2019–2026 (Usd Million)
Table 47 North America: Market Size, By Country, 2019–2026 (Usd Million)
10.2.4 United States
Table 48 United States: Supply Chain Security Market Size, By Component, 2019–2026 (Usd Million)
Table 49 United States: Market Size, By Service, 2019–2026 (Usd Million)
Table 50 United States: Market Size, By Application, 2019–2026 (Usd Million)
Table 51 United States: Market Size, By Organization Size, 2019–2026 (Usd Million)
Table 52 United States: Market Size, By Vertical, 2019–2026 (Usd Million)
10.2.5 Canada
Table 53 Canada: Supply Chain Security Market Size, By Component, 2019–2026 (Usd Million)
Table 54 Canada: Market Size, By Service, 2019–2026 (Usd Million)
Table 55 Canada: Market Size, By Application, 2019–2026 (Usd Million)
Table 56 Canada: Market Size, By Organization Size, 2019–2026 (Usd Million)
Table 57 Canada: Market Size, By Vertical, 2019–2026 (Usd Million)
Table 58 Canada: Market Size, By Country, 2019–2026 (Usd Million)
10.3 Europe
10.3.1 Europe: Supply Chain Security Market Drivers
10.3.2 Europe: Covid-19 Impact
10.3.3 Europe: Regulatory Landscape
Table 59 Europe: Market Size, By Component, 2019–2026 (Usd Million)
Table 60 Europe: Market Size, By Service, 2019–2026 (Usd Million)
Table 61 Europe: Market Size, By Application, 2019–2026 (Usd Million)
Table 62 Europe: Market Size, By Organization Size, 2019–2026 (Usd Million)
Table 63 Europe: Market Size, By Vertical, 2019–2026 (Usd Million)
Table 64 Europe: Market Size, By Country, 2019–2026 (Usd Million)
10.3.4 United Kingdom
Table 65 United Kingdom: Supply Chain Security Market Size, By Component, 2019–2026 (Usd Million)
Table 66 United Kingdom: Market Size, By Service, 2019–2026 (Usd Million)
Table 67 United Kingdom: Market Size, By Application, 2019–2026 (Usd Million)
Table 68 United Kingdom: Market Size, By Organization Size, 2019–2026 (Usd Million)
Table 69 United Kingdom: Market Size, By Vertical, 2019–2026 (Usd Million)
10.3.5 Germany
Table 70 Germany: Supply Chain Security Market Size, By Component, 2019–2026 (Usd Million)
Table 71 Germany: Market Size, By Service, 2019–2026 (Usd Million)
Table 72 Germany: Market Size, By Application, 2019–2026 (Usd Million)
Table 73 Germany: Market Size, By Organization Size, 2019–2026 (Usd Million)
Table 74 Germany: Market Size, By Vertical, 2019–2026 (Usd Million)
10.3.6 France
Table 75 France: Supply Chain Security Market Size, By Component, 2019–2026 (Usd Million)
Table 76 France: Market Size, By Service, 2019–2026 (Usd Million)
Table 77 France: Market Size, By Application, 2019–2026 (Usd Million)
Table 78 France: Market Size, By Organization Size, 2019–2026 (Usd Million)
Table 79 France: Market Size, By Vertical, 2019–2026 (Usd Million)
10.3.7 Rest Of Europe
Table 80 Rest Of Europe: Supply Chain Security Market Size, By Component, 2019–2026 (Usd Million)
Table 81 Rest Of Europe: Market Size, By Service, 2019–2026 (Usd Million)
Table 82 Rest Of Europe: Market Size, By Application, 2019–2026 (Usd Million)
Table 83 Rest Of Europe: Market Size, By Organization Size, 2019–2026 (Usd Million)
Table 84 Rest Of Europe: Market Size, By Vertical, 2019–2026 (Usd Million)
10.4 Asia Pacific
10.4.1 Asia Pacific: Supply Chain Security Market Drivers
10.4.2 Asia Pacific: Covid-19 Impact
10.4.3 Asia Pacific: Regulatory Landscape
Figure 34 Asia Pacific: Market Snapshot
Table 85 Asia Pacific: Market Size, By Component, 2019–2026 (Usd Million)
Table 86 Asia Pacific: Market Size, By Service, 2019–2026 (Usd Million)
Table 87 Asia Pacific: Market Size, By Application, 2019–2026 (Usd Million)
Table 88 Asia Pacific: Market Size, By Organization Size, 2019–2026 (Usd Million)
Table 89 Asia Pacific: Market Size, By Vertical, 2019–2026 (Usd Million)
Table 90 Asia Pacific: Market Size, By Country, 2019–2026 (Usd Million)
10.4.4 China
Table 91 China: Supply Chain Security Market Size, By Component, 2019–2026 (Usd Million)
Table 92 China: Market Size, By Service, 2019–2026 (Usd Million)
Table 93 China: Market Size, By Application, 2019–2026 (Usd Million)
Table 94 China: Market Size, By Organization Size, 2019–2026 (Usd Million)
Table 95 China: Market Size, By Vertical, 2019–2026 (Usd Million)
10.4.5 Japan
Table 96 Japan: Supply Chain Security Market Size, By Component, 2019–2026 (Usd Million)
Table 97 Japan: Market Size, By Service, 2019–2026 (Usd Million)
Table 98 Japan: Market Size, By Application, 2019–2026 (Usd Million)
Table 99 Japan: Market Size, By Organization Size, 2019–2026 (Usd Million)
Table 100 Japan: Market Size, By Vertical, 2019–2026 (Usd Million)
10.4.6 India
Table 101 India: Supply Chain Security Market Size, By Component, 2019–2026 (Usd Million)
Table 102 India: Market Size, By Service, 2019–2026 (Usd Million)
Table 103 India: Market Size, By Application, 2019–2026 (Usd Million)
Table 104 India: Market Size, By Organization Size, 2019–2026 (Usd Million)
Table 105 India: Market Size, By Vertical, 2019–2026 (Usd Million)
10.4.7 Rest Of Asia Pacific
Table 106 Rest Of Asia Pacific: Supply Chain Security Market Size, By Component, 2019–2026 (Usd Million)
Table 107 Rest Of Asia Pacific: Market Size, By Service, 2019–2026 (Usd Million)
Table 108 Rest Of Asia Pacific: Market Size, By Application, 2019–2026 (Usd Million)
Table 109 Rest Of Asia Pacific: Market Size, By Organization Size, 2019–2026 (Usd Million)
Table 110 Rest Of Asia Pacific: Market Size, By Vertical, 2019–2026 (Usd Million)
10.5 Middle East And Africa
10.5.1 Middle East And Africa: Supply Chain Security Market Drivers
10.5.2 Middle East And Africa: Covid-19 Impact
10.5.3 Middle East And Africa: Regulatory Landscape
Table 111 Middle East And Africa: Market Size, By Component, 2019–2026 (Usd Million)
Table 112 Middle East And Africa: Market Size, By Service, 2019–2026 (Usd Million)
Table 113 Middle East And Africa: Market Size, By Application, 2019–2026 (Usd Million)
Table 114 Middle East And Africa: Market Size, By Organization Size, 2019–2026 (Usd Million)
Table 115 Middle East And Africa: Market Size, By Vertical, 2019–2026 (Usd Million)
Table 116 Middle East And Africa: Market Size, By Country, 2019–2026 (Usd Million)
10.5.4 Kingdom Of Saudi Arabia
10.5.5 United Arab Emirates
10.5.6 Rest Of Middle East And Africa
10.6 Latin America
10.6.1 Latin America: Supply Chain Security Market Drivers
10.6.2 Latin America: Covid-19 Impact
10.6.3 Latin America: Regulatory Landscape
Table 117 Latin America: Market Size, By Component, 2019–2026 (Usd Million)
Table 118 Latin America: Market Size, By Service, 2019–2026 (Usd Million)
Table 119 Latin America: Market Size, By Application, 2019–2026 (Usd Million)
Table 120 Latin America: Market Size, By Organization Size, 2019–2026 (Usd Million)
Table 121 Latin America: Market Size, By Vertical, 2019–2026 (Usd Million)
Table 122 Latin America: Market Size, By Country, 2019–2026 (Usd Million)
10.6.4 Brazil
10.6.5 Mexico
10.6.6 Rest Of Latin America
11 Competitive Landscape
11.1 Overview
11.2 Key Player Strategies
Table 123 Supply Chain Security Market: Degree Of Competition
11.2.1 Overview Of Strategies Deployed By Key Supply Chain Security Vendors
11.3 Historical Revenue Analysis
Figure 35 Revenue Analysis Of Top Market Players
11.4 Market Evaluation Framework
Figure 36 Supply Chain Security: Market Evaluation Framework
11.5 Revenue Analysis Of Leading Players
Figure 37 Supply Chain Security Market: Revenue Analysis
11.6 Ranking Of Key Players
Figure 38 Ranking Of Key Supply Chain Security Companies
11.7 Company Evaluation Quadrant
11.7.1 Company Evaluation Quadrant Definitions And Methodology
Table 124 Evaluation Criteria
11.7.2 Star
11.7.3 Pervasive
11.7.4 Emerging Leaders
11.7.5 Participants
Figure 39 Supply Chain Security Market (Global), Company Evaluation Quadrant, 2021
11.8 Competitive Benchmarking
11.8.1 Company Product Footprint
Figure 40 Company Product Footprint Of Top Players In The Market
Table 125 Company Product Footprint
11.8.2 New Product Launches And Product Enhancements
Table 126 Market: New Product Launches And Product Enhancements
11.8.3 Deals
Table 127 Market: Deals
11.9 Startup/Sme Evaluation Quadrant, 2020
11.9.1 Progressive Companies
11.9.2 Responsive Companies
11.9.3 Dynamic Companies
11.9.4 Starting Blocks
Figure 41 Supply Chain Security Market (Global), Startup/Sme Evaluation Quadrant, 2020
12 Company Profiles
12.1 Introduction
(Business Overview, Solutions & Services, Key Insights, Recent Developments, Mnm View)*
12.1.1 Sensitech
Table 128 Sensitech: Business Overview
Table 129 Sensitech: Solutions Offered
Table 130 Sensitech: Services Offered
Table 131 Sensitech: Product Launches And Enhancements
Table 132 Sensitech: Deals
12.1.2 Orbcomm
Table 133 Orbcomm: Business Overview
Figure 42 Orbcomm: Company Snapshot
Table 134 Orbcomm: Solutions Offered
Table 135 Orbcomm: Product Launches And Enhancements
Table 136 Orbcomm: Deals
12.1.3 Elpro
Table 137 Elpro: Business Overview
Table 138 Elpro: Solutions Offered
Table 139 Elpro: Product Launches
Table 140 Elpro: Deals
12.1.4 Rotronic
Table 141 Rotronic: Business Overview
Table 142 Rotronic: Solutions Offered
Table 143 Rotronic: Product Launches
Table 144 Rotronic: Deals
12.1.5 Emerson
Table 145 Emerson: Business Overview
Figure 43 Emerson: Company Snapshot
Table 146 Emerson: Solutions Offered
Table 147 Emerson: Product Launches
Table 148 Emerson: Deals
12.1.6 Nxp Semiconductors
Table 149 Nxp Semiconductors: Business Overview
Figure 44 Nxp Semiconductors: Company Snapshot
Table 150 Nxp Semiconductors: Solutions Offered
Table 151 Nxp Semiconductors: Services Offered
Table 152 Nxp Semiconductors: Product Launches
Table 153 Nxp Semiconductors: Deals
12.1.7 Testo
Table 154 Testo: Business Overview
Table 155 Testo: Solutions Offered
Table 156 Testo: Services Offered
Table 157 Testo: Product Launches And Enhancements
Table 158 Testo: Deals
12.1.8 Qingdao Haier Biomedical
Table 159 Qingdao Haier Biomedical: Business Overview
Figure 45 Qingdao Haier Biomedical: Company Snapshot
Table 160 Qingdao Haier Biomedical: Solutions Offered
Table 161 Qingdao Haier Biomedical: Services Offered
Table 162 Qingdao Haier Biomedical: Deals
12.1.9 Monnit
Table 163 Monnit: Business Overview
Table 164 Monnit: Solutions Offered
Table 165 Monnit: Services Offered
Table 166 Monnit: Product Launches
Table 167 Monnit: Deals
12.1.10 Berlinger & Co. Ag
Table 168 Berlinger & Co. Ag: Business Overview
Table 169 Berlinger & Co. Ag: Solutions Offered
Table 170 Berlinger & Co. Ag: Deals
12.1.11 Signatrol
12.1.12 Ibm
12.1.13 Cold Chain Technologies
12.1.14 Logtag Recorders
12.1.15 Omega Compliance
12.1.16 Dickson
12.1.17 Hangzhou Zeda Instruments
12.1.18 Oceasoft
12.1.19 Hanwell Solutions
12.1.20 Controlant
*Details On Business Overview, Solutions & Services, Key Insights, Recent Developments, Mnm View Might Not Be Captured In Case Of Unlisted Companies.
12.2 Startup/ Sme Profiles
12.2.1 Tagbox Solutions
12.2.2 Freshsurety
12.2.3 Astrona Biotechnologies
12.2.4 Safetraces
12.2.5 Most
12.2.6 Tive
13 Adjacent/Related Markets
13.1 Introduction
13.2 Healthcare Supply Chain Security Market
13.2.1 Market Definition
Table 171 Healthcare Supply Chain Management Market, By End User, 2018–2025 (Usd Million)
Table 172 Manufacturers: Healthcare Supply Chain Management Market, By Region, 2018–2025 (Usd Million)
Table 173 Distributors: Healthcare Supply Chain Management Market, By Region, 2018–2025 (Usd Million)
Table 174 Providers: Healthcare Supply Chain Management Market, By Region, 2018–2025 (Usd Million)
13.3 Supply Chain Analytics Market
13.3.1 Market Definition
Table 175 Services: Supply Chain Analytics Market Size, By Region, 2014–2019 (Usd Million)
Table 176 Services: Supply Chain Analytics Market Size, By Region, 2019–2025 (Usd Million)
Table 177 Supply Chain Analytics Market Size, By Service, 2014–2019 (Usd Million)
Table 178 Supply Chain Analytics Market Size, By Service, 2019–2025 (Usd Million)
Table 179 Managed Services Market Size, By Region, 2014–2019 (Usd Million)
Table 180 Managed Services Market Size, By Region, 2019–2025 (Usd Million)
Table 181 Supply Chain Analytics Market Size, By Professional Service, 2014–2019 (Usd Million)
Table 182 Supply Chain Analytics Market Size, By Professional Service, 2019–2025 (Usd Million)
13.4 Supply Chain Management Market
13.4.1 Market Definition
Table 183 Supply Chain Management Market Size, By Organization Size, 2014–2019 (Usd Million)
Table 184 Supply Chain Management Market Size, By Organization Size, 2019–2026 (Usd Million)
Table 185 Small And Medium-Sized Enterprises: Supply Chain Management Market Size, By Region, 2014–2019 (Usd Million)
Table 186 Small And Medium-Sized Enterprises: Supply Chain Management Market Size, By Region, 2019–2026 (Usd Million)
Table 187 Large Enterprises: Supply Chain Management Market Size, By Region, 2014–2019 (Usd Million)
Table 188 Large Enterprises: Supply Chain Management Market Size, By Region, 2019–2026 (Usd Million)
ReportsnReports.com is your single source for all market research needs. Our database includes 500,000+ market research reports from over 95 leading global publishers & in-depth market research studies of over 5000 micro markets.
+ 1 888 391 5441
sales@reportsandreports.com
This release was published on openPR.
Permanent link to this press release:
Copy
Please set a link in the press area of your homepage to this press release on openPR. openPR disclaims liability for any content contained in this release.
You can edit or delete your press release Supply Chain Security Market Growth Rate, Key Players Analysis, Size, Applications, Demands, Trends, Regional Data and Forecasts to 2026 here
News-ID: 2337870 • Views: …
More Releases from ReportsnReports

DeviceCon Series 2024 - UK Edition | MarketsandMarkets
Future Forward: Redefining Healthcare with Cutting-Edge Devices
Welcome to DeviceCon Series 2024 - Where Innovation Meets Impact!
Join us on March 21-22 at Millennium Gloucester Hotel, 4-18 Harrington Gardens, London SW7 4LH for a groundbreaking convergence of knowledge, ideas, and technology. MarketsandMarkets proudly presents the DeviceCon Series, an extraordinary blend of four conferences that promise to redefine the landscape of innovation in medical and diagnostic devices.
Register Now @ https://events.marketsandmarkets.com/devicecon-series-uk-edition-2024/register
MarketsandMarkets presents…

5th Annual MarketsandMarkets Infectious Disease and Molecular Diagnostics Confer …
London, March 7, 2024 - MarketsandMarkets is thrilled to announce the eagerly awaited 5th Annual Infectious Disease and Molecular Diagnostics Conference, scheduled to take place on March 21st - 22nd, 2024, at the prestigious Millennium Gloucester Hotel, located at 4-18 Harrington Gardens, London SW7 4LH.
This conference promises to be a groundbreaking event, showcasing the latest trends and insights in diagnosis, as well as unveiling cutting-edge technologies that are revolutionizing the…

Infection Control, Sterilization & Decontamination Conference |21st - 22nd March …
MarketsandMarkets is pleased to announce its 8th Annual Infection Control, Sterilisation, and Decontamination in Healthcare Conference, which will take place March 21-22, 2024, in London, UK. With the increased risk of infection due to improper sterilisation and decontamination practices, the safety of patients and healthcare workers is of paramount importance nowadays.
Enquire Now @ https://events.marketsandmarkets.com/infection-control-sterilization-and-decontamination-conference/
This conference aims to bring together all the stakeholders to discuss the obstacles in achieving…
Breast Augmentation Market Key Players, Demands, Cost, Size, Procedure, Shape, S …
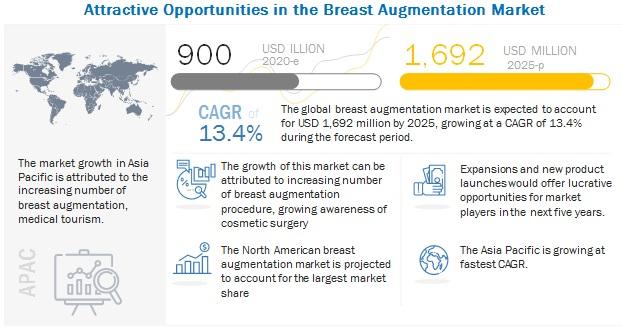
The global Breast Augmentation Market in terms of revenue was estimated to be worth $900 million in 2020 and is poised to reach $1,692 million by 2025, growing at a CAGR of 13.4% from 2020 to 2025. The new research study consists of an industry trend analysis of the market. The new research study consists of industry trends, pricing analysis, patent analysis, conference and webinar materials, key stakeholders, and buying…
More Releases for Table
Table Tennis Table Market: Competitive Dynamics & Global Outlook 2024
LP INFORMATION offers a latest published report on Table Tennis Table Market Analysis and Forecast 2019-2025 delivering key insights and providing a competitive advantage to clients through a detailed report.
According to this study, over the next five years the Table Tennis Table market will register a xx% CAGR in terms of revenue, the global market size will reach US$ xx million by 2024, from US$ xx million in 2019.…
Flatwares Market Report 2018: Segmentation by Type (Table Knife, Table Fork, Tab …
Global Flatwares market research report provides company profile for Yamazaki, Reed & Barton, Elegance, Farberware, Gourmet Basics by Mikasa, BergHOFF, Cambridge Silversmith, Ginkgo, Wallace and Others.
This market study includes data about consumer perspective, comprehensive analysis, statistics, market share, company performances (Stocks), historical analysis 2012 to 2017, market forecast 2018 to 2025 in terms of volume, revenue, YOY growth rate, and CAGR for the year 2018 to 2025, etc. The…
Global Table Linen Market 2017: IKEA, URQUILDLINEN, Jomar Table Linens
WiseGuyReports.com adds “Global Table Linen Market Report 2017” reports to its Database.
With the slowdown in world economic growth, the Table Linen industry has also suffered a certain impact, but still maintained a relatively optimistic growth. The past four years, Table Linen market size maintained the average annual growth rate of 1.17% from 18200 million $ in 2013 to 19100 million $ in 2016. BisReport analysts believe that in the next…
Table Linen Market Forecast 2017-2022: IKEA, URQUILDLINEN, Premier Table Linens, …
Global Table Linen Market Research Report
A market study ” Global Table Linen Market ” examines the performance of the Table Linen market 2017. It encloses an in-depth Research of the Table Linen market state and the competitive landscape globally. This report analyzes the potential of Table Linen market in the present and the future prospects from various angles in detail.
Inquiry For Sample Report, Click Here: http://bit.ly/2s0g8nd
The Global Table Linen Market…
Global and Chinese Table Tennis Table Market Demand Growth Report 2017
Research carried out a market study on the Table Tennis Table market. The report titled, “Table Tennis Table ”, is an in-depth analysis of the Table Tennis Table market and offers important insights related to the market such as market share, size and growth. The presented study discusses the current trends, opportunities and the challenges in the Table Tennis Table market. Key statistics, growth prospects and the current status…
Billiard Table Manufacturer, Pool Table Supplies
Chevillotte Billiards manufactures the highest standard quality billiards table in the world. Our manufacturing facility has been making billiard table and it's accessories since the 1860's and earned a lots of name and respects in the billiards industry. We manufacture our billiards products as per the requirements of the clients and also assist customized solutions to them. Our range is designed as per the latest market trends and is ideal…