Press release
Automotive Interiors Market by Component (Cockpit Module, Flooring, Door Panel, Automotive Seat, Interior Lighting, and Other) and Vehicle Type (Passenger Car and Commercial Vehicle): Global Opportunity Analysis and Industry Forecast, 2018 - 2025
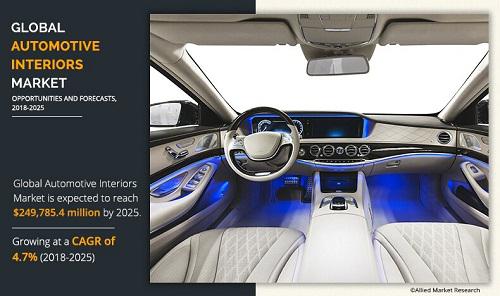
Automotive Interiors Market
Download PDF Report Sample @ https://www.alliedmarketresearch.com/request-sample/1426?utm_source=OPR
Growing need to improve fuel efficiency due to rising crude oil prices and increasing focus on well-being of drivers drive the growth of the global automotive interiors market. In addition, technological advancements and high demand for luxurious vehicles supplement the market growth. However, ongoing trade war & surge in automotive import tariffs and increase in raw-material prices hamper the market growth. On the contrary, untapped developing markets in Africa and Asia and advancements in in-vehicle infotainment are expected to create lucrative opportunities for the market players in future.
The automotive seat segment held the largest share in 2017, registering about 44% of the total revenue, owing to increase in sales of vehicles and high need for low weight seats for higher fuel efficiency. However, the interior lighting segment is expected to register the fastest CAGR of 7.5% during the forecast period, owing to variations in trends related to lighting and vehicles signal indication using LED. The other segments analyzed in the report include cockpit module, door panel, and flooring.
The commercial vehicle segment is estimated to manifest the fastest CAGR of 4.9% from 2018 to 2025, owing to growing demand for commercial vehicles in the developing countries. However, the passenger cars segment held the largest share in 2017, accounting for 70.7% of the total revenue, owing to rise in demand for passenger vehicles in both emerging and developed countries.
Get Customized Report @ https://www.alliedmarketresearch.com/request-for-customization/1426?utm_source=OPR
In 2017, Asia-Pacific region governed the market, accounting for more than one-third share of the global market, owing to perpetual technological developments and increasing production of passenger and heavy commercial vehicles. However, the LAMEA region is expected to portray the fastest CAGR of 6.5% during the study period, owing to huge untapped markets in the region and anticipated growth opportunities in Africa. The other regions analyzed in the report are North America and Europe.
The report presents the analysis of leading market players, including Adient plc., Faurecia Interior System, Hyundai Mobis Company, Lear Corporation, Visteon Corporation, Calsonic Kansei Corp., Grupo Antolin, IAC Group, Robert Bosch, and Yanfeng Automotive Interiors.
LIST OF FIGURES
FIGURE 01. KEY MARKET SEGMENTS
FIGURE 02. EXECUTIVE SUMMARY
FIGURE 03. EXECUTIVE SUMMARY
FIGURE 04. TOP IMPACTING FACTORS
FIGURE 05. TOP INVESTMENT POCKETS
FIGURE 06. TOP WINNING STRATEGIES, BY YEAR, 2015–2018*
FIGURE 07. TOP WINNING STRATEGIES, BY YEAR, 2015–2018*
FIGURE 08. TOP WINNING STRATEGIES, BY COMPANY, 2015–2018*
FIGURE 09. MODERATE-TO-HIGH BARGAINING POWER OF SUPPLIERS
FIGURE 10. MODERATE-TO-HIGH THREAT OF NEW ENTRANTS
FIGURE 11. MODERATE THREAT OF SUBSTITUTES
FIGURE 12. HIGH-TO-MODERATE INTENSITY OF RIVALRY
FIGURE 13. HIGH-TO-MODERATE BARGAINING POWER OF BUYERS
FIGURE 14. MARKET SHARE ANALYSIS (2017)
FIGURE 15. GLOBAL AUTOMOTIVE INTERIOR MARKET SHARE, BY COMPONENT, 2017–2025 (%)
FIGURE 16. GLOBAL AUTOMOTIVE INTERIOR MARKET BY INFOTAINMENT SYSTEM COCKPIT MODULE TYPE, 2017-2025
FIGURE 17. GLOBAL AUTOMOTIVE INTERIOR MARKET BY INSTRUMENT CLUSTER COCKPIT MODULE TYPE, 2017-2025
FIGURE 18. GLOBAL AUTOMOTIVE INTERIOR MARKET BY TELEMATICS COCKPIT MODULE TYPE, 2017-2025
FIGURE 19. GLOBAL AUTOMOTIVE INTERIOR MARKET BY OTHERS(AUDIO & CONNECTIVITY) COCKPIT MODULE TYPE, 2017-2025
FIGURE 20. COMPARATIVE SHARE ANALYSIS OF AUTOMOTIVE INTERIOR MARKET FOR COCKPIT MODULE, BY COUNTRY, 2017 & 2025 (%)
FIGURE 21. COMPARATIVE SHARE ANALYSIS OF AUTOMOTIVE INTERIOR MARKET FOR FLOORING, BY COUNTRY, 2017 & 2025 (%)
FIGURE 22. COMPARATIVE SHARE ANALYSIS OF AUTOMOTIVE INTERIOR MARKET FOR DOOR PANEL, BY COUNTRY, 2017 & 2025 (%)
FIGURE 23. COMPARATIVE SHARE ANALYSIS OF AUTOMOTIVE INTERIOR MARKET FOR AUTOMOTIVE SEAT, BY COUNTRY, 2017 & 2025 (%)
FIGURE 24. COMPARATIVE SHARE ANALYSIS OF AUTOMOTIVE INTERIOR MARKET FOR INTERIOR LIGHTING, BY COUNTRY, 2017 & 2025 (%)
FIGURE 25. COMPARATIVE SHARE ANALYSIS OF AUTOMOTIVE INTERIOR MARKET FOR OTHER, BY COUNTRY, 2017 & 2025 (%)
FIGURE 26. GLOBAL AUTOMOTIVE INTERIOR MARKET SHARE, BY VEHICLE TYPE, 2017–2025 (%)
FIGURE 27. COMPARATIVE SHARE ANALYSIS OF AUTOMOTIVE INTERIOR MARKET FOR PASSENGER CAR, BY COUNTRY, 2017 & 2025 (%)
FIGURE 28. GLOBAL AUTOMOTIVE INTERIOR MARKET SHARE, BY LIGHT COMMERCIAL VEHICLE, 2017–2025 (%)
FIGURE 29. GLOBAL AUTOMOTIVE INTERIOR MARKET SHARE, BY HEAVY COMMERCIAL VEHICLE, 2017–2025 (%)
FIGURE 30. AUTOMOTIVE INTERIOR MARKET, BY REGION, 2017-2025 (%)
FIGURE 31. COMPARATIVE SHARE ANALYSIS OF AUTOMOTIVE INTERIOR MARKET, BY COUNTRY, 2017–2025 (%)
FIGURE 32. U. S. AUTOMOTIVE INTERIOR MARKET, 2017–2025 ($MILLION)
FIGURE 33. CANADA AUTOMOTIVE INTERIOR MARKET, 2017–2025 ($MILLION)
FIGURE 34. MEXICO AUTOMOTIVE INTERIOR MARKET, 2017–2025 ($MILLION)
FIGURE 35. COMPARATIVE SHARE ANALYSIS OF AUTOMOTIVE INTERIOR MARKET, BY COUNTRY, 2017–2025 (%)
FIGURE 36. U.K. AUTOMOTIVE INTERIOR MARKET, 2017–2025 ($MILLION)
FIGURE 37. GERMANY AUTOMOTIVE INTERIOR MARKET, 2017–2025 ($MILLION)
FIGURE 38. FRANCE AUTOMOTIVE INTERIOR MARKET, 2017–2025 ($MILLION)
FIGURE 39. RUSSIA AUTOMOTIVE INTERIOR MARKET, 2017–2025 ($MILLION)
FIGURE 40. REST OF EUROPE AUTOMOTIVE INTERIOR MARKET, 2017–2025 ($MILLION)
FIGURE 41. COMPARATIVE SHARE ANALYSIS OF AUTOMOTIVE INTERIOR MARKET, BY COUNTRY, 2017–2025 (%)
FIGURE 42. CHINA AUTOMOTIVE INTERIOR MARKET, 2017–2025 ($MILLION)
FIGURE 43. JAPAN AUTOMOTIVE INTERIOR MARKET, 2017–2025 ($MILLION)
FIGURE 44. INDIA AUTOMOTIVE INTERIOR MARKET, 2017–2025 ($MILLION)
FIGURE 45. AUSTRALIA AUTOMOTIVE INTERIOR MARKET, 2017–2025 ($MILLION)
FIGURE 46. REST OF ASIA-PACIFIC AUTOMOTIVE INTERIOR MARKET, 2017–2025 ($MILLION)
FIGURE 47. COMPARATIVE SHARE ANALYSIS OF AUTOMOTIVE INTERIOR MARKET, BY COUNTRY, 2017–2025 (%)
FIGURE 48. LATIN AMERICA AUTOMOTIVE INTERIOR MARKET, 2017–2025 ($MILLION)
FIGURE 49. MIDDLE EAST AUTOMOTIVE INTERIOR MARKET, 2017–2025 ($MILLION)
FIGURE 50. AFRICA AUTOMOTIVE INTERIOR MARKET, 2017–2025 ($MILLION)
FIGURE 51. ADIENT: NET SALES, 2015–2017 ($MILLION)
FIGURE 52. ADIENT: REVENUE SHARE BY REGION, 2017 (%)
FIGURE 53. FAURECIA S.A : NET SALES, 2015–2017 ($MILLION)
FIGURE 54. FAURECIA S.A: REVENUE SHARE BY SEGMENT, 2017 (%)
FIGURE 55. FAURECIA S.A: REVENUE SHARE BY REGION, 2017 (%)
FIGURE 56. GRUPO ANTOLIN: NET SALES, 2015–2017 ($MILLION)
FIGURE 57. GRUPO ANTOLIN: REVENUE SHARE BY SEGMENT, 2017 (%)
FIGURE 58. GRUPO ANTOLIN: REVENUE SHARE BY REGION, 2017 (%)
FIGURE 59. HYUNDAI MOBIS COMPANY, LTD.: NET SALES, 2015–2017 ($MILLION)
FIGURE 60. HYUNDAI MOBIS COMPANY, LTD.: REVENUE SHARE BY SEGMENT, 2017 (%)
FIGURE 61. HYUNDAI MOBIS COMPANY, LTD.: REVENUE SHARE BY REGION, 2017 (%)
FIGURE 62. LEAR CORPORATION: NET SALES, 2015–2017 ($MILLION)
FIGURE 63. LEAR CORPORATION: REVENUE SHARE BY SEGMENT, 2017 (%)
FIGURE 64. LEAR CORPORATION: REVENUE SHARE BY REGION, 2017 (%)
FIGURE 65. ROBERT BOSCH: NET SALES, 2015–2017 ($MILLION)
FIGURE 66. ROBERT BOSCH: REVENUE SHARE BY SEGMENT, 2017 (%)
FIGURE 67. ROBERT BOSCH: REVENUE SHARE BY REGION, 2017 (%)
FIGURE 68. VISTEON CORPORATION: NET SALES, 2015–2017 ($MILLION)
FIGURE 69. VISTEON CORPORATION: REVENUE SHARE BY REGION, 2017 (%)
Access Full Summery @ https://www.alliedmarketresearch.com/automotive-interiors-market?utm_source=OPR
About Us
Allied Market Research (AMR) is a full-service market research and business-consulting wing of Allied Analytics LLP based in Portland, Oregon. Allied Market Research provides global enterprises as well as medium and small businesses with unmatched quality of "Market Research Reports" and "Business Intelligence Solutions.” AMR has a targeted view to provide business insights and consulting to assist its clients to make strategic business decisions and achieve sustainable growth in their respective market domain.
We are in professional corporate relations with various companies and this helps us in digging out market data that helps us generate accurate research data tables and confirms utmost accuracy in our market forecasting. Each and every data presented in the reports published by us is extracted through primary interviews with top officials from leading companies of domain concerned. Our secondary data procurement methodology includes deep online and offline research and discussion with knowledgeable professionals and analysts in the industry.
Contact:
David Correa
5933 NE Win Sivers Drive
#205, Portland, OR 97220
United States
Toll Free (USA/Canada):
+1-800-792-5285, +1-503-894-6022, +1-503-446-1141
UK: +44-845-528-1300
Hong Kong: +852-301-84916
India (Pune): +91-20-66346060
Fax: +1?855?550-5975
help@alliedmarketresearch.com
Web: https://www.alliedmarketresearch.com
This release was published on openPR.
Permanent link to this press release:
Copy
Please set a link in the press area of your homepage to this press release on openPR. openPR disclaims liability for any content contained in this release.
You can edit or delete your press release Automotive Interiors Market by Component (Cockpit Module, Flooring, Door Panel, Automotive Seat, Interior Lighting, and Other) and Vehicle Type (Passenger Car and Commercial Vehicle): Global Opportunity Analysis and Industry Forecast, 2018 - 2025 here
News-ID: 1432812 • Views: …
More Releases from Allied Market Research

Network Analytics Market Reach USD 17 Billion by 2032, Key Factors behind Market …
Allied Market Research published a new report, titled, " The Network Analytics Market Reach USD 17 Billion by 2032, Key Factors behind Market's Growth." The report offers an extensive analysis of key growth strategies, drivers, opportunities, key segment, Porter's Five Forces analysis, and competitive landscape. This study is a helpful source of information for market players, investors, VPs, stakeholders, and new entrants to gain thorough understanding of the industry and…

Future Outlook: Emerging Trends in the Oilfield Chemicals Market, Asia, Middle E …
The report published by Allied Market Research titled "Asia, Middle East, and Africa Oilfield Chemicals Market by Type (Production Chemicals, Integrity Chemicals): Regional Opportunity Analysis and Industry Forecast, 2023-2032" provides insights into the Asia, Middle East, and Africa Oilfield Chemicals Market is anticipated to reach $27.3 billion by 2032, witnessing a compound annual growth rate (CAGR) of 4.3% from 2023 to 2032.
Request Report PDF:
https://www.alliedmarketresearch.com/request-sample/111312
The Asia, Middle East, and Africa…
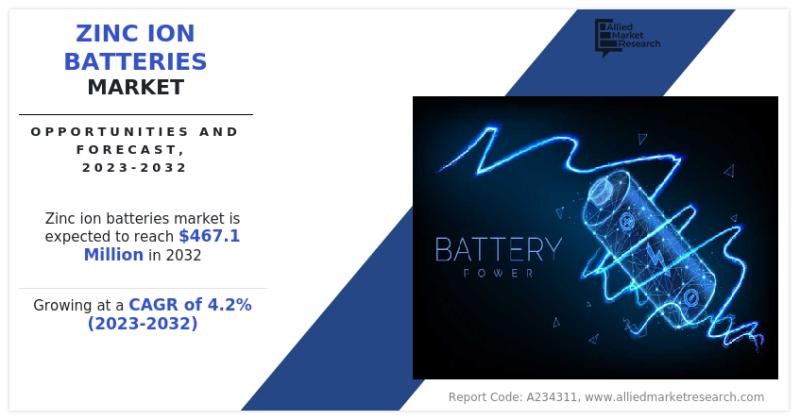
Zinc Ion Batteries Market Boosting Technologies, Industry Growth Analysis, Indus …
Allied Market Research published an exclusive report, titled, "Zinc Ion Batteries Market Size, Share, Competitive Landscape and Trend Analysis Report by Type, by Application : Global Opportunity Analysis and Industry Forecast, 2023-2032".
The Global Zinc Ion Batteries Market size was valued at $314.6 million in 2022, and is projected to reach $467.1 million by 2032, growing at a CAGR of 4.2% from 2023 to 2032.
Download Research Report Sample & TOC :…

France Cardiovascular Ultrasound Market: To Exhibits Remarkable Growth
France cardiovascular ultrasound market was valued at $162.97 million in 2020, and is projected to reach $252.90 million by 2030, registering a CAGR of 4.7% from 2021 to 2030. Cardiac ultrasound, also known as echocardiography, refers to the ultrasound imaging of the heart. It examines the structure and function of the heart and related vessels. Image analysis is driven by technology, as diagnosing heart disease requires a fairly detailed view…
More Releases for FIGURE
Floralite - Reduce Fat & Get Attractive Figure How To Buy!
Floralite Have you been working on your eating routine without seeing the results that you are anticipating? There is indeed thing called Floralite diet pills.
Advantages of Floralite
Floralite One of various things to esteem about this thing is that it's made expressly for the Floralite diet. That is an epic notwithstanding considering the way that when you use a thing that is custom fitted to work with the movements…
THE WORLD'S MOST CONTROVERSIAL ACTION FIGURE...EVER!
FOR IMMEDIATE RELEASE
THE WORLD'S MOST CONTROVERSIAL ACTION FIGURE...EVER!
Contact: William Hirsch - Schlock Toys @ +1-949-677-9353 or DocSchlock@SchlockToys.com
Featured on Tomi with Fox News host Tomi Lahren! SCHLOCK TOYS join forces with Kickstarter to Make Toys Great Again!
The Kickstarter campaign page can be found HERE: https://www.kickstarter.com/projects/schlocktoys/collectors-edition-talking-trump-2020-man-of-action-figure/description
“What a great message to be sent, and I think Trump himself would love this and that he’d be excited about it!”
- Tomi Lahren, Fox News
“You…
Macarons Market Latest Sales Figure Signals More Opportunities Ahead
Global Macarons Sales Market(Sales,Revenue and competitors Analysis of Major Market)from 2014-2026 is latest research study released by HTF MI evaluating the market, highlighting opportunities, risk side analysis, and leveraged with strategic and tactical decision-making support. The study provides information on market trends and development, drivers, capacities, technologies, and on the changing investment structure of the Global Macarons Market. Some of the key players profiled in the study are La Dure�,…
Global Womens Figure Skates Market Growth 2019-2024
LP INFORMATION offers a latest published report on Womens Figure Skates Market Analysis and Forecast 2019-2025 delivering key insights and providing a competitive advantage to clients through a detailed report.
According to this study, over the next five years the Womens Figure Skates market will register a xx% CAGR in terms of revenue, the global market size will reach US$ xx million by 2024, from US$ xx million in 2019.…
Figure Skating Equipment Market Report 2018: Segmentation by Type (Figure Skate …
Global Figure Skating Equipment market research report provides company profile for SP-Teri, Graf Skate, Riedell Shoes, Roces, American Athletic, Rollerblade, Winnwell, Dongguan King Line, Jackson Ultima, HD Sports(MK Blades, John Wilson), Edea, Risport Skates, Paramount Skates and Others.
This market study includes data about consumer perspective, comprehensive analysis, statistics, market share, company performances (Stocks), historical analysis 2012 to 2017, market forecast 2018 to 2025 in terms of volume, revenue, YOY…
Long-lasting Performance Improvement with Key Figure Analysis
Vienna/Reutlingen, October 17, 2012 – Manz, a leading high-tech mechanical engineering company, is optimizing its processes in strategic sourcing in order to recognize the risks and potential associated with each supplier early on so that the sourcing department can react to them in time. POOL4TOOL’s customized eSolutions localize and analyze key figures that are relevant to the decision making process, and displays these figures in a comprehensive and transparent way.…