Press release
Autonomous Vehicle Market by Level of Automation (Level 3, Level 4, and Level 5) and Component (Hardware, Software, and Service) and Application (Civil, Robo Taxi, Self-driving Bus, Ride Share, Self-driving Truck, and Ride Hail)

Autonomous Vehicle Market
According to a recent report published by Allied Market Research, titled, Global Autonomous Vehicle Market by Level of Automation, Component, and Application: Global Opportunity Analysis and Industry Forecast, 20192026, The global autonomous vehicle market is expected to be valued at $54.23 billion in 2019, and is projected to reach $556.67 billion by 2026, registering a CAGR of 39.47% from 2019 to 2026.
Download PDF Report Sample @ https://www.alliedmarketresearch.com/request-sample/4649?utm_source=OPR
Autonomous vehicle also known as self-driving vehicles uses artificial intelligence (AI) software, light detection & ranging (LiDAR), and RADAR sensing technology, which is further used to monitor a 60-meter range around the car and to form an active 3D map of the current environment. The vehicle is designed to travel between destinations without a human operator.
They combine sensors and software to control, navigate, and drive the vehicle. Autonomous vehicle uses LiDAR, RADAR sensors for its operation. Most self-driving systems create and maintain an internal map of their surroundings, based on a wide array of sensors, like radar.
The major companies profiled in the report are General Motors, Daimler AG, Ford Motor Company., Volkswagen Group, BMW AG, Renault-Nissan-Mitsubishi alliance, Volvo-Autoliv-Ericsson-Zenuity alliance, Groupe SA, AB Volvo, Toyota Motor Corporation, and Tesla Inc. Other companies in accordance with auto suppliers are Robert Bosch GMBH, Aptiv, Continental AG, and Denso Corporation. Also by technology providers, it includes Waymo, NVDIA Corporation, Intel Corporation, Baidu, and Samsung. And based on autonomous vehicle as a service provider, it includes Uber, Lyft and Didi Chuxing.
The autonomous vehicle market is segmented based on level of automation, component, application, and region. Based on level of automation, the market is divided into level 3, level 4, and level 5. By component, it is classified into hardware, software, and service. The applications discussed in this study are civil, robo taxi, ride hail, ride share, self-driving truck, and self-driving bus. Based on region, the market is analyzed across North America, Europe, AsiaPacific, and LAMEA.
Get Customized Report @ https://www.alliedmarketresearch.com/request-for-customization/4649?utm_source=OPR
Development of smart cities and rise in demand for connected cars using internet of things (IoT), help solve the problem of traffic congestion, and impact the growth of the market. In addition, development in automotive sector, demand for the luxury cars, government regulation, high cost, and the burgeoning threat from hackers in driving operation also affect the growth of the global autonomous vehicle market. These factors are anticipated to either drive or hamper the market growth.
Through Internet of Things, car drivers improve their performance by receiving the real-time feedback from high speed in-memory computing systems inbuilt in connected cars. These inbuilt computers offer features such as collecting, analyzing, and storing data which helps for making decisions. The wide adoption of connected cars is expected to create lucrative opportunities for autonomous and semi-autonomous vehicles.
Rapid growth of economies ensures robust development from transport infrastructure to development of smart cities. Many countries such as Mexico, Canada, and the U.S. are deploying digital infrastructure to facilitate connectivity between vehicles and infrastructures to gather vital information, and thereby, reduce traffic congestion and increase road safety. Rise in the development of smart cities is expected to significantly drive the autonomous vehicle market.
LIST OF TABLES
TABLE 01. GLOBAL AUTONOMOUS VEHICLE MARKET, BY LEVEL OF AUTOMATION, 2019-2026 ($BILLION)
TABLE 02. GLOBAL AUTONOMOUS VEHICLE MARKET, BY LEVEL OF AUTOMATION, 2019-2026 (THOUSAND UNITS)
TABLE 03. AUTONOMOUS VEHICLE MARKET REVENUE FOR LEVEL 3, BY REGION 2019-2026 ($BILLION)
TABLE 04. AUTONOMOUS VEHICLE MARKET VOLUME FOR LEVEL 3, BY REGION 2019-2026 (THOUSAND UNITS)
TABLE 05. AUTONOMOUS VEHICLE MARKET REVENUE FOR LEVEL 4, BY REGION 2019-2026($BILLION)
TABLE 06. AUTONOMOUS VEHICLE MARKET VOLUME FOR LEVEL 4, BY REGION 2019-2026(THOUSAND UNITS)
TABLE 07. AUTONOMOUS VEHICLE MARKET REVENUE FOR LEVEL 5, BY REGION 2019-2026($BILLION)
TABLE 08. AUTONOMOUS VEHICLE MARKET VOLUME FOR LEVEL 5, BY REGION 2019-2026(THOUSAND UNITS)
TABLE 09. GLOBAL AUTONOMOUS VEHICLE MARKET REVENUE, BY APPLICATION, 2019-2026 ($BILLION)
TABLE 10. GLOBAL AUTONOMOUS VEHICLE MARKET VOLUME, BY APPLICATION, 2019-2026 (THOUSAND UNITS)
TABLE 11. AUTONOMOUS VEHICLE MARKET REVENUE FOR CIVIL, BY REGION 2019-2026($BILLION)
TABLE 12. AUTONOMOUS VEHICLE MARKET VOLUME FOR CIVIL, BY REGION 2019-2026(THOUSAND UNITS)
TABLE 13. AUTONOMOUS VEHICLE MARKET REVENUE FOR ROBO TAXI, BY REGION 2019-2026($BILLION)
TABLE 14. AUTONOMOUS VEHICLE MARKET VOLUME FOR ROBO TAXI, BY REGION 2019-2026(THOUSAND UNITS)
TABLE 15. AUTONOMOUS VEHICLE MARKET REVENUE FOR RIDE HAIL, BY REGION 2019-2026($BILLION)
TABLE 16. AUTONOMOUS VEHICLE MARKET VOLUME FOR RIDE HAIL, BY REGION 2019-2026(THOUSAND UNITS)
TABLE 17. AUTONOMOUS VEHICLE MARKET REVENUE FOR RIDE SHARE, BY REGION 2019-2026($BILLION)
TABLE 18. AUTONOMOUS VEHICLE MARKET VOLUME FOR RIDE SHARE, BY REGION 2019-2026(THOUSAND UNITS)
TABLE 19. AUTONOMOUS VEHICLE MARKET REVENUE FOR SELF DRIVING TRUCK, BY REGION 2019-2026($BILLION)
TABLE 20. AUTONOMOUS VEHICLE MARKET VOLUME FOR SELF DRIVING TRUCK, BY REGION 2019-2026(THOUSAND UNITS)
TABLE 21. AUTONOMOUS VEHICLE MARKET REVENUE FOR SELF DRIVING BUS, BY REGION 2019-2026($BILLION)
TABLE 22. AUTONOMOUS VEHICLE MARKET VOLUME FOR SELF DRIVING BUS, BY REGION 2019-2026(THOUSAND UNITS)
TABLE 23. GLOBAL AUTONOMOUS VEHICLE MARKET REVENUE, BY COMPONENT, 2019-2026 ($BILLION)
TABLE 24. GLOBAL AUTONOMOUS VEHICLE MARKET VOLUME, BY COMPONENT, 2019-2026 (THOUSAND UNITS)
TABLE 25. GLOBAL AUTONOMOUS VEHICLE MARKET VALUE, BY HARDWARE 2019-2026($BILLION)
TABLE 26. GLOBAL AUTONOMOUS VEHICLE MARKET VOLUME, BY HARDWARE 2019-2026($THOUSAND UNITS)
TABLE 27. AUTONOMOUS VEHICLE MARKET REVENUE FOR HARDWARE, BY REGION 2019-2026($BILLION)
TABLE 28. AUTONOMOUS VEHICLE MARKET VOLUME FOR HARDWARE, BY REGION 2019-2026(THOUSAND UNITS)
TABLE 29. GLOBAL AUTONOMOUS VEHICLE MARKET VALUE, BY AUTONOMUS HARDWARE 2019-2026($BILLION)
TABLE 30. GLOBAL AUTONOMOUS VEHICLE MARKET VOLUME, BY AUTONOMUS HARDWARE 2019-2026 (THOUSAND UNITS)
TABLE 31. AUTONOMOUS VEHICLE MARKET REVENUE FOR SOFTWARE, BY REGION 2019-2026($BILLION)
TABLE 32. AUTONOMOUS VEHICLE MARKET REVENUE FOR SERVICE, BY REGION 2019-2026($BILLION)
TABLE 33. NORTH AMERICA AUTONOMOUS VEHICLE MARKET REVENUE, BY LEVEL OF AUTOMATION 2019-2026($BILLION)
TABLE 34. NORTH AMERICA AUTONOMOUS VEHICLE MARKET VOLUME, BY LEVEL OF AUTOMATION 2019-2026(THOUSAND UNITS)
TABLE 35. NORTH AMERICA AUTONOMOUS VEHICLE MARKET REVENUE, BY APPLICATION 2019-2026($BILLION)
TABLE 36. NORTH AMERICA AUTONOMOUS VEHICLE MARKET VOLUME, BY APPLICATION 2019-2026(THOUSAND UNITS)
TABLE 37. NORTH AMERICA AUTONOMOUS VEHICLE MARKET VALUE, BY COMPONENT, 2019-2026($BILLION)
TABLE 38. NORTH AMERICA AUTONOMOUS VEHICLE MARKET VOLUME, BY COMPONENT, 2019-2026(THOUSAND UNITS)
TABLE 39. NORTH AMERICA AUTONOMOUS VEHICLE MARKET VALUE, BY HARDWARE 2019-2026($BILLION)
TABLE 40. NORTH AMERICA AUTONOMOUS VEHICLE MARKET VOLUME, BY HARDWARE 2019-2026($THOUSAND UNITS)
TABLE 41. NORTH AMERICA AUTONOMOUS VEHICLE MARKET VALUE, BY AUTONOMUS HARDWARE 2019-2026($BILLION)
TABLE 42. NORTH AMERICA AUTONOMOUS VEHICLE MARKET VOLUME, BY AUTONOMUS HARDWARE 2019-2026($THOUSAND UNITS)
TABLE 43. U.S. AUTONOMOUS VEHICLE MARKET REVENUE, BY LEVEL OF AUTOMATION 2019-2026($BILLION)
TABLE 44. U.S. AUTONOMOUS VEHICLE MARKET VOLUME, BY LEVEL OF AUTOMATION 2019-2026(THOUSAND UNITS)
TABLE 45. U.S. AUTONOMOUS VEHICLE MARKET REVENUE, BY APPLICATION 2019-2026($BILLION)
TABLE 46. U.S. AUTONOMOUS VEHICLE MARKET VOLUME, BY APPLICATION 2019-2026(THOUSAND UNITS)
TABLE 47. U.S. AUTONOMOUS VEHICLE MARKET REVENUE, BY COMPONENT 2019-2026($BILLION)
TABLE 48. U.S. AUTONOMOUS VEHICLE MARKET VOLUME, BY COMPONENT 2019-2026(THOUSAND UNITS)
TABLE 49. CANADA AUTONOMOUS VEHICLE MARKET REVENUE, BY LEVEL OF AUTOMATION 2019-2026($BILLION)
TABLE 50. CANADA AUTONOMOUS VEHICLE MARKET VOLUME, BY LEVEL OF AUTOMATION 2019-2026(THOUSAND UNITS)
TABLE 51. CANADA AUTONOMOUS VEHICLE MARKET REVENUE, BY APPLICATION 2019-2026($BILLION)
TABLE 52. CANADA AUTONOMOUS VEHICLE MARKET VOLUME, BY APPLICATION 2019-2026(THOUSAND UNITS)
TABLE 53. CANADA AUTONOMOUS VEHICLE MARKET REVENUE, BY COMPONENT 2019-2026($BILLION)
TABLE 54. CANADA AUTONOMOUS VEHICLE MARKET VOLUME, BY COMPONENT 2019-2026(THOUSAND UNITS)
TABLE 55. MEXICO AUTONOMOUS VEHICLE MARKET REVENUE, BY LEVEL OF AUTOMATION 2019-2026($BILLION)
TABLE 56. MEXICO AUTONOMOUS VEHICLE MARKET VOLUME, BY LEVEL OF AUTOMATION 2019-2026(THOUSAND UNITS)
TABLE 57. MEXICO AUTONOMOUS VEHICLE MARKET REVENUE, BY APPLICATION 2019-2026($BILLION)
TABLE 58. MEXICO AUTONOMOUS VEHICLE MARKET VOLUME, BY APPLICATION 2019-2026(THOUSAND UNITS)
TABLE 59. MEXICO AUTONOMOUS VEHICLE MARKET REVENUE, BY COMPONENT 2019-2026($BILLION)
TABLE 60. MEXICO AUTONOMOUS VEHICLE MARKET VOLUME, BY COMPONENT 2019-2026(THOUSAND UNITS)
TABLE 61. EUROPE AUTONOMOUS VEHICLE MARKET REVENUE, BY LEVEL OF AUTOMATION 2019-2026($BILLION)
TABLE 62. EUROPE AUTONOMOUS VEHICLE MARKET VOLUME, BY LEVEL OF AUTOMATION 2019-2026(THOUSAND UNITS)
TABLE 63. EUROPE AUTONOMOUS VEHICLE MARKET REVENUE, BY APPLICATION 2019-2026($BILLION)
TABLE 64. EUROPE AUTONOMOUS VEHICLE MARKET VOLUME, BY APPLICATION 2019-2026(THOUSAND UNITS)
TABLE 65. EUROPE AUTONOMOUS VEHICLE MARKET REVENUE, BY COMPONENT 2019-2026($BILLION)
TABLE 66. EUROPE AUTONOMOUS VEHICLE MARKET VOLUME, BY COMPONENT 2019-2026(THOUSAND UNITS)
TABLE 67. EUROPE AUTONOMOUS VEHICLE MARKET VALUE, BY HARDWARE 2019-2026($BILLION)
TABLE 68. EUROPE AUTONOMOUS VEHICLE MARKET VOLUME, BY HARDWARE 2019-2026($THOUSAND UNITS)
TABLE 69. EUROPE AUTONOMOUS VEHICLE MARKET VALUE, BY AUTONOMUS HARDWARE 2019-2026($BILLION)
TABLE 70. UK AUTONOMOUS VEHICLE MARKET REVENUE, BY LEVEL OF AUTOMATION 2019-2026($BILLION)
TABLE 71. UK AUTONOMOUS VEHICLE MARKET VOLUME, BY LEVEL OF AUTOMATION 2019-2026(THOUSAND UNITS)
TABLE 72. UK AUTONOMOUS VEHICLE MARKET REVENUE, BY APPLICATION 2019-2026($BILLION)
TABLE 73. UK AUTONOMOUS VEHICLE MARKET VOLUME, BY APPLICATION 2019-2026(THOUSAND UNITS)
TABLE 74. UK AUTONOMOUS VEHICLE MARKET REVENUE, BY COMPONENT 2019-2026($BILLION)
TABLE 75. UK AUTONOMOUS VEHICLE MARKET VOLUME, BY COMPONENT 2019-2026(THOUSAND UNITS)
TABLE 76. GERMANY AUTONOMOUS VEHICLE MARKET REVENUE, BY LEVEL OF AUTOMATION 2019-2026($BILLION)
TABLE 77. GERMANY AUTONOMOUS VEHICLE MARKET VOLUME, BY LEVEL OF AUTOMATION 2019-2026(THOUSAND UNITS)
TABLE 78. GERMANY AUTONOMOUS VEHICLE MARKET REVENUE, BY APPLICATION 2019-2026($BILLION)
TABLE 79. GERMANY AUTONOMOUS VEHICLE MARKET VOLUME, BY APPLICATION 2019-2026(THOUSAND UNITS)
TABLE 80. GERMANY AUTONOMOUS VEHICLE MARKET REVENUE, BY COMPONENT 2019-2026($BILLION)
Access Full Summery @ https://www.alliedmarketresearch.com/autonomous-vehicle-market?utm_source=OPR
About Us
Allied Market Research (AMR) is a full-service market research and business-consulting wing of Allied Analytics LLP based in Portland, Oregon. Allied Market Research provides global enterprises as well as medium and small businesses with unmatched quality of "Market Research Reports" and "Business Intelligence Solutions.” AMR has a targeted view to provide business insights and consulting to assist its clients to make strategic business decisions and achieve sustainable growth in their respective market domain.
We are in professional corporate relations with various companies and this helps us in digging out market data that helps us generate accurate research data tables and confirms utmost accuracy in our market forecasting. Each and every data presented in the reports published by us is extracted through primary interviews with top officials from leading companies of domain concerned. Our secondary data procurement methodology includes deep online and offline research and discussion with knowledgeable professionals and analysts in the industry.
Contact:
David Correa
5933 NE Win Sivers Drive
#205, Portland, OR 97220
United States
Toll Free (USA/Canada):
+1-800-792-5285, +1-503-894-6022, +1-503-446-1141
UK: +44-845-528-1300
Hong Kong: +852-301-84916
India (Pune): +91-20-66346060
Fax: +1?855?550-5975
help@alliedmarketresearch.com
Web: https://www.alliedmarketresearch.com
This release was published on openPR.
Permanent link to this press release:
Copy
Please set a link in the press area of your homepage to this press release on openPR. openPR disclaims liability for any content contained in this release.
You can edit or delete your press release Autonomous Vehicle Market by Level of Automation (Level 3, Level 4, and Level 5) and Component (Hardware, Software, and Service) and Application (Civil, Robo Taxi, Self-driving Bus, Ride Share, Self-driving Truck, and Ride Hail) here
News-ID: 1416530 • Views: …
More Releases from Allied Market Research
Revolutionizing Healthcare: Protein Engineering Market Soars with a CAGR of 13.2 …
The global protein engineering market witnessed a remarkable rise, surging from $2.2 billion in 2022 to a projected $7.7 billion by 2032, with a robust Compound Annual Growth Rate (CAGR) of 13.2% between 2023 and 2032. This surge is attributed to the expanding applications across biopharmaceuticals, industrial sectors, and research domains. Notably, the escalation in cancer cases plays a pivotal role in propelling market growth, as protein engineering spearheads the…
Tomato Puree Market Value Projected to Expand | $7.7 Billion by 2032 With CAGR o …
The tomato puree market was valued at $5.2 billion in 2022, and is estimated to reach $7.7 billion by 2032, growing at a CAGR of 4.1% from 2023 to 2032. Tomato puree is a thick liquid or paste made by cooking and straining tomatoes to remove seeds and skins. It is a concentrated form of tomatoes that retains the rich flavor and vibrant color of the tomatoes. In the process…
Olive Oil Market to Witness Robust Expansion | $30.2 Billion by 2032
The olive oil market size was valued at $18.6 billion in 2022, and is estimated to reach $30.2 billion by 2032, growing at a CAGR of 5.2% from 2023 to 2032.
The Olive Oil Industry is driven by a rise in the number of cooking shows and food blogging. Celebrity chefs and influencers often showcase olive oil as a star ingredient in various culinary creations, emphasizing its versatility and health benefits.…
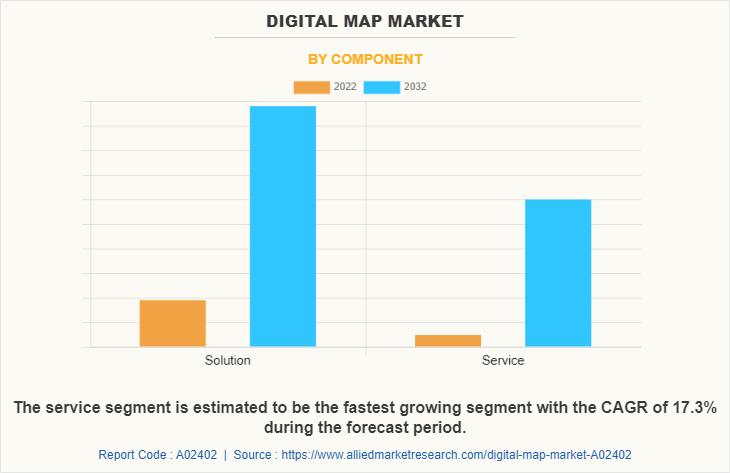
Digital Map Market Growth, Size, Future Scope and Industry Forecast 2032
The digital map industry was valued at $21.8 billion in 2022, and is estimated to reach $89.1 billion by 2032, growing at a CAGR of 15.4% from 2023 to 2032.
The service segment is expected to experience fastest growth in the coming years. The adoption of digital mapping service enhances software implementation, maximizes the value of existing installation by optimizing it, and minimizes the deployment cost & risks, and others, which…
More Releases for TABLE
Table Tennis Table Market: Competitive Dynamics & Global Outlook 2024
LP INFORMATION offers a latest published report on Table Tennis Table Market Analysis and Forecast 2019-2025 delivering key insights and providing a competitive advantage to clients through a detailed report.
According to this study, over the next five years the Table Tennis Table market will register a xx% CAGR in terms of revenue, the global market size will reach US$ xx million by 2024, from US$ xx million in 2019.…
Flatwares Market Report 2018: Segmentation by Type (Table Knife, Table Fork, Tab …
Global Flatwares market research report provides company profile for Yamazaki, Reed & Barton, Elegance, Farberware, Gourmet Basics by Mikasa, BergHOFF, Cambridge Silversmith, Ginkgo, Wallace and Others.
This market study includes data about consumer perspective, comprehensive analysis, statistics, market share, company performances (Stocks), historical analysis 2012 to 2017, market forecast 2018 to 2025 in terms of volume, revenue, YOY growth rate, and CAGR for the year 2018 to 2025, etc. The…
Global Table Linen Market 2017: IKEA, URQUILDLINEN, Jomar Table Linens
WiseGuyReports.com adds “Global Table Linen Market Report 2017” reports to its Database.
With the slowdown in world economic growth, the Table Linen industry has also suffered a certain impact, but still maintained a relatively optimistic growth. The past four years, Table Linen market size maintained the average annual growth rate of 1.17% from 18200 million $ in 2013 to 19100 million $ in 2016. BisReport analysts believe that in the next…
Table Linen Market Forecast 2017-2022: IKEA, URQUILDLINEN, Premier Table Linens, …
Global Table Linen Market Research Report
A market study ” Global Table Linen Market ” examines the performance of the Table Linen market 2017. It encloses an in-depth Research of the Table Linen market state and the competitive landscape globally. This report analyzes the potential of Table Linen market in the present and the future prospects from various angles in detail.
Inquiry For Sample Report, Click Here: http://bit.ly/2s0g8nd
The Global Table Linen Market…
Global and Chinese Table Tennis Table Market Demand Growth Report 2017
Research carried out a market study on the Table Tennis Table market. The report titled, “Table Tennis Table ”, is an in-depth analysis of the Table Tennis Table market and offers important insights related to the market such as market share, size and growth. The presented study discusses the current trends, opportunities and the challenges in the Table Tennis Table market. Key statistics, growth prospects and the current status…
Billiard Table Manufacturer, Pool Table Supplies
Chevillotte Billiards manufactures the highest standard quality billiards table in the world. Our manufacturing facility has been making billiard table and it's accessories since the 1860's and earned a lots of name and respects in the billiards industry. We manufacture our billiards products as per the requirements of the clients and also assist customized solutions to them. Our range is designed as per the latest market trends and is ideal…