Press release
Global Industrial Brakes Market Expected to Reach $1,074 Million, Brief Analysis on Top Key players Akebono Brake Industry Co., Ltd., Altra Industrial Motion Corp., Antec, S.A., Carlisle Brake & Friction, Coremo Ocmea S.P.A., Eaton, GKN Walterscheid Gmbh,
Industrial Brakes by Type, Application and End-user Industry: Global Opportunity Analysis and Industry Forecast, 2017-2023, the industrial brakes market was valued at $828 million in 2016, and is projected to reach at $1,074 million by 2023, growing at a CAGR of 3.70% from 2017 to 2023. Europe is expected to be the leading contributor to the industrial brakes market, followed by Asia-Pacific and North America.Rise in automation processes and adoption of industrial robotics is expected to drive the industrial brakes market. In addition, the increase in consciousness toward safety and efficiency of industrial machineries also boost the market growth. However, due to fluctuating prices of materials used for brakes impacting the profit margins and stringent regulations associated with industrial machineries are expected to hinder the growth of the market. Technological driven advancement such as sensors-enabled brake systems and automatic braking systems are anticipated to provide lucrative profitable opportunities to the market players during the forecast period.
Download PDF Report Sample @ https://www.alliedmarketresearch.com/request-sample/4460?utm_source=OpenPr
The key players operating in the global industrial brakes market are Akebono Brake Industry Co., Ltd., Altra Industrial Motion Corp., Antec, S.A., Carlisle Brake & Friction, Coremo Ocmea S.p.A., Eaton, GKN Walterscheid GmbH, Pintsch Bubenzer GmbH, Ringspann GmbH, and SIBRE - Siegerland Bremsen GmbH.
The industrial brakes market is segmented on the basis of type, application, end user, and geography. Based on type, the industry is classified into mechanically applied brakes, hydraulically applied brakes, pneumatically applied brakes, electrically applied brakes, drum & disc brakes, and spring brakes. By application, it is categorized into holding brakes, dynamic & emergency brakes, and tension brakes. Based on the end-user industry, it is divided into metals & mining, construction, manufacturing, entertainment, marine & shipping, and others (military, power generation, printing, transportation, and aerospace). By geography, it is analyzed across four regions including North America, Europe, Asia-Pacific, and LAMEA.
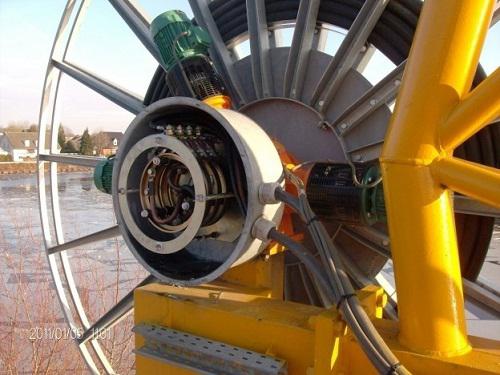
With the increase in demand for industrial robotics in all industries, there is a significant rise in the application of the industrial brakes. The brakes facilitate desired motion by delivering the right velocity, acceleration, and deceleration of the industrial equipment. Furthermore, it assists in holding and lifting heavy payloads in the manufacturing plant activities. Increase in activities in construction, metals & mining, and manufacturing industries also boost industrial brakes industry. The availability of technology driven solutions in automated brakes is anticipated to further drive the market growth.
Get Customized Report @ https://www.alliedmarketresearch.com/request-for-customization/4460?utm_source=OpenPr
However, the inconsistent prices of the materials required for brakes continues to fluctuate the profits margin for the market players. In addition, change in rates of foreign currency especially of Europe, post Brexit is also expected to influence the profit margins for the market players. The stringent government regulation associated with metals and mining processes to reduce their impact on the environment is also expected to challenge growth of the industrial brakes market in the coming years.
LIST OF TABLES
TABLE 1. INDUSTRIAL BRAKES MARKET REVENUE, BY TYPE, 2016-2023 ($MILLION)
TABLE 2. INDUSTRIAL BRAKES MARKET REVENUE FROM MECHANICALLY APPLIED BRAKES, BY REGION, 2016-2023 ($MILLION)
TABLE 3. INDUSTRIAL BRAKES MARKET REVENUE FROM HYDRAULICALLY APPLIED BRAKES, BY REGION, 2016-2023 ($MILLION)
TABLE 4. INDUSTRIAL BRAKES MARKET REVENUE FROM PNEUMATICALLY APPLIED BRAKES, BY REGION, 2016-2023 ($MILLION)
TABLE 5. INDUSTRIAL BRAKES MARKET REVENUE FROM ELECTRICALLY APPLIED BRAKES, BY REGION, 2016-2023 ($MILLION)
TABLE 6. INDUSTRIAL BRAKES MARKET REVENUE FROM DRUM & DISC BRAKES, BY REGION, 2016-2023 ($MILLION)
TABLE 7. INDUSTRIAL BRAKES MARKET REVENUE FROM SPRING APPLIED BRAKES, BY REGION, 2016-2023 ($MILLION)
TABLE 8. INDUSTRIAL BRAKES MARKET REVENUE, BY APPLICATION, 2016-2023 ($MILLION)
TABLE 9. INDUSTRIAL BRAKES MARKET REVENUE FROM HOLDING BRAKES, BY REGION, 2016-2023 ($MILLION)
TABLE 10. INDUSTRIAL BRAKES MARKET REVENUE FROM DYNAMIC & EMERGENCY, BY REGION, 2016-2023 ($MILLION)
TABLE 11. INDUSTRIAL BRAKES MARKET REVENUE FROM TENSION BRAKES, BY REGION, 2016-2023 ($MILLION)
TABLE 12. GLOBAL INDUSTRIAL BRAKES MARKET REVENUE, BY END-USER INDUSTRY, 2016-2023 ($MILLION)
TABLE 13. GLOBAL INDUSTRIAL BRAKES MARKET REVENUE FROM METALS & MINING, BY REGION, 2016-2023 ($MILLION)
TABLE 14. GLOBAL INDUSTRIAL BRAKES MARKET REVENUE FROM CONSTRUCTION, BY REGION, 2016-2023 ($MILLION)
TABLE 15. AUTOMOTIVE INDUSTRIAL BRAKES MARKET REVENUE FROM MANUFACTURING, BY REGION, 2016-2023 ($MILLION)
TABLE 16. INDUSTRIAL BRAKES MARKET REVENUE FROM ENTERTAINMENT, BY REGION, 2016-2023 ($MILLION)
TABLE 17. INDUSTRIAL BRAKES MARKET REVENUE FROM MARINE & SHIPPING, BY REGION, 2016-2023 ($MILLION)
TABLE 18. INDUSTRIAL BRAKES MARKET REVENUE FROM OTHERS, BY REGION, 2016-2023 ($MILLION)
TABLE 19. INDUSTRIAL BRAKES MARKET REVENUE, BY REGION, 2016-2023 ($MILLION)
TABLE 20. NORTH AMERICA INDUSTRIAL BRAKES MARKET, BY TYPE, 2016-2023 ($MILLION)
TABLE 21. NORTH AMERICA INDUSTRIAL BRAKES MARKET, BY APPLICATION, 2016-2023 ($MILLION)
TABLE 22. NORTH AMERICA INDUSTRIAL BRAKES MARKET, BY END-USER INDUSTRY, 2016-2023 ($MILLION)
TABLE 23. U.S. INDUSTRIAL BRAKES MARKET REVENUE, 2016-2023 ($MILLION)
TABLE 24. U.S. INDUSTRIAL BRAKES MARKET REVENUE, BY TYPE, 2016-2023 ($MILLION)
TABLE 25. U.S. INDUSTRIAL BRAKES MARKET REVENUE, BY APPLICATION, 2016-2023 ($MILLION)
TABLE 26. U.S. INDUSTRIAL BRAKES MARKET REVENUE, BY END-USER INDUSTRY, 2016-2023 ($MILLION)
TABLE 27. CANADA INDUSTRIAL BRAKES MARKET REVENUE, 2016-2023 ($MILLION)
TABLE 28. CANADA INDUSTRIAL BRAKES MARKET REVENUE, BY TYPE, 2016-2023 ($MILLION)
TABLE 29. CANADA INDUSTRIAL BRAKES MARKET REVENUE, BY APPLICATION, 2016-2023 ($MILLION)
TABLE 30. CANADA INDUSTRIAL BRAKES MARKET REVENUE, BY END-USER INDUSTRY, 2016-2023 ($MILLION)
TABLE 31. MEXICO INDUSTRIAL BRAKES MARKET REVENUE, 2016-2023 ($MILLION)
TABLE 32. MEXICO INDUSTRIAL BRAKES MARKET REVENUE, BY TYPE, 2016-2023 ($MILLION)
TABLE 33. MEXICO INDUSTRIAL BRAKES MARKET REVENUE, BY APPLICATION, 2016-2023 ($MILLION)
TABLE 34. MEXICO INDUSTRIAL BRAKES MARKET REVENUE, BY END-USER INDUSTRY, 2016-2023 ($MILLION)
TABLE 35. EUROPE INDUSTRIAL BRAKES MARKET, BY PRODUCT TYPE, 2016-2023 ($MILLION)
TABLE 36. EUROPE INDUSTRIAL BRAKES MARKET, BY APPLICATION, 2016-2023 ($MILLION)
TABLE 37. EUROPE INDUSTRIAL BRAKES MARKET, BY END-USER INDUSTRY, 2016-2023 ($MILLION)
TABLE 38. EUROPE INDUSTRIAL BRAKES MARKET, BY COUNTRY, 2016-2023 ($MILLION)
TABLE 39. GERMANY INDUSTRIAL BRAKES MARKET REVENUE, 2016-2023 ($MILLION)
TABLE 40. GERMANY INDUSTRIAL BRAKES MARKET REVENUE, BY TYPE, 2016-2023 ($MILLION)
TABLE 41. GERMANY INDUSTRIAL BRAKES MARKET REVENUE, BY APPLICATION, 2016-2023 ($MILLION)
TABLE 42. GERMANY INDUSTRIAL BRAKES MARKET REVENUE, BY END-USER INDUSTRY, 2016-2023 ($MILLION)
TABLE 43. FRANCE INDUSTRIAL BRAKES MARKET REVENUE, 2016-2023 ($MILLION)
TABLE 44. FRANCE INDUSTRIAL BRAKES MARKET REVENUE, BY TYPE, 2016-2023 ($MILLION)
TABLE 45. FRANCE INDUSTRIAL BRAKES MARKET REVENUE, BY APPLICATION, 2016-2023 ($MILLION)
TABLE 46. FRANCE INDUSTRIAL BRAKES MARKET REVENUE, BY END-USER INDUSTRY, 2016-2023 ($MILLION)
TABLE 47. UK INDUSTRIAL BRAKES MARKET REVENUE, 2016-2023 ($MILLION)
TABLE 48. U.K. INDUSTRIAL BRAKES MARKET REVENUE, BY TYPE, 2016-2023 ($MILLION)
TABLE 49. U.K. INDUSTRIAL BRAKES MARKET REVENUE, BY APPLICATION, 2016-2023 ($MILLION)
TABLE 50. U.K. INDUSTRIAL BRAKES MARKET REVENUE, BY END-USER INDUSTRY, 2016-2023 ($MILLION)
TABLE 51. RUSSIA INDUSTRIAL BRAKES MARKET REVENUE, 2016-2023 ($MILLION)
TABLE 52. RUSSIA INDUSTRIAL BRAKES MARKET REVENUE, BY TYPE, 2016-2023 ($MILLION)
TABLE 53. RUSSIA INDUSTRIAL BRAKES MARKET REVENUE, BY APPLICATION, 2016-2023 ($MILLION)
TABLE 54. RUSSIA INDUSTRIAL BRAKES MARKET REVENUE, BY END-USER INDUSTRY, 2016-2023 ($MILLION)
TABLE 55. REST OF EUROPE INDUSTRIAL BRAKES MARKET REVENUE, 2016-2023 ($MILLION)
TABLE 56. REST OF EUROPE INDUSTRIAL BRAKES MARKET REVENUE, BY TYPE, 2016-2023 ($MILLION)
TABLE 57. REST OF EUROPE INDUSTRIAL BRAKES MARKET REVENUE, BY APPLICATION, 2016-2023 ($MILLION)
TABLE 58. REST OF EUROPE INDUSTRIAL BRAKES MARKET REVENUE, BY END-USER INDUSTRY, 2016-2023 ($MILLION)
TABLE 59. ASIA-PACIFIC INDUSTRIAL BRAKES MARKET, BY PRODUCT TYPE, 2016-2023 ($MILLION)
TABLE 60. ASIA-PACIFIC INDUSTRIAL BRAKES MARKET, BY APPLICATION, 2016-2023 ($MILLION)
TABLE 61. ASIA-PACIFIC INDUSTRIAL BRAKES MARKET, BY END-USER INDUSTRY, 2016-2023 ($MILLION)
TABLE 62. ASIA-PACIFIC INDUSTRIAL BRAKES MARKET, BY COUNTRY, 2016-2023 ($MILLION)
TABLE 63. INDIA INDUSTRIAL BRAKES MARKET REVENUE, 2016-2023 ($MILLION)
TABLE 64. INDIA INDUSTRIAL BRAKES MARKET REVENUE, BY TYPE, 2016-2023 ($MILLION)
TABLE 65. INDIA INDUSTRIAL BRAKES MARKET REVENUE, BY APPLICATION, 2016-2023 ($MILLION)
TABLE 66. INDIA INDUSTRIAL BRAKES MARKET REVENUE, BY END-USER INDUSTRY, 2016-2023 ($MILLION)
TABLE 67. CHINA INDUSTRIAL BRAKES MARKET REVENUE, 2016-2023 ($MILLION)
TABLE 68. CHINA INDUSTRIAL BRAKES MARKET REVENUE, BY TYPE, 2016-2023 ($MILLION)
TABLE 69. CHINA INDUSTRIAL BRAKES MARKET REVENUE, BY APPLICATION, 2016-2023 ($MILLION)
TABLE 70. CHINA INDUSTRIAL BRAKES MARKET REVENUE, BY END-USER INDUSTRY, 2016-2023 ($MILLION)
TABLE 71. JAPAN INDUSTRIAL BRAKES MARKET REVENUE, 2016-2023 ($MILLION)
TABLE 72. JAPAN INDUSTRIAL BRAKES MARKET REVENUE, BY TYPE, 2016-2023 ($MILLION)
TABLE 73. JAPAN INDUSTRIAL BRAKES MARKET REVENUE, BY APPLICATION, 2016-2023 ($MILLION)
TABLE 74. JAPAN INDUSTRIAL BRAKES MARKET REVENUE, BY END-USER INDUSTRY, 2016-2023 ($MILLION)
TABLE 75. REST OF ASIA-PACIFIC INDUSTRIAL BRAKES MARKET REVENUE, 2016-2023 ($MILLION)
TABLE 76. REST OF ASIA-PACIFIC INDUSTRIAL BRAKES MARKET REVENUE, BY TYPE, 2016-2023 ($MILLION)
TABLE 77. REST OF ASIA-PACIFIC INDUSTRIAL BRAKES MARKET REVENUE, BY APPLICATION, 2016-2023 ($MILLION)
TABLE 78. REST OF ASIA-PACIFIC INDUSTRIAL BRAKES MARKET REVENUE, BY END-USER INDUSTRY, 2016-2023 ($MILLION)
TABLE 79. LAMEA INDUSTRIAL BRAKES MARKET, BY PRODUCT TYPE, 2016-2023 ($MILLION)
TABLE 80. LAMEA INDUSTRIAL BRAKES MARKET, BY APPLICATION, 2016-2023 ($MILLION)
TABLE 81. LAMEA INDUSTRIAL BRAKES MARKET, BY END-USER INDUSTRY, 2016-2023 ($MILLION)
TABLE 82. LAMEA INDUSTRIAL BRAKES MARKET, BY COUNTRY, 2016-2023 ($MILLION)
TABLE 83. LATIN AMERICA INDUSTRIAL BRAKES MARKET REVENUE, 2016-2023 ($MILLION)
TABLE 84. LATIN AMERICA INDUSTRIAL BRAKES MARKET REVENUE, BY TYPE, 2016-2023 ($MILLION)
TABLE 85. LATIN AMERICA INDUSTRIAL BRAKES MARKET REVENUE, BY APPLICATION, 2016-2023 ($MILLION)
TABLE 86. LATIN AMERICA INDUSTRIAL BRAKES MARKET REVENUE, BY END-USER INDUSTRY, 2016-2023 ($MILLION)
TABLE 87. MIDDLE EAST INDUSTRIAL BRAKES MARKET REVENUE, 2016-2023 ($MILLION)
TABLE 88. MIDDLE EAST INDUSTRIAL BRAKES MARKET REVENUE, BY TYPE, 2016-2023 ($MILLION)
TABLE 89. MIDDLE EAST INDUSTRIAL BRAKES MARKET REVENUE, BY APPLICATION, 2016-2023 ($MILLION)
TABLE 90. MIDDLE EAST INDUSTRIAL BRAKES MARKET REVENUE, BY END-USER INDUSTRY, 2016-2023 ($MILLION)
TABLE 91. AFRICA INDUSTRIAL BRAKES MARKET REVENUE, 2016-2023 ($MILLION)
TABLE 92. AFRICA INDUSTRIAL BRAKES MARKET REVENUE, BY TYPE, 2016-2023 ($MILLION)
TABLE 93. AFRICA INDUSTRIAL BRAKES MARKET REVENUE, BY APPLICATION, 2016-2023 ($MILLION)
TABLE 94. AFRICA INDUSTRIAL BRAKES MARKET REVENUE, BY END-USER INDUSTRY, 2016-2023 ($MILLION)
TABLE 95. ALTRA INDUSTRIAL MOTION CORP.: COMPANY SNAPSHOT
TABLE 96. ALTRA INDUSTRIAL MOTION CORP.: OPERATING SEGMENTS
TABLE 97. ALTRA INDUSTRIAL MOTION CORP.: PRODUCT PORTFOLIO
TABLE 98. ALTRA INDUSTRIAL MOTION CORP.: COMPANY SNAPSHOT
TABLE 99. ALTRA INDUSTRIAL MOTION CORP.: OPERATING SEGMENTS
TABLE 100. ALTRA INDUSTRIAL MOTION CORP.: PRODUCT PORTFOLIO
TABLE 101. ANTEC, S.A.: COMPANY SNAPSHOT
TABLE 102. ANTEC, S.A.: OPERATING SEGMENTS
TABLE 103. ANTEC, S.A.: PRODUCT PORTFOLIO
TABLE 104. CARLISLE BRAKE & FRICTION: COMPANY SNAPSHOT
TABLE 105. CARLISLE BRAKE & FRICTION: OPERATING SEGMENTS
TABLE 106. CARLISLE BRAKE & FRICTION: PRODUCT PORTFOLIO
TABLE 107. COREMO OCMEA S.P.A.: COMPANY SNAPSHOT
TABLE 108. COREMO OCMEA S.P.A.: OPERATING SEGMENTS
TABLE 109. COREMO OCMEA S.P.A.: PRODUCT PORTFOLIO
TABLE 110. EATON: COMPANY SNAPSHOT
TABLE 111. EATON: OPERATING SEGMENTS
TABLE 112. EATON: PRODUCT PORTFOLIO
TABLE 113. GKN WALTERSCHEID GMBH: COMPANY SNAPSHOT
TABLE 114. GKN WALTERSCHEID GMBH: OPERATING SEGMENTS
TABLE 115. GKN WALTERSCHEID GMBH: PRODUCT PORTFOLIO
TABLE 116. PINTSCH BUBENZER GMBH: COMPANY SNAPSHOT
TABLE 117. PINTSCH BUBENZER GMBH: OPERATING SEGMENTS
TABLE 118. PINTSCH BUBENZER GMBH: PRODUCT PORTFOLIO
TABLE 119. RINGSPANN GMBH: COMPANY SNAPSHOT
TABLE 120. RINGSPANN GMBH: OPERATING SEGMENTS
TABLE 121. RINGSPANN GMBH: PRODUCT PORTFOLIO
TABLE 122. SIBRE - SIEGERLAND BREMSEN GMBH: COMPANY SNAPSHOT
TABLE 123. SIBRE - SIEGERLAND BREMSEN GMBH: OPERATING SEGMENTS
TABLE 124. SIBRE - SIEGERLAND BREMSEN GMBH: PRODUCT PORTFOLIO
Access Full Summery @ https://www.alliedmarketresearch.com/industrial-brakes-market?utm_source=OpenPr
About Us
Allied Market Research (AMR) is a full-service market research and business-consulting wing of Allied Analytics LLP based in Portland, Oregon. Allied Market Research provides global enterprises as well as medium and small businesses with unmatched quality of "Market Research Reports" and "Business Intelligence Solutions.” AMR has a targeted view to provide business insights and consulting to assist its clients to make strategic business decisions and achieve sustainable growth in their respective market domain.
We are in professional corporate relations with various companies and this helps us in digging out market data that helps us generate accurate research data tables and confirms utmost accuracy in our market forecasting. Each and every data presented in the reports published by us is extracted through primary interviews with top officials from leading companies of domain concerned. Our secondary data procurement methodology includes deep online and offline research and discussion with knowledgeable professionals and analysts in the industry.
Contact:
David Correa
5933 NE Win Sivers Drive
#205, Portland, OR 97220
United States
Toll Free (USA/Canada):
+1-800-792-5285, +1-503-894-6022, +1-503-446-1141
UK: +44-845-528-1300
Hong Kong: +852-301-84916
India (Pune): +91-20-66346060
Fax: +1?855?550-5975
help@alliedmarketresearch.com
Web: https://www.alliedmarketresearch.com
This release was published on openPR.
Permanent link to this press release:
Copy
Please set a link in the press area of your homepage to this press release on openPR. openPR disclaims liability for any content contained in this release.
You can edit or delete your press release Global Industrial Brakes Market Expected to Reach $1,074 Million, Brief Analysis on Top Key players Akebono Brake Industry Co., Ltd., Altra Industrial Motion Corp., Antec, S.A., Carlisle Brake & Friction, Coremo Ocmea S.P.A., Eaton, GKN Walterscheid Gmbh, here
News-ID: 1332563 • Views: …
More Releases from Allied Market Research

Brown Grease Market In U.S. Size | Industry Thriving Worldwide at a Significant …
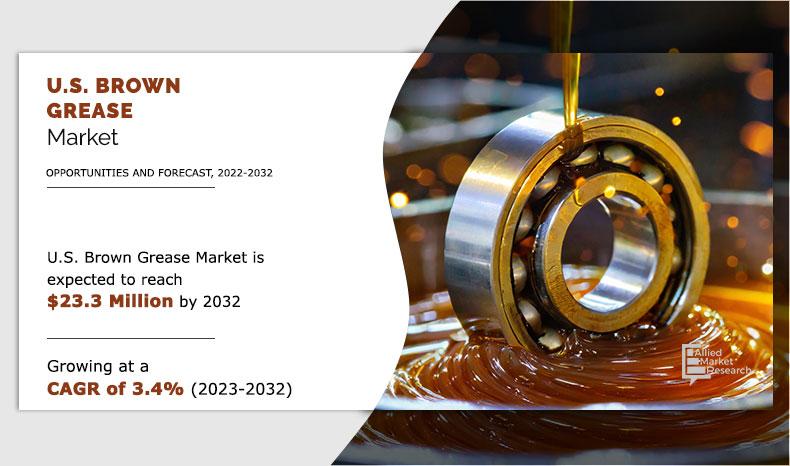
Allied Market Research published a new report, titled, U.S. Brown Greas Market " The report offers an extensive analysis of key growth strategies, drivers, opportunities, key segment, Porter's Five Forces analysis, and competitive landscape. This study is a helpful source of information for market players, investors, VPs, stakeholders, and new entrants to gain thorough understanding of the industry and determine steps to be taken to gain competitive advantage.
The…
Vietnam PET preforms Market Top Companies and Regional Average Pricing Analysis …
Allied Market Research published a new report, titled, " Vietnam PET Preforms Market." The report offers an extensive analysis of key growth strategies, drivers, opportunities, key segment, Porter's Five Forces analysis, and competitive landscape. This study is a helpful source of information for market players, investors, VPs, stakeholders, and new entrants to gain thorough understanding of the industry and determine steps to be taken to gain competitive advantage.
The report…

Oleochemicals Market Leading Global Top Companies and Regional Average Pricing A …
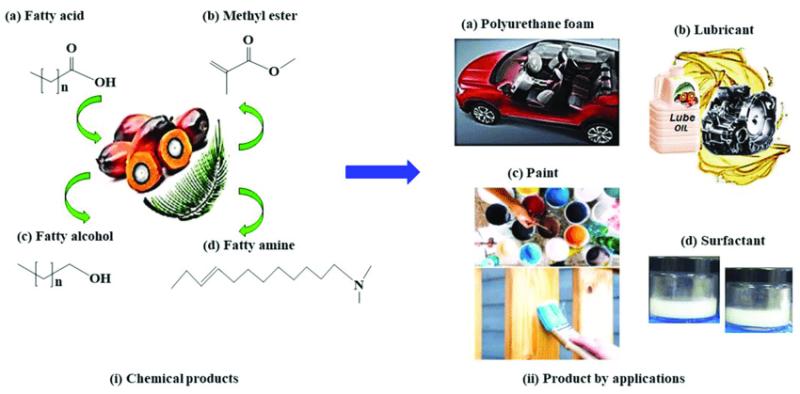
Allied Market Research published a report, titled, "Oleochemicals Market by Type (Fatty Acid, Fatty Alcohol, Glycerol, and Others) and Application (Pharmaceuticals, Personal Care & Cosmetics, Food & Beverages, Soap & Detergents, Polymers, and Others): Global Opportunity Analysis and Industry Forecast, 2023-2032." According to the report, the global Oleochemicals market was valued at $29.9 billion in 2022 and is projected to reach $55.2 billion by 2032, expanding at a CAGR of…

Smart Glass Market Size is Anticipated to Grow $15.1 Billion by 2030 | Growing a …
Allied Market Research published a report, "Smart Glass Market by Technology (Thermochromic, Photochromic, Electrochromic, Suspended Particle Device (SPD), Polymer Disperse Liquid Crystal (PDLC), and Others), and End user Industry (Transportation, Construction, Power Generation, and Others): Global Opportunity Analysis and Industry Forecast, 2021-2030". As per the report, the global smart glass industry is expected to reach $15.1 billion by 2030. The market accounted for $4.62 billion in 2020 and is predicted…
More Releases for TABLE
Table Tennis Table Market: Competitive Dynamics & Global Outlook 2024
LP INFORMATION offers a latest published report on Table Tennis Table Market Analysis and Forecast 2019-2025 delivering key insights and providing a competitive advantage to clients through a detailed report.
According to this study, over the next five years the Table Tennis Table market will register a xx% CAGR in terms of revenue, the global market size will reach US$ xx million by 2024, from US$ xx million in 2019.…
Flatwares Market Report 2018: Segmentation by Type (Table Knife, Table Fork, Tab …
Global Flatwares market research report provides company profile for Yamazaki, Reed & Barton, Elegance, Farberware, Gourmet Basics by Mikasa, BergHOFF, Cambridge Silversmith, Ginkgo, Wallace and Others.
This market study includes data about consumer perspective, comprehensive analysis, statistics, market share, company performances (Stocks), historical analysis 2012 to 2017, market forecast 2018 to 2025 in terms of volume, revenue, YOY growth rate, and CAGR for the year 2018 to 2025, etc. The…
Global Table Linen Market 2017: IKEA, URQUILDLINEN, Jomar Table Linens
WiseGuyReports.com adds “Global Table Linen Market Report 2017” reports to its Database.
With the slowdown in world economic growth, the Table Linen industry has also suffered a certain impact, but still maintained a relatively optimistic growth. The past four years, Table Linen market size maintained the average annual growth rate of 1.17% from 18200 million $ in 2013 to 19100 million $ in 2016. BisReport analysts believe that in the next…
Table Linen Market Forecast 2017-2022: IKEA, URQUILDLINEN, Premier Table Linens, …
Global Table Linen Market Research Report
A market study ” Global Table Linen Market ” examines the performance of the Table Linen market 2017. It encloses an in-depth Research of the Table Linen market state and the competitive landscape globally. This report analyzes the potential of Table Linen market in the present and the future prospects from various angles in detail.
Inquiry For Sample Report, Click Here: http://bit.ly/2s0g8nd
The Global Table Linen Market…
Global and Chinese Table Tennis Table Market Demand Growth Report 2017
Research carried out a market study on the Table Tennis Table market. The report titled, “Table Tennis Table ”, is an in-depth analysis of the Table Tennis Table market and offers important insights related to the market such as market share, size and growth. The presented study discusses the current trends, opportunities and the challenges in the Table Tennis Table market. Key statistics, growth prospects and the current status…
Billiard Table Manufacturer, Pool Table Supplies
Chevillotte Billiards manufactures the highest standard quality billiards table in the world. Our manufacturing facility has been making billiard table and it's accessories since the 1860's and earned a lots of name and respects in the billiards industry. We manufacture our billiards products as per the requirements of the clients and also assist customized solutions to them. Our range is designed as per the latest market trends and is ideal…
