Press release
ENERGY AUDIT: BEGIN ACHIEVING LONG-TERM SAVINGS

What is An Energy Audit?
The goal of an energy audit is to get accurate energy data that shows you where your facility’s energy went over the period; which equipment, circuits, buildings or divisions consumed the energy; and exactly when this usage occurred.
If you’re a facilities technician or engineer, you can use a data logger to identify these savings areas. Data logger users can monitor energy usage as part of an energy audit to identify areas for future savings.
Start Saving With This Quick Checklist
What Information Do You Already Have?
Your first step in any energy audit is to look at your facility’s existing energy data, along with any other relevant information that has already been documented. This data usually takes the form of utility bills, invoices and meter readings, which are a good starting point.
Do You Know What Data You Need to Record?
To accurately measure Power and Energy, you need to measure Voltage, Current, Power factor and Time—however, you don’t always need to go to those lengths to perform an energy audit! In fact for the purposes of an energy audit, you often only need to measure Current! You can usually treat voltage as a ‘constant’ meaning that there’s no need to record it.
Do You Need to Log More Than One Value?
In some specific cases, you may need to log both current and voltage to get a more detailed view of your energy consumption. For this purpose, many data logger models can record both values. You can also record additional values such as temperature or flow, perhaps with the goal of reducing energy consumption or avoiding costly process delays. As an example, a common data logger application is to monitor boiler or tank temperature and simultaneously send the data to a PID control system for real-time process optimization.
Do You Have Circuit Diagrams?
Before you begin logging data, you’ll need to know the electrical layout of the system or premises to be audited. Ask an electrician to produce the wiring diagram for the premises.
If you don’t have a circuit diagram, you should create one to use in the audit. The diagram should show you the various circuits and connections of your system, and in turn, this may help you to determine the best points to monitor data, and where to get access.
Where Are Your Main Culprits?
Typical energy-wasters include heavy engines, compressors, ovens, boilers, HVAC systems and more. Heavy equipment is usually a great place to start monitoring, with an eye to reducing their consumption or otherwise limiting unnecessary runtime.
Do You Have a Device to Record Data? During an energy audit, you need to record data over a period of time, and for this, you’ll need a data logger. Once the recording period is over, users can then analyze the collected data using logger software to identify possible savings areas.
How Do You Want To Document The Energy Audit?
It’s always a good idea to document the audit process. Your documentation should note where you logged the data and should also include a brief summary containing weather data, production data, and other business-related data over the logging period. All this will help you to correlate the information in future and to spot factors which may have caused anomalies.
Why Should You Use a Data Logger?
Data loggers have several features which make them ideal for performing an energy audit:
Data Measurement – Identify opportunities to save energy
Continual Recording – Identify performance issues with supply and equipment
Data Analysis – Calculate the monetary value of future energy savings
Analysis & Graphing Software -This lets you identify the power consumption over the logging period. You can also produce graphs as proof of savings to management and/or financiers.
These devices can be located throughout a facility and installed directly at the piece of equipment or machinery under monitoring. They can operate ‘standalone’ (on their own) or can be centralized to transmit energy consumption data to a central data server or workstation PC for analysis.
Our Accsense Electrocorder samples every channel 16 times per cycle, a cycle being 16ms at 60Hz and 20ms at 50Hz. At the end of each averaging period, 3 quantities are saved for each channel: the True RMS average; the Max, which is the highest cycle value during the period; and the Min, the lowest cycle value. Electrocorder will record all the peaks and troughs which are one cycle or longer, enabling truly detailed metering.
How Long Should You Record Data?
In an energy audit there are two main approaches to data collection:
Start with the incoming power and record your facility’s total usage profile over a given period of time (at least a week). Start working your way down each of the major circuits, getting a view of the profile, averages, and peaks on each.
If you already know the demand and particularly where/what the big energy consumers are, then instead go straight for those loads.
How Can You Prove the Results?
Even the most accurate data is meaningless if it’s not presented to the right person in a meaningful format. To gain the benefits of an energy audit, it’s critical to not only collect recent data but also to ensure that this data is readily available to management, facility supervisors and/or energy system financiers. Today’s software typically has filters and zoom functions allowing you to focus on only the data that you’re interested in.
Data logger software typically allows you to define the voltage to plot power and energy, then upload recorded data via USB to a PC for analysis. If you log for a period of about a week, analysis software such as the free Electrosoft software can extrapolate the data and give you estimated power/energy figures for a month, quarter and year. This way, all the collected energy data can be documented, analyzed, and portrayed.
With some software applications, you can also print out an Audit Output graph showing proof of the details of the facility’s energy usage and performance so owners and technicians can easily identify savings areas. This is especially useful for HVAC&R verification. Note that it’s always wise to check these results against your energy bills to make sure there are no fundamental mistakes.
Summary
To sum up, your facility can probably benefit from an energy audit if it’s done methodically and results in getting accurate data. Make sure that you first confer with your facility’s technicians regarding what data to collect and where to collect it. Using data logger analysis software, you can then get the actionable data and graphs that you need to go to management/financiers.
Where Can I Learn More?
ISO 50002:2014 is a new International Standard providing helpful information on energy audits for all types of facilities and organizations. ISO EN50001 offers businesses and organizations an actionable way to save on energy costs but requires users to record hard data. However, organizations are free to choose their own energy targets and to form an achievable action plan to reach them.
The ISO 50002:2014 standard is published here:
https://www.iso.org/obp/ui/#iso:std:iso:50002:ed-1:v1:en
For further information on the Accsense Electrocorders, energy audits, or to find the ideal solution for your application-specific needs, contact a CAS Data Logger Application Specialist at (800) 956-4437 or visit www.dataloggerinc.com
Computer Aided Solutions, LLC. dba CAS DataLoggers is a distributor of data loggers, paperless recorders and data acquisition equipment.
We have the industry’s most complete selection of data logging equipment, with hundreds of different models from more than 18 manufacturers. With data loggers from 1 to 300 channels we can record temperature, humidity, force/strain, pressure, flow, voltage, current, resistance, vibration and other digital signals, in connection with serial (RS-232/RS-485), CAN/OBD or SDI-12 devices. We sell directly to end users and also work through a network of distributors and resellers throughout the United States, Canada, Central and South America.
CAS DataLoggers
8437 Mayfield Rd Unit 104
Chesterland, OH 44026
This release was published on openPR.
Permanent link to this press release:
Copy
Please set a link in the press area of your homepage to this press release on openPR. openPR disclaims liability for any content contained in this release.
You can edit or delete your press release ENERGY AUDIT: BEGIN ACHIEVING LONG-TERM SAVINGS here
News-ID: 1329909 • Views: …
More Releases from CAS DataLoggers
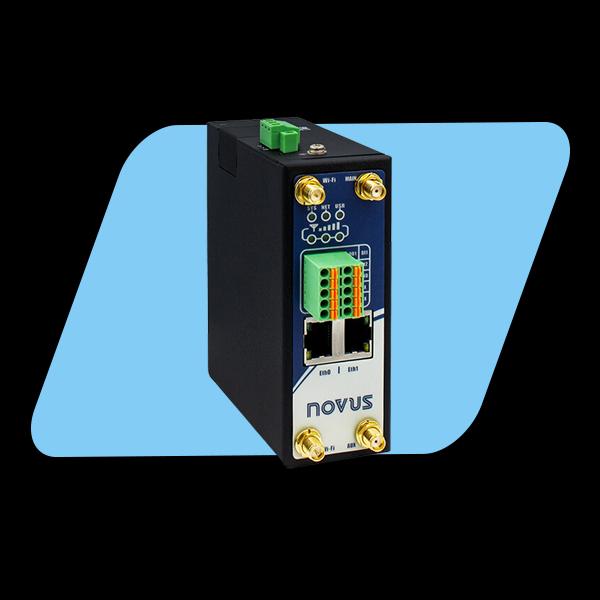
New AirGate 4G Cellular Router from Novus
NOVUS presents AirGate 4G, an industrial VPN router for cellular networks. Data sending is secure with this new device as it uses encryption protocols and firewall systems most commonly used in IT infrastructures, including automatic fallback for 4G, 3G, and 2G cellular networks. AirGate 4G is CE Mark certified and was developed for industrial environments. It can maintain its high availability performance even in extended operation situations, being equipment suitable…
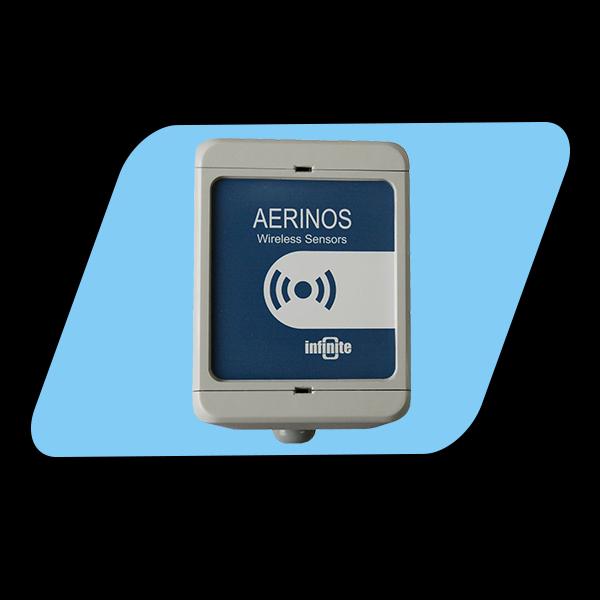
New AERINOS ADS-300 from Infinite Informatics
New Wireless NB-IoT/LTE-M Data Collection End Node
CAS DataLoggers is pleased to introduce the new AERINOS ADS-300 wireless sensor end node from Infinite Informatics. The ADS-300 is designed to transmit data via either NB-IoT/LTE-M cellular networks and is targeted at remote monitoring applications. NB-IoT is a wireless protocol designed for the Internet of Things that offers very low-power operation using either existing GSM or newer LTE cellular technology. NB-IoT is a…
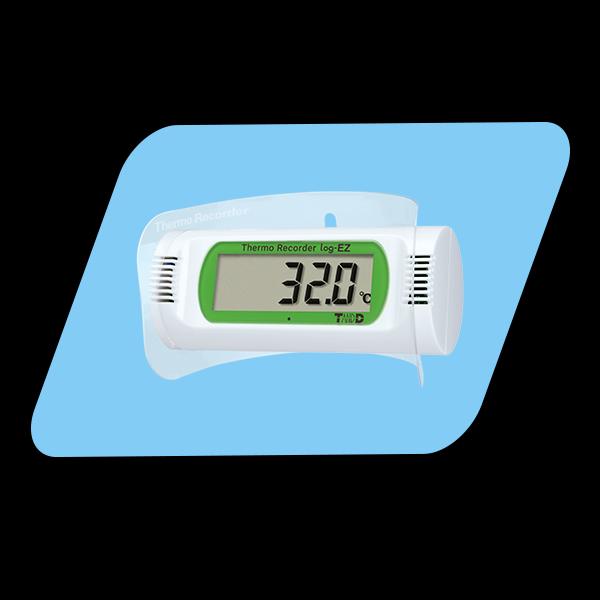
New TR32B Bluetooth Data Logger From TandD
CAS DataLoggers is pleased to announce the updated TR32B log-EZ as an effective low-cost solution for temperature and humidity measurement. The log-EZ is designed as a compact, user-friendly data logger to easily measure and record ambient temperature and humidity. It provides Bluetooth communication and a smartphone/tablet app that can display and upload data to the cloud. The TR32B provides a measurement range of 0° to 50° Celsius (32° to 122°…
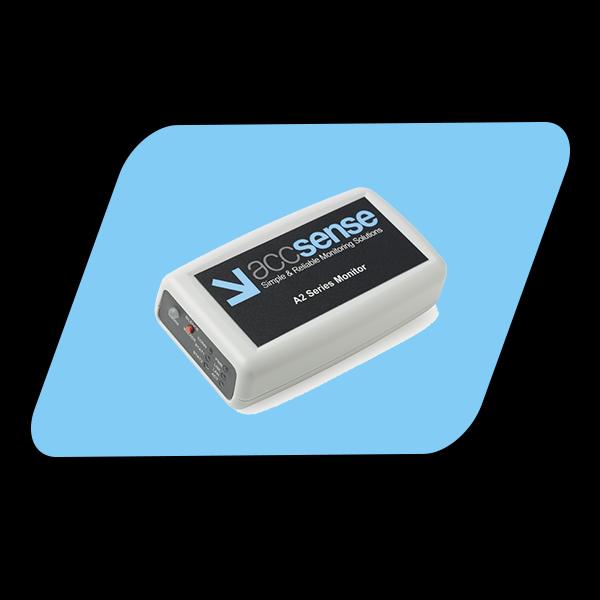
New A2-06 Temperature & Alarming Monitoring Pod by CAS
Medical storage applications depend heavily on monitoring the temperature of their goods in cold storage to protect items such as vaccines, blood, medicine, and tissue samples. CAS DataLoggers is pleased to introduce the A2-06 Ethernet Wired Temperature Measurement Pod designed for measuring temperatures in medical refrigerators, freezers, incubators, and in cryogenic storage. The pod is an Ethernet LAN-wired temperature monitor with connections for two external RTDs and a thermocouple sensor.…
More Releases for Data
HOW TO TRANSFORM BIG DATA TO SMART DATA USING DATA ENGINEERING?
We are at the cross-roads of a universe that is composed of actors, entities and use-cases; along with the associated data relationships across zillions of business scenarios. Organizations must derive the most out of data, and modern AI platforms can help businesses in this direction. These help ideally turn Big Data into plug-and-play pieces of information that are being widely known as Smart Data.
Specialized components backed up by AI and…
Global Data Analytics Outsourcing Market |data analytics outsourcing, big data o …
Market Research Reports Search Engine (MRRSE) has been serving as an active source to cater intelligent research report to enlighten both readers and investors. This research study titled “Global Data Analytics Outsourcing Market “
The report on data analytics outsourcing market provides analysis for the period 2016 – 2026, wherein 2018 to 2026 is the forecast period and 2017 is the base year. The report covers major trends and technologies playing…
Test Data Management (TDM) Market - test data profiling, test data planning, tes …
The report categorizes the global Test Data Management (TDM) market by top players/brands, region, type, end user, market status, competition landscape, market share, growth rate, future trends, market drivers, opportunities and challenges, sales channels and distributors.
This report studies the global market size of Test Data Management (TDM) in key regions like North America, Europe, Asia Pacific, Central & South America and Middle East & Africa, focuses on the consumption…
Data Prep Market Report 2018: Segmentation by Platform (Self-Service Data Prep, …
Global Data Prep market research report provides company profile for Alteryx, Inc. (U.S.), Informatica (U.S.), International Business Corporation (U.S.), TIBCO Software, Inc. (U.S.), Microsoft Corporation (U.S.), SAS Institute (U.S.), Datawatch Corporation (U.S.), Tableau Software, Inc. (U.S.) and Others.
This market study includes data about consumer perspective, comprehensive analysis, statistics, market share, company performances (Stocks), historical analysis 2012 to 2017, market forecast 2018 to 2025 in terms of volume, revenue, YOY…
Long Term Data Retention Solutions Market - The Increasing Demand For Big Data W …
Data retention is a technique to store the database of the organization for the future. An organization may retain data for several different reasons. One of the reasons is to act in accordance with state and federal regulations, i.e. information that may be considered old or irrelevant for internal use may need to be retained to comply with the laws of a particular jurisdiction or industry. Another reason is to…
Data Quality and Data Governance Solution Market - Demand For Cost-Effective Dat …
In the enterprise data management ecosystem, data quality is a broad term which refers to the quality, integrity, and consistency of data and/or process etc. Data quality also implies the degree of data accuracy and consistency. On the other hand, data governance focusses on the management of data assets by assigning authority, control, and responsibility of data and encompasses three key areas: people, process, and technology.
Data quality and data governance…