Press release
United States Building Energy Management Systems Market (2018-2024)-6Wresearch
United States Building Energy Management Systems Market (2018-2024)-6Wresearch
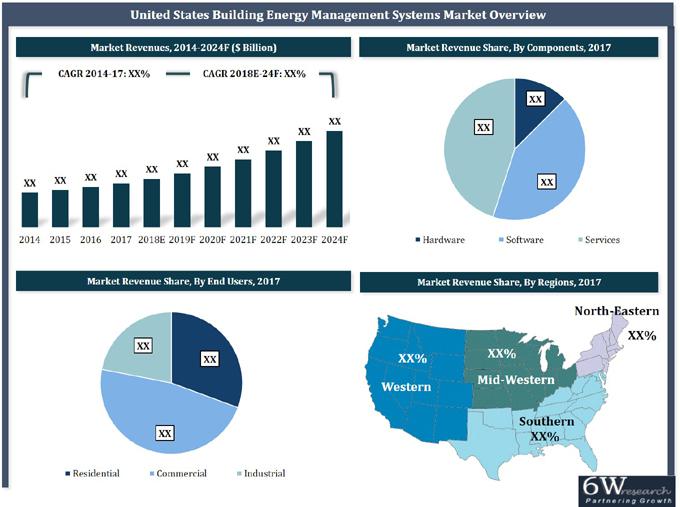
Rising electricity prices, government incentives for promoting building energy efficiency as well as growing awareness amongst end users regarding sustainable development and environment related issues are the key drivers which would fuel the market for building energy management systems in the United States.
According to 6Wresearch, the United States Building Energy Management Systems Market is expected to grow at a CAGR of 12.2% during 2018-24. Several advantages of integrated BEMS hardware and software system includes: budgets & variance reports, utility bill tracking, real-time metering and collection of energy data usage by various equipment such as heating, ventilation, lighting and air conditioning, making them quite popular among residential and commercial users. Government initiatives such as Southern California Edison (SCE), and App Lab coupled with promoting the use of LEDs and CFLs in all residential, commercial and industrial sectors would further fuel the demand for BEMS systems in the country during the forecast period.
Download sample Pages@ https://www.6wresearch.com/market-reports/united-states-building-energy-management-systems-market-2018-2024-forecast-components-services-end-users-applications-competitive-landscape.html
According to EIA, industrial energy consumption is projected to rise in all three main sub industrial areas namely, non-manufacturing, energy-intensive manufacturing, and nonenergy-intensive manufacturing. Rising electricity tariffs are also making industrial and manufacturing players lean towards building energy management systems and would make industrial sector to grow at the highest CAGR during the forecast period.
The report comprehensively covers the United States Building Energy Management Systems Market by components, hardware components, end users, applications, and regions. The report offers an unbiased and detailed analysis of the current trends, opportunities and market drivers that would help the stakeholders to design and align their market strategies according to the current and future market dynamics.
Key Highlights of the Report:
• Historical Data of Global Building Energy Management Systems Market Revenues for the Period 2014-2017
• Market Size & Forecast of Global Building Energy Management Systems Market Revenues until 2024
• Historical Data of United States Building Energy Management Systems Market Revenues for the Period 2014-2017
• Market Size & Forecast of United States Building Energy Management Systems Market Revenues until 2024
• Historical Data of United States Building Energy Management Systems Market Revenues for the
Period 2014-2017, By Components & Services
• Market Size & Forecast of United States Building Energy Management Systems Market Revenues
until 2024, By Components & Services
• Historical Data of United States Building Energy Management Systems Market Revenues for the
Period 2014-2017, By Hardware Components
• Market Size & Forecast of United States Building Energy Management Systems Market Revenues
until 2024, By Hardware Components
• Historical Data of United States Building Energy Management Systems Market Revenues for the
Period 2014-2017, By Applications
• Market Size & Forecast of United States Building Energy Management Systems Market Revenues
until 2024, By Applications
• Historical Data of United States Building Energy Management Systems Market Revenues for the
Period 2014-2017, By End User
• Market Size & Forecast of United States Building Energy Management Systems Market Revenues
until 2024, By End User
• Historical Data of United States Building Energy Management Systems Market Revenues for the
Period 2014-2017, By Regions
• Market Size & Forecast of United States Building Energy Management Systems Market Revenues
until 2024, By Regions
• Market Drivers and Restraints
• Market Trends and Developments
• Players Market Share and Competitive Landscape
• Company Profiles
• Strategic Recommendations
Markets Covered
The report provides detailed analysis of the following market segments:
• By Components & Services
o Hardware
o Software
o Services
• By Hardware Components
o Sensors
o Controllers
o Actuators
o Others (Smart Meters, Gateways)
• By End Users
o Residential
o Commercial
o Industrial
• By Applications
o Space Heating
o Computers & office equipment
o Lighting
o Air Conditioning
o Others (Refrigeration, Water Heating, Ventilation)
• By Regions
o Western
o Southern
o Mid-Western
o North Eastern
Table Of Content
1. Executive Summary
2. Introduction
2.1 Report Description
2.2 Key Highlights of The Report
2.3 Market Scope & Segmentation
2.4 Research Methodology
2.5 Assumptions
3. Global Building Energy Management Systems Market Overview
3.1. Global Building Energy Management Systems Revenues, 2014-2024F
4. United States Building Energy Management Systems Market Overview
4.1. Country Indicators
4.2. United States Building Energy Management Systems Revenues, 2014-2024F
4.3. United States Building Energy Management Systems Market Industry Life Cycle
4.4. United States Building Energy Management Systems Market Porter’s Five Force Model
4.5. United States Building Energy Management Systems Revenue Share, By Components, 2017 & 2024F
4.6. United States Building Energy Management Systems Revenue Share, By Hardware, 2017 & 2024F
4.7. United States Building Energy Management Systems Revenue Share, By End User, 2017 & 2024F
4.8. United States Building Energy Management Systems Revenue Share, By Applications, 2017 & 2024F
4.9. United States Building Energy Management Systems Revenue Share, By Regions, 2017 & 2024F
5. United States Building Energy Management Systems Market Dynamics
5.1. Market Dynamics and Impact Analysis
5.2. Market Drivers
5.3. Market Restraints
6. United States Building Energy Management Systems Market Trends
6.1 Building Internet of Things (BIoT)
7. United States Building Energy Management Systems Market Overview, By Components & Services
7.1. United States Building Energy Management Systems Hardware Market Revenues, 2014-2024F
7.2. United States Building Energy Management Systems Software Market Revenues, 2014-2024F
7.3. United States Building Energy Management Systems Services Market Revenues, 2014-2024F
8. United States Building Energy Management Systems Market Overview, By Hardware
8.1. United States Sensors Building Energy Management Systems Market Revenues, 2014-2024F
8.2. United States Actuators Building Energy Management Systems Market Revenues, 2014-2024F
8.3. United States Controllers Building Energy Management Systems Market Revenues, 2014-2024F
8.4. United States Other Hardware Building Energy Management Systems Market Revenues, 2014- 2024F
9. United States Building Energy Management Systems Market Overview, By Applications
9.1. United States Space Heating Application Building Energy Management Systems Market Revenues, 2014-2024F
9.2. United States Lighting Application Building Energy Management Systems Market Revenues, 2014 – 2024F
9.3. United States Air Conditioning Building Energy Management Systems Market Revenues, 2014-2024F
9.4. United States Computer & Office Equipment Building Energy Management Systems Market
Revenues, 2014-2024F
9.5. United States Other Applications Building Energy Management Systems Market Revenues, 2014-2024F
10. United States Building Energy Management Systems Market Overview, By End Users
10.1. United States Commercial Building Energy Management Systems Market Revenues, 2014-2024F
10.2. United States Residential Building Energy Management Systems Market Revenues, 2014- 2024F
10.3. United States Industrial Building Energy Management Systems Market Revenues, 2014-2024F
11. United States Building Energy Management Systems Market Overview, By Regions
11.1. United States Southern Region Building Energy Management Systems Market Revenues, 2014-2024F
11.2. United States Western Region Building Energy Management Systems Market Revenues, 2014-2024F
11.3. United States Mid-Western Region Building Energy Management Systems Market Revenues, 2014- 2024F
11.4. United States North-Eastern Region Building Energy Management Systems Market Revenues, 2014- 2024F
11.5 United States Regional Indicators
12. United States Building Energy Management Systems Market, Key Performance Indicators
12.1. United States Power Sector Outlook
12.2. United States Construction Sector Sector Outlook
13. United States Building Energy Management Systems Market Opportunity Assessment
13.1. By Applications
13.2. By Components
14. United States Building Energy Management Systems Market – Competitive Landscape
14.1 United States Building Energy Management Systems Market Company Share (2017)
14.2 Competitive Benchmarking, By Components
15. Company Profiles
15.1. American Auto-Matrix, Inc.
15.2. Automated Logic Corporation
15.3. BuildingIQ, Inc.
15.4. Ecova Inc.
15.5. Honeywell International Inc.
15.6. Johnson Controls International plc
15.7. Lucid Design Group, Inc.
15.8. Siemens AG
15.9. Schneider Electric S.E
15.10. Trane Inc.
16. Strategic Recommendations
17. Disclaimer
List of Figures
1. Global Building Energy Management Systems Market Revenues, 2014 – 2024F ($ Billion)
2. United States Building Energy Management Systems Market Revenues, 2014 – 2024F ($ Million)
3. United States Building Energy Management Systems Market- Industry Life Cycle, 2017
4. United States Building Energy Management Systems Market Revenue Share,
By Components & Services, 2017 & 2024F
5. United States Building Energy Management Systems Market Revenue Share,
By Hardware Components, 2017 & 2024F
6. United States Building Energy Management Systems Market Revenue Share, By End User, 2017 & 2024F
7. United States Building Energy Management Systems Market Revenue Share, By Applications, 2017 & 2024F
8. United States Building Energy Management Systems Market Revenue Share, By Regions, 2017 & 2024F
9. U.S. Average Electricity Prices & Consumption for Residential Users, 2015-2019, (Billion KWh/Day, Cents/KWh)
10. U.S. Average Electricity Prices & Consumption for Commercial Users, 2015-2019 (Billion KWh/Day, Cents/KWh)
11. U.S. Average Electricity Prices & Consumption for Industrial Users, 2015-2019 (Billion KWh/Day, Cents/KWh)
12. U.S. Number of Policies & Incentives in United States, 2017
13. United States Total CO2 Emissions from all Energy Sources, 2017-2019F, (Million Metric Tons of Carbon Dioxide)
14. U.S. Total Energy Residential Sector CO2 Emissions, 2017-2018 (Million Metric Tons of Carbon Dioxide)
15. U.S. Total Energy Commercial Sector CO2 Emissions, 2017-2018 (Million Metric Tons of Carbon Dioxide)
16. U.S. Total Energy Industrial Sector CO2 Emissions, 2017-2018 (Million Metric Tons of Carbon Dioxide)
17. U.S. Total Energy Electric Power Sector CO2 Emissions, 2017-2018 (Million Metric Tons of Carbon Dioxide)
18. United States Building Energy Management Systems Hardware Market Revenues, 2014 – 2024F ($ Million)
19. United States Building Energy Management Systems Software Market Revenues, 2014 – 2024F ($ Million)
20. United States Building Energy Management Systems Services Market Revenues, 2014 – 2024F ($ Million)
21. United States Sensors Building Energy Management Systems Market Revenues, 2014 – 2024F ($ Million)
22. United States Actuators Building Energy Management Systems Market Revenues, 2014 – 2024F ($ Million)
23. United States Controllers Building Energy Management Systems Market Revenues, 2014 – 2024F ($ Million)
24. United States Other Hardware Building Energy Management Systems Market Revenues, 2014 – 2024F ($ Million)
25. United States Space Heating Application Building Energy Management Systems Market
Revenues, 2014 – 2024F ($ Million)
26. United States Lighting Application Building Energy Management Systems Market
Revenues, 2014 – 2024F ($ Million)
27. United States Air Conditioning Application Building Energy Management Systems
arket Revenues, 2014 – 2024F ($ Million)
28. United States Computer & Other Office Equipment Application Building Energy Management
Systems Market Revenues, 2014 – 2024F ($ Million)
29. United States Other Applications Building Energy Management Systems Market Revenues, 2014 – 2024F ($ Million)
30. United States Commercial Building Energy Management Systems Market Revenues, 2014 – 2024F ($ Million)
31. United States Average Price of Electricity to Commercial Customers, 2017 (Cents/ kwh)
32. United States Electricity Consumption by Commercial Sector, 1990-2040F (Billion kwh/Year)
33. United States Consumption of Electricity by Commercial Sector, 2017 (Trillion Btu)
34. United States Residential Building Energy Management Systems Market Revenues, 2014 – 2024F ($ Million)
35. United States Residential Sector Electricity Consumption, 2014-40 (Billion Kwh)
36. United States Industrial Building Energy Management Systems Market Revenues, 2014 – 2024F ($ Million)
37. United States Energy Consumption by Industry Type, 2016 & 2040 (Trillion Btu)
38. United States Industrial Sector Energy Consumption, 2017-18 (Billion Kwh)
39. United States Southern Region Building Energy Management Systems Market Revenues, 2014 – 2024F ($ Million)
40. United States Western Region Building Energy Management Systems Market Revenues, 2014 – 2024F ($ Million)
41. United States Mid-Western Region Building Energy Management Systems Market
Revenues, 2014 – 2024F ($ Million)
42. United States North-Eastern Region Building Energy Management Systems Market
Revenues, 2014 – 2024F ($ Million)
43. United States Southern Region Energy Consumption, 2016-2024 (Quadrillions Btu)
44. United States North-Eastern Region Energy Consumption, 2016-2024 (Quadrillion Btu)
45. United States Mid-Western Region Energy Consumption, 2016-2024 (Quadrillion Btu)
46. United States Western Region Energy Consumption, 2016-2024 (Quadrillions Btu)
47. United States Southern Region CO2, 2016-2024 (Million Metric Tones)
48. United States North-Eastern Region CO2, 2016-2024 (Million Metric Tones)
49. United States Mid-Western Region CO2, 2016-2024 (Million Metric Tones)
50. United States Western Region CO2, 2016-2024 (Million Metric Tones)
51. United States Electricity Generation Capacity, 2014-2019 (Thousand MWh/Day)
52. United States Electricity Consumption, 2015-2019 (Million kWh/ day)
53. United States Energy Consumption by Sector, Jan-Oct 2017 (Trillion Btu)
54. United States Sales, Revenue, and Average Price of Electricity to End Users, November 2017
55. United States Energy Consumption by Sector, 2018-24 (Trillion Btu)
56. United States Construction Industry Value, 2014-2020 ($ Billion)
57. United States Total Value of Construction Put in Place, 2014-21 ($ Billion)
58. United States Construction Put in Place in Residential Sector, 2014-2020 ($ Billion)
59. United States Construction Put in Place in Office Sector, 2014-2020 ($ Billion)
60. United States Construction Put in Place in Health Care Sector, 2014-2020 ($ Billion)
61. United States Construction Put in Place in Non-Residential Sector, 2014-2020 ($ Billion)
62. United States Construction Put in Place in Manufacturing Sector, 2014-2020 ($ Billion)
63. United States Construction Put in Place in Non-Commercial Sector, 2014-2020 ($ Billion)
64. United States Building Energy Management Systems Market Overview, By Applications, 2024
65. United States Building Energy Management Systems Market Overview, By Components, 2024
66. United States Building Energy Management Systems Market Revenues, By Company, 2017
67. United States Regional Electricity Sales, 2014-2019 (Billion kWh/Day)
68. Residential Electricity Retail Sales in Southern Region, 2014-2020 (Billion kWh/Day)
69. Commercial Electricity Retail Sales in Southern Region, 2014-2020 (Billion kWh/Day)
70. Industrial Purchased Electricity Consumption in United States, 2015-2024 (Quadrillion Btu)
71. United States Purchased Electricity Consumption in Industrial Sector, By Regions, 2015-2019 (Billion kWh/day)
List of Tables
1. United States Upcoming Commercial Projects
2. United States Commercial Energy Intensity by End Use, 2016 & 2017 (Btu/ sq. ft.)
3. United States Residential Sector Electricity Consumption by End Use, 2017
4. United States Upcoming Residential Projects
5. United States Upcoming Industrial Projects
6. United States Sales, Revenue, and Average Price of Electricity to End Users, November 2017
7. United States Upcoming Industrial Projects
For Description and Purchase Options Visit: https://www.6wresearch.com/market-reports/united-states-building-energy-management-systems-market-2018-2024-forecast-components-services-end-users-applications-competitive-landscape.html
Related Topics :Saudi Arabia Building Automation & Control Market (2015-2021): Market Forecast by Systems Types (Physical Security Systems (Video Surveillance, Access Control, Alarming System and Fire Safety Systems & Equipment), Building Energy Management Systems (Lighting Control and Air Conditioning Systems) and Others (Parking Management, Water Management and Elevator & Escalator)), Verticals (Banking & Financial, Government & Transportation, Retail & Logistics, Commercial Offices, Industrial & Manufacturing, Residential, Hospitality & Healthcare and Education Institutions) and Regions (Central, Southern, Western and Eastern)
6Wresearch is the premier, one stop market intelligence and advisory center, known for its best in class business research and consulting activity. We provide industry research reports and consulting service across different industries and geographies which provide industry players an in-depth coverage and help them in decision making before investing or enter into a particular geography.
Delhi/NCR Office
1107-1108, PEARLS BEST HEIGHTS
TOWER 1, NETAJI SUBHASH PLACE
PITAMPURA, New Delhi-110034
Email sales@6wresearch.com
Phone: +911143024305
Website : https://www.6wresearch.com
This release was published on openPR.
Permanent link to this press release:
Copy
Please set a link in the press area of your homepage to this press release on openPR. openPR disclaims liability for any content contained in this release.
You can edit or delete your press release United States Building Energy Management Systems Market (2018-2024)-6Wresearch here
News-ID: 1316779 • Views: …
More Releases from 6Wresearch- Market Intelligence Solutions
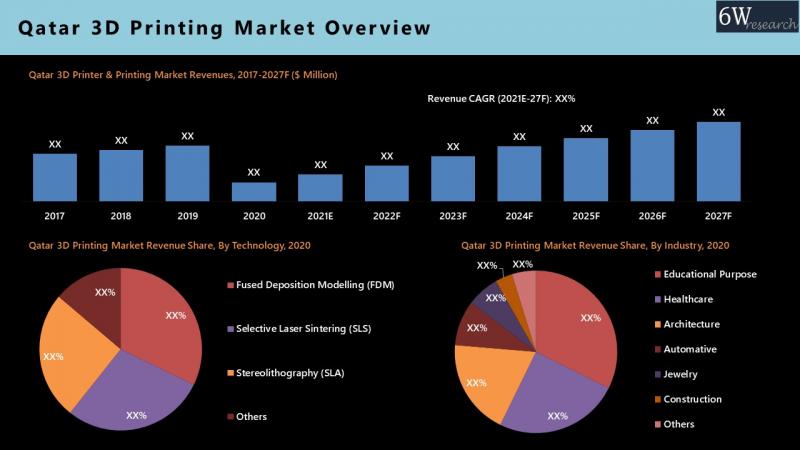
Qatar 3D Printing Market Is Projected To Grow At A CAGR Of 19.6% During 2021-202 …
The fused deposition modelling printer acquired majority revenue and volume share in the year 2020– 6WResearch
3D Printer market is mainly import driven in Qatar and major importing partners are Italy and China. Qatar government is promoting 3D technological development in the country. Thus, there’s no value added tax imposition on import of 3D printers, only general duty is implied which would boost the adoption rate of 3D printers in the…
India Agriculture Equipment Market (2019-2025)
Market Forecast By Products (Tractors ( Up To 30 HP, 30.1 HP- 70 HP, 70.1 HP- 130 HP & 130.1 HP- 200 HP), Harvesters (Up To 30 HP, 30.1 HP- 70 HP, 70.1 HP- 130 HP & 130.1 HP- 200 HP), Threshers (Up To 30 HP & 30.1 HP- 70 HP), Pumps (Up To 30 HP, 30.1 HP- 70 HP, 70.1 HP- 130 HP, 130.1 HP- 200 HP & Above…
Commercial Application To Drive The Growth Of UPS Systems In Vietnam - 6Wresearc …
UPS systems are witnessing mounting adoption by different end-user applications ranging from residential households, small commercial offices to large industrial enterprises. Moreover, factors such as inflow of FDI in industrial and manufacturing segments, growing power demand and increasing infrastructure projects in Vietnam have further fueled the demand for UPS systems in the country.
According to 6Wresearch, Vietnam UPS Systems Market Revenues are projected to grow at a CAGR of 4.7% during…
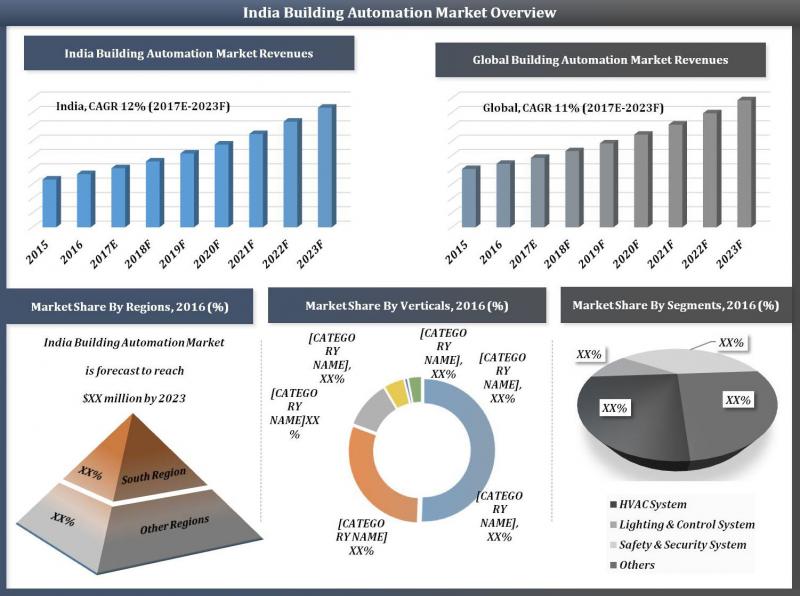
India Building Automation and Control Market (2017-23)
Market Forecast by Types (HVAC (Thermostat Controller, Zone & Climate Control, Temperature Sensor and Others), Lighting & Control System (Relay System & Controllable Breaker, Sensors & Dimming Systems and Others), Safety & Security System (Video Surveillance Systems, Access Control Systems, Intrusion Detection Systems and Fire & Safety Equipment) and Others), Verticals (Government & Transportation, Retail, Commercial Offices, Residential, Healthcare & Hospitality and Others), Regions (Northern, Eastern, Western and Southern) and…
More Releases for United
Movable Walls Market By Top Key Players- Hufcor (United States), Dormakaba (Swit …
Global Movable Walls Market Report from Advance Market Analytics (AMA) covers market characteristics, size and growth, segmentation, regional breakdowns, competitive landscape, market shares, trends and strategies for this market. The market characteristics section of the report defines and explains the market. The market size section gives the electronic equipment market revenues, covering both the historic growth of the market and forecasting the future. Drivers and restraints looks at the external…
Military Personal Protective Equipment Market 2024 | 3M Ceradyne (United States) …
Military personal protective equipment has become a crucial and standard element of soldier equipment. One of the major factor driving the market is the increasing role of ground troops in different parts of the world such as Iraq, Afghanistan and India among others. The demand for military personal protective equipment is anticipated to be driven by modernization initiatives undertaken by several large defense spenders globally and various internal security threats,…
Infrared Sensor Market 2024 | Honeywell International, Inc. (United States), Tex …
Infrared sensors are devices emitting, detecting, receiving infrared waves as heat and infrared radiation. However, there are only a few among these sensors which are capable of only receiving the waves. Most of the infrared detectors are coated with either Fresnel lenses or parabolic mirrors for receiving infrared waves from an entire area. As these waves reach the sensor, it generates a voltage in different waves that is used for…
Internet of Things Market 2021 | Google Inc. (United States), Cisco Systems Inc. …
The Internet of Things refers to the network of physical objects that attribute an IP address for Internet connectivity. Internet of Things is defined as an invisible and intelligent network of things that communicate indirectly or directly with each other. Internets of Things enable communication between the physical objects and other internet-enabled systems and devices. In addition, Internet of Things also makes the life of consumers much more comfortable and…
Logistics Market | Global Growing Industry Key Players - J.B. Hunt Transport Ser …
Market Research Reports Search Engine (MRRSE) has recently updated its massive research catalog by adding a new study, titled “Logistics Market”. The study offers a clear insight about the prevailing trends and innovations happening in the Logistics Market. Readers can further access details about research highlights and executive summary to gain a better idea about this assessment. The market overview covers key industry developments and market opportunity map during the…
Global Logistics Market 2024 | Key Players : J.B. Hunt Transport Services (Unite …
A fresh report has been added to the wide database of Market Research Report Search Engine (MRRSE). The research study is titled “Logistics Market – Global Industry Analysis, Size, Share, Growth, Trends, and Forecast 2016 – 2024” which encloses important data about the production, consumption, revenue and market share, merged with information related to the market scope and product overview.
Request for a sample of this research report @ https://www.mrrse.com/sample/2184
Logistics is…